Acta med. nagasaki . 8 : 94-109
The Experimental Study on Organ Lipoprotein Lipase, Especially in Relation to the Lung
Hisashi YAMADA*
Second Department of Internal Medicine, Nagasaki University School of Medicine,
Nagasaki, Japan
Received for publication March 5, 1964
Determination of the lipolytic activity in various organs of rats were done by means of organ homogenate in vitro, the significance of the lipolytic activity was more characterized by the inhibition study of the Lipoprotein Lipase (LPL). The activity of the lung tissue was high followed
by the cardiac muscle or adipose tissue. After force feeding fat meal or after heparin administration in vitro, the significant elevation was observed.
And also after carbon tetrachloride poisoning or aseptic pneumonia induced by silver nitrate solution injection, the lipolytic activity in the lung increased with the endogeneous lipid transportation from the depot fat to the liver tissue. The histological character of the lung tissue is rich in arterioles and capillaries and also rich in mast cells and the lung has a anatomical speciality ; the first organ to be approached by exogeneous lipid. These findings suggest that the lung is one of the organs which produce LPL and may display some role in the exogeneous and endogeneous lipid transportation.
In 1943 HAHN" discovered the rapid clearing of alimentary lipemia in dogs by the injection of heparin, and in 1950 Anderson and Fawcett"
demonstrated that plasma obtained after heparin injection contained a factor which cleared lipemia in vitro.
Many studies""''"'' on clearing factor were achieved in the past 20 years and the clearing factor was proved to be anew enzyme, which was neither esterase, pancreatic lipase nor tributylinase. Although the clearing factor has not yet been obtained in pure form, its action has been definite to catalyse the hydrolysis of triglyceride moiety of chylo- microns and low density lipoproteins, because free fatty acid was liberated in plasma during the clearing of the postalimental lipemic plasma.
On the other hand, studies on the Lipoprotein Lipase (LPL) activity in the tissue"' "°'"were at first undertaken in adipose tissue concern- ing a nutritional state or a neurohumoral disturbances, and in cardiac
*山 田 久
muscle""' .-i' which takes up free fatty acid as the energy source.
Although there are many difficulties in method to determine LPL activity of the tissue, LPL in plasma and in tissue would be identical by the theoretical point of view").
It is generally believed that LPL plays a important role in transfer of fat from the circulating blood into a peripheral tissues""").
It has been supposed by some investigators that the disturbance of the lipid metabolism might happen in pulmonary diseases""", because lipemia has been often observed clinically in pneumonia and lung cancer, and fatty liver has been recognized in autopsies of pulmonary tuberculosis'".
Also, the lung is anatomically positioned as the first organ to be approached from the exogeneous fat.
These facts would be sufficient to suggest the close relationship between the lung and neutral lipid transportation in lipid metabolism.
In this study, two experiments on LPL activity were undertaken for the resolution of these problems. The first was the improvement of the LPL assay-method because the leading method has been insuffi- cient in sensitivity to detect it in tissues and the second was to eval- uate the LPL activity in lung comparing with adipose tissue, liver, heart and kidney which were thought to be the most active organ in lipid metabolism, especially in lipoprotein and non-esterified fatty acid (NEFA) metabolism.
I. Experiment for Confirmation of LPL Activity Assay in Organ.
Materials and Method
Preparation of materials ; Wister-strain male albino rats from 180 to 250 g body weight, were used. The rats were fed with regular stock diet and water ad libitum until the biginning of the experiment. The experimental animals were fasted overnight before the experiment, and were anesthetized with 5 mg/100g body weight sodium pentobarbital
and then they were killed by decapitation. Each organ was immediately removed, and washed with physiological saline solution. Each tissue, weighing exactly 500 mg was placed into the glass homogenizer with 2 ml of 0.9% physiological saline solution. After homogenizing them in the cold, the homogenate was centrifuged for 10 minutes at 3000 rpm in 0°C, the supernatant layer was separated, and each ml of them was
supplied to the measurement of lipolytic activity (LA).
Assay of lipolytic activity ; The substrate consisted of 0.1 vol. of 20 Fatgen (sesame oil emulsion), 1 vol. of dogs oxalated plasma (pooled from several dogs, heated at 56°C for 10 minutes, immediatly cooled, centrifuged to remove the fibrin and stored at -20°C), 1 vol. of 5%
bovine albumin and 2 vol. of tris-hydroxymethyl aminomethane buffer (pH 7.7). The substrate was preincubated at 37°C for 30 minutes just before use,
96 STUDY ON LPL IN LUNG Vol. 8.
Immediately after mixing 1 ml of the sample into 2 ml of substrate, 1 ml of the mixture was pipetted into Dole's'") extraction mixture and remaining mixture was continued to incubated at 37°C for 60 minutes.
Thereafter 1 ml of the mixture was also pipetted into the Dole's mixture.
NEFA was measured by Dole's method"'). Namely, 1 ml of sample are added into a glass-stoppered test tube with 5 ml extraction mixture and shaken for 10 minutes. And then 3 ml heptane and 2 ml water are added and the mixture are shaken again for 5 minutes. To a final tube containing 1 ml Dole's titration mixture is transferred 3 ml of the heptane layer and it is then titrated with 0.018 N sodium hydroxide while being agitated with a stream of nitrogen. The heptane layers from appropriate titration blanks and palmitic acid standards are similarly titrated, in every experiment. The differences of NEFA concentration in the mixture before and after the incubation were calcurated. The protein concentration in the homogenate was determined by Biuret's method, and then the unit of activity was expressed m, e moles of linoleic acid formed per hour per mg protein.
Results
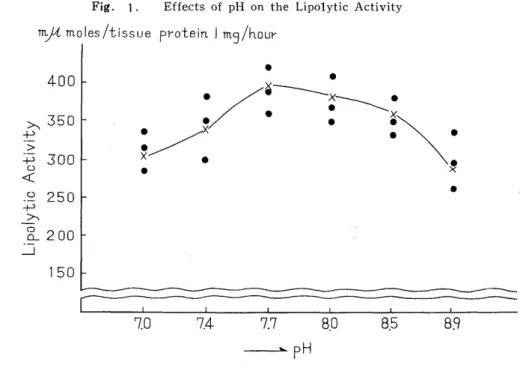
The effect of pH in the reactions medium were observed. The lipolytic activity was measured by using the lung homogenate in the following varing pH of the substrate, pH 7.0, 7.4, 7.7, 8.0, 8.5 and 8.9. The results were shown in Fig. 1.
Fig. 1. Effects of pH on the Lipolytic Activity
These observations suggest that pH 7.7 is optimum for the measu- rement of the lipolytic activity.
As a fatty acid acceptor in the reaction mixture, the bovine albumin solution were used, and the influence of albumin concent- ration was observed.
The lipolytic activities were measured by using the lung homogenate in the following varing the concentration, 2.5%, 5.0%, , 10.0%, 20.0 and 0.9% physiological saline solution, instead of albumin solution.
The results were shown in Fig. 2.
Fig. 2
It seems that 5 % albumin solution in the reaction mixture is quite enough as the fatty acid acceptor.
When dog plasma was used as a part of the substrate, an influence of the inhibitor must be taken into consideration. B. HOOD"', G.
ANGERVALL22'23' , F. C. MONKHOUSE and P. G. MACKNESON24' had studied the inhibitor in plasma which was removed by heating the plasma in
56°C. This problem was examined. Postheparin plasma was used as a lipolytic enzyme source. (The dog blood was collected at 10 minutes after an intravenous injection of 100 units of heparin per 100g of body weight, and plasma was obtained by centrifuging the blood for 10 minutes at 3000 rpm in cold.)
98 STUDY ON LPL IN LUNG Vol. n.
Fig. 3. Effects of heating at 56°C for varing lengths of
time on pools of dog plasma.
Fig. 4. Effects of Incubation Time on the Lipolytic Activity.
Heating 10 minutes appears optimum, therefore, the dog plasma used for the substrate was heated in a water bath at 56°C for 10 minutes, cooled immediately, centrifuged, and stored at -20°C.
Incubation time: Using lung homogenate as the lipolytic enzyme source, the lipolytic activity was measured in various incubation time.
As the results shown in Fig. 4, approximately quadratic curve was obtained. This curve shows that the amount of the lipolytic activity in the first 60 minutes was larger than that in the next 60 minutes.
Discussion
The pH in the medium, the concentration of albumin solution added to the substrate as NEFA acceptor, and the incubation time were examined and the optimal conditions in this enzymatic reaction system were obtained. High level of the lipolytic activities were detected in pH 7.7 which is in close agreement with the results of G. Murakami and others. The object for the NEFA acceptor was attained completely by adding 5 % albumin solution to the medium. It is agreeable to the results of D. S. Robinson and others that the increase rate of NEFA was linear in the first 60 minutes incubation.
When G. Angervall, B. Hood"~")~ and others studied on the lipemia clearing enzyme in plasma of the atherosclerotic patients and hypercholesterolemic patients, they discovered an inhibitory effect in the post-heparin plasma on the clearing phenomenon. And thereafter the details of this inhibitory factor was studied by several investigators.
F. C. Monkhouse24' and others examined exactly the inhibitor which inhibits the release of NEFA from the chylomicrons in plasma, and they pointed out the variation of inhibitory effects in species and individuals.
In this experiment of LPL assay in tissues, the dog oxalated plasma was used in the substrate, and the inactivation of inhibitors in the plasma were done by means of heating them at 56°C in water bath according to the techinique of Monkhouse. And the affection of this treatment on the lipolytic activity was detected.
The results above mentioned, emphasized that it is better to use the inhibitor free plasma when dog plasma is used as substrate, because the influence of the inhibitor is so great as approximately one half time of it leading.
II. Experiment for Evaluation of LPL Activity in various Organs especially in Lung.
Treatment of Animals.
The animals, which were supplied in this experiment, were in similar condition to the previous experiment and divided into three groups.
1) Six rats were injected 0.25m1/100g body weight of carbon tetra- chloride into the gluteus muscle, and other five rats were fed 0.5
100 STUDY ON LPL IN LUNG Vol. 8.
ml/100g body weight of a mixture consisting 1 vol. of carbon tetrachloride and 1 vol. of -olive oil. Force-feeding was done through a stomach tube under sodium pentobarbital anaesthesia (intraperitoneal injection of 5 mg/100g body weight). Sixteen hours after carbon tetrachloride admini- stration, these rats were killed by decapitation.
2) Eight.rats were force-fed 0.5 ml/100g body weight of olive oil.
Four rats were killed after 3 hours and other four rats after 5 hours by decapitation.
3) Five rats were administered with 0.05 ml of 1%' silver nitrate solution by intratracheal injection and killed after 24 hours. At this
time, the findings of aseptic pneumonia were seen macro- and microsco- pically.
Immediately after autopsy of these 3 type treated rats, lung, adipose tissue, liver, kidney and heart were removed for the determin- ation of lipolytic activity.
Results
1) The lipolytic activity of various organs in intact rats. Using the above described techinique, the LA of the lung, liver, heart, kidney
and adipose tissue in rats (8 examples) were measured.
The results are shown in Table 1. The lipolytic activities of the heart, lung, and adipose tissue were significantly greater than those of the liver and kidney.
Table 1.
Lipolytic Activity in Various Organs of Intact Rats.
earLiver
257*
D.±39
t Adipose Kidney' HOrgan Lungtissue
No. 1 483 283 570 534 294
2 405 238 498 453 356
3 424 256 526 434 264
4 392 300 601 505 202
5 368 344 501 537 244
6 434 273 566 474 224
7 455 242 483 521 238
8 466 307 541 514 228
Mean value 427 279 534 497
± S.±36 ±46±35 ±31
* Lipolytic Activity is expressed as mµ moles/tissue protein 1 mg/hour .
2) The lipolytic activity after fat administration.
Eight rats were force-fed with olive oil by stomach tube, and were divided into two groups (4 : 4). The first group were killed after 3 hours and the second group 5 hours after force-feeding. In both groups
the lipolytic activity of the lung, adipose tissue and heart were markedly increased, (P<0.01) but that of the liver and kidney changed insignificantly. In comparing these two groups, changes of the LA of the organs were more marked in the first group. (See Table 2)
Table 2.
Lipolytic Activity after force-feeding of Olive Oil by Stomach Tube.
Liver HeartOrgan
No.
O Lung t~issue5e Kidney
1 672 299 556 778 308
2 491 292 688 702 322
3 629 310 620 921 280
4 660 296 626 756 290
Mean value 612 299 623 790 301*
± S D. ±71 ±69 ±48 ±79 ±18
5 534 316 547 794 312
6 463 275 588 836 273
7 481 327 533, 609 301
8 575 261 510 664 329
Mean value 510 296 544 726 304*
± S. D. ±44 +28 +27 ±93 ±21
Lipolytic Activity is expressed as mµ moles/tissue protein 1 mg/hour.
~$ No. 1 ^No. 4 : 3' hours after the force-feeding.
No. 5 -- No. 8 : 5 hours after the force-feeding.
3) Effect of Heparin Administration in vitro.
The lipolytic activity of each organ in intact rats were measured by adding heparin into the reaction mixture. The results were given
Table 3.
Effects of Heparin added in vitro on the Lipolytic Activity.
arLiver
287*
±
t Adipose KidneyOrgan Lung' Hetissue
No. 1 518 307 609 513 308
2 532 443 548 561 287
3 560 283 591 541 266
4 518 256 587 569 280
Mean value) 532 276 I 584 546
S. D. ±18 ±20 ±22 ±20 ±14
# 100u. of Heparin was added into the Medium.
Lipolytic Activity is expressed as mµ moles/tissue protein 1 mg/hour.
102 STUDY ON LPL IN LUNG Vol. 8.
in Table 3. Increase of the lipolytic activity in the lung (P<0.01) and heart (P<0.05) were significant. There were no significant change in other tissues.
4) Effect of various inhibitors to the lipolytic activity in each organ.
Hitherto, the LA of organs were measured with these homogenate.
It was thought that the tissue contains lipoprotein lipase and many other esterases and these enzyme would display lipolytic activity.
Twenty mg protamine sulfate, 1M of high density sodium chloride and 0.2 M of sodium fluoride were added to the reaction medium respectively. When protamine sulfate was added to the reaction medium, the pH of the medium dropped down to pH 6.2 6.3, so that the pH was readjusted immediately to pH 7.7-7.8 by addition of dilute sodium hydroxide. Thereafter the alteration of the lipolytic activities were observed, these results are summarized in Table 4.
The inhibitory effects on enzyme were 77.0-86.4% by protamine sulfate and 72.0-90.0% by sodium chloride in the heart, 59.0-78.8%
Table 4.
Effects of the Various Inhibitors on the Lipolytic Activity in Intact Rats
None Inhibitory Added None Inhibitory Added None Inhibitory 0
74.9± 5.8 42.8± 5.1
81.7± 3.9 82.8±
8
74.7±81.1 57.034.3
niiniiorory Added None
Inhibitors
No, of Protamine Sulfate (20mg) Sodium Chloride (1M) Sodium Fluoride (0.2M)
Organ IhbI
y InhibitorythbtSamples Added No Effect in /o Effect m io Added None Effect in ,o
Lung 4 (182 466 61.0°0 (105 466 77.5,0 (259 441 39.2°0
Mean value (112 410 72.5 ( 67 410 84.0 (220 410 48.2
± S. D. (179 437 59.0 (136 437 68.6 (242 378 36.5
( 77 364 78.8 (112 364 69.0 (228 448 49.2
678+82
Liver 4 (266 344 22.8 (263 344 23.8 (109 344 68.4
Mean value (157 276 43.3 (185 276 32.1 (116 317 63.7
± S. D. (184 300 38.6 (202 300 31.8 (102 279 63.5
(228 327 30.2 (279 327 14.5 ( 96 327 70.2
33.7± 8.0 25.6± 7.2 66.5± 2.9
Heart 4 ( 68 491 86.4 ( 93 491 80.8 (315 491 36.0
Mean value ( 50 565 84.5 ( 65 565 88.2 (423 565 30.0
F S. D. (107 498 78.2 ( 50 498 90.0 (354 498 28.5
(111 484 77.0 (136 484 72.0 (330 484 31.8
7.1 31.6± 2.8
Adipose ( 56 482 88.5 ( 64 42 86.8 (353 482 26.6
tissue 4 ( 92 445 70.0 (120 445 73.0 (297 465 36.2
Mean value ( 48 497 90.4 (152 497 68.5 (321 497 35.4
± S. D. (104 421 75.2 (121 421 70.1 (288 421 30.5
+11 97.2 32.2± 3.9
Kidney 4 (115 294 60.5 (135 294 54.0 (224 294 23.4
Mean value ( 96 224(148 224(122 224 45.0
± S. D. (122 304 59.9 (152 304 49.5 (178 304 40.8
(106 238 55.5 (109 238 54.0 (125 238 47.2
583+ 21 479+ 8.1 39.1± 7.9
LA is expressed as my moles/tissue protein 1 mg/hour,
by protamine sulfate and 68.6-84.0% by sodium chloride in the lung, 70.0-90.4% by protamine sulfate and 68.5-86.8% by sodium chloride in the adipose tissue. These organs were inhibited in high percentage.
But the inhibitory effects of sodium fluoride were in low percentage in these three organs. On the contrary to these results, the inhibitory effects in the liver were 22.8-43.3% by protamine sulfate, 14.5-32.1
% by sodium chloride and 63.5-70.2% by sodium fluoride.
5) Alteration of the lipolytic activity after carbon tetrachloride poisoning.
At sixteen hours after carbon tetrachloride poisoning, they were sacrificed, and the LA of each organ was measured. These results are given in Table 5. The lipolytic activities in the adipose tissue, lung and heart were significantly increased (P<0.05-0.01), but those in the damaged liver and kidney did not show any remarkable change.
Table 5.
Lipolytic Activity in Organs from Carbon Tetrachloride Poisoned Subjects.
earLiver
±44
t Adipose KidneyOrgan Lung' Htissue
No. 1 530 304 632 574 214
2 483 269 596 820 292
3 516 280 664 615 244
4 612 252 596 607 272
5 456 315 581 680 289
6 486 290 608 582 306
7 442 353 544 746 258
8 435 308 589 705 278
Mean value 497 298 612 668 268*
S. D. ±58+27 ±78 ±27
'~ Lipolytic Activity is expressed as m,t moles/tissue protein 1 mg/hour .
For the purpose to find the alteration of the LPL activity itself, the inhibitory effects by protamine sulfate, sodium chloride and sodium fluoride were measured, and these results are summarized in Table 6.
The inhibitory effects were 63.4-71.0% by protamine sulfate and 52.5 - 60 .3 % by sodium fluoride in the lung, 67.0 - 76.6 % by protamine sulfate and 49.3-53.0% sodium fluoride in the adipose tissue, 75.0- 81.4% by protamine sulfate and 27.2-42.0% by sodium fluoride in the heart, 40.3-55.6%, by protamine sulfate and 30.6-42.2% by sodium fluoride in the kidney.
A remarkable change was found in the inhibitory effect in adipose tissue by sodium fluoride (P<0.01). The increment of the lipolytic
104 STUDY ON LPL IN LUNG Vol. 8.
Table 6.
Effects of the Various Inhibitors on the Lipolytic Activity after Carbon Tetrachloride Poisoning.
Inhibitory
%/ % lEffect
67.0±3.1 66.6±7.2 41.0±1.3
78.6±2.7 78.3±4.0
71.0±4.1 63.1±3.6
Added Nonene
Inhibitors
No, of Protamine Sulfate (20mg) Sodium Chloried (1M) Sodium Fluoride (0.2M) Organ
I Inhibitory Added None Inhibitory
Samples Added Noi
n o0Effect m Effect m
Lung 3 (173 516 66.5 (126 516 75.6 (299 516 42.0
Mean value (167 456 63.4 (190 456 58.0 (265 456 41.8
± S. D. (143 487 71.0 (163 487 66.3 (296 487 39.2
Liver 3 (182 280 35.0 (172 280 38.8 (133 280 52.5
Mean value (234 314 25.6 (185 314 41.2 (144 314 54.5
± S. D. (154 291 47.0 (161 291 44.6 (115 291 60.3
35.8±8.8 41.5±2.4 55.8±3.4
Heart 3 (175 702 75.0 (183 702 74.0 (511 702 27.2
Mean value (109 585 81.4 (136 585 77.0 (339 580 42.0
± S. D. (114 570 79.5 ( 94 570 83.5 (343 570 39.7
36.4+_6.5
Adipose 3 (266 615 76.6 (254 615 58.6 (312 615 49.3
tissue (209 680 69.0 (221 680 67.5 (322 680 53.0
Mean value (193 582 67.0 (213 582 63.4 (287 582 50.6
± S. D.51.0±1.5
Kidney 3 (146 244 40.3 (136 244 44.5 (170 244 30.6
Mean value (129 289 55.3 (146 289 50.6 (184 289 36.5
± S. D. (136 306 55.6 (129 306 57.8 (177 306 42.2
50.5±7.2 51.0+_ 5.4 36.5±4.7
# LA is expressed as mµ moles/ tissue protein 1 mg/hour.
activity in the adipose tissue would be owing to the lipase which is inhibited by sodium fluoride.
6) Alteration of the lipolytic activity after administration of carbon tetrachloride and olive oil.
Table 7.
Lipolytic Activity after force-feeding of Carbon Tetrachloride and Olive Oil Mixture by Stomach Tube.
HeartLiver
±
H Adipose KidneyOrgan Lungtissue
No. 1 562 269 740 635 255
2 594 298 792 812 272
3 615 308 736 672 238
4 555 322 710 820 245
Mean value 581 301 745 735 251
S. D, i-27 ±21 ±31 ±15 ±14
* Lipolytic Activity is expressed as mµ moles/tissue protein 1 mg/hour .
At sixteen hours after administration of carbon tetrachloride and olive oil mixture to the rats, they were sacrificed and the LA of each organ was measured. The results are given in Table 7.
The increase of the LA in the lung were somewhat higher than those only carbon tetrachloride was administered. There was no change on the LA in the liver. The increase of the LA in the adipose tissue was almost in same degree, and in the heart was higher than those only carbon tetrachloride was administered (P<0.01).
7) Alteration of the lipolytic activity after aseptic pneumonia.
Twenty-four hours after aseptic pneumonia was induced by silver nitrate solution administration in rats, they were sacrificed and the LA of each organ were determined. The results are summarized in Table 8.
Table 8.
Lipolytic Activity after Aseptic Pneumonia which was caused by Silver Nitrate Injection.
S.
Liver Heart Adipose Kid
neyOrgan Lungtissue
No. 1 589 273 687 704 242
2 532 248 733 646 230
3 623 285 641 765 251
4 504 232 706 605 273
5 532 266 725 776 254
Mean value 556 260 699 700 251*
± D. ±42±65 ±15
i ±±19 34
* Lipolytic Activity is expressed as m -t moles/tissue protein 1 mg/hour
In the lung tissue and also in the adipose tissue, the lipolytic activities were increased (P<0.01), similar to those of the carbon tetrachloride administration. There were no remarkable change in the
liver and kidney. In the heart tissue, the LA was somewhat increased (P<O.01).
In this experiment, the inhibitory effects were 57.0-67.1% by protamine sulfate and 38.8-49.4% by sodium fluoride in the lung, 31.8-44.0% by protamine sulfate and 45.4-64.0% sodium fluoride in
the liver, 53.0 - 77.1 % by protamine sulfate and 42.6 - 56.4 % by sodium fluoride in the adipose tissue, 69.8 - 80.5 % by protamine sulfate and 33.8 - 45.4% by sodium fluoride in the heart, 52.6 - 60.0 % by protamine
sulfate and 34.2-42.5% by sodium fluoride in the kidney.
The inhibitory effects in the adipose tissue by sodium fluoride increasen significantly (P<0.01) similar to the carbon tetrachloride poisoning. (Table 9)
106 STUDY ON LPL IN LUNG Vol. 8.
Table 9.
Effects of the Various Inhibitors on the Lipolytic Activity after Aseptic Pneumonia
Inhibitors
Inhibitory Added None Inhibitory Added None 1 InhibitorySamples
~Effect
62.5±4.2 63.6±
76.4±4.6 80.2±1.8
± S.
39.3±
niniiorory Added Noneone
No, of Protamine Sulfate (20mg) Sodium Chloride (1M) Sodium Fluoride (0.2M)
Organ -Ihb'tIhbt
y Added None InhibitoryAdded N
E_ ffect in_ in ;Effect in °o
Lung 3 (217 589 63.1°0 (189 589 68.0°0 (298 5891 49.4%
Mean value (175 532 67.1 (214 532 59.9 (325 532 38.8
± S. D. (217 504 57.0 (186 504 63.0 (301 504 42.0
3.3 43.5± 4.4
Liver 3 (186 272 31.8 (201 272 26.1 (149 272 45.4
Mean value (164 248 33.8 (161 248 35.0 ( 90 248 62.6
± S. D. (130 232 44.0 (155 232 33.4 ( 84 232 64.0
36.5±5.4 31.4±3.9 52.0±10.0
Heart 3 (149 688 78.4 (122 688 82.1 (428 688 37.8
Mean value (222 734 69.8 (149 734 79.6 (485 734 33.8
± S. D. (137 707 80.5 (156 707 77.9 (386 707 45.4 39.0± 4.8
Adipose (331 704 53.0 (184 704 74.0 (307 704 56.4
tissue 3 (147 646 77.1 (240 646 68.5 (323 646 50.0
Mean value (216 605 64.0 (151 605 75.0 (348 605 42.6
D. 648+g8 725+29 49.7± 5.6
Kidney 3 ( 97 242 60.0 (115 242 52.5 (139 242 42.5
Mean value (109 230 52.6 ( 85 230 63.1 (151 230 34.2
(124 273 54.5 (121 273 44.4 (161 273 41.2
55.7±3.1 53.417.73.6
LA is expressed as mµ moles/tissue protein 1 mg/hour.
DISCUSSION
Since Hahn had observed the clearing phenomen of lipemic plasma after heparin administration, it was accepted by many investigators'"
11)'7) that a lipolytic or lipemia clearing enzyme appears in plasma soon after intravenous injection of heparin, though this enzyme was not yet shown in pure form.
Thereafter E . D. KORN'", J. I . KESSLER"', M. FINKEL, D. S. ROBINSON 30) , G. ANGERVALL, A. DURY31I and J. SLACKS'') have observed that the activity of lipoprotein lipase were in the heart, aorta, adipose tissue, pancreas and mammary gland.
D. S. ROBINSON and J. E. FRENCH") suggested about the relation between LPL in plasma and tissue that LPL occurs on the capillary surface and the role of heparin would be to displace and release this enzyme into the blood stream. Furthermore, D. S. ROBINSON and P. M.
HARRIS34)35 suggested that the vascular component having responsibility for the production of LPL might be distributed generally in the walls of vessels.