Fibrous Cartilage Formation in the Acetabular Fossa after Periacetabular
Osteotomy: Evaluation of the Related Factors and Clinical Outcomes
Satohiro ISHII, Koichi KINOSHITA, Tetsuro ISHIMATSU, Shunsuke AKIHO, Takuaki YAMAMOTO
Department of Orthopaedic Surgery, Faculty of Medicine, Fukuoka University
Abstract
Background: We performed second-look arthroscopy at approximately 1 year after periacetabular osteotomy
(PAO) to evaluate fibrous cartilage formation in the acetabular fossa, and to explore the related factors such as the hip morphological features associated with such fibrous cartilage formation.
Methods: We performed PAO combined with hip arthroscopy in 64 patients (63 women, 1 man; mean age,
38.3 years at the time of primary operation) who underwent second-look arthroscopy and were included in this study. Patients with a Perthes disease were excluded. Patients were divided into two groups based on the presence or absence of fibrous cartilage formation (formation group, 37 hips; non-formation group, 27 hips). The formation group and non-formation group were compared for age, body mass index (BMI), period between primary operation and second-look arthroscopy, Harris hip score (HHS), and radiographic parameters, including the lateral center-edge (CE) angle, acetabular roof obliquity (ARO), vertical-center-anterior (VCA) angle, and depth of the acetabular fossa (DAF).
Results: We found that patients in the formation group had superior postoperative HHS to patients in the non-formation group (P< 0.05). DAF was significantly higher in the non-formation group than in the formation group (P< 0.05). There was no significant difference between the two groups in terms of age (P= 0.40), BMI
(P= 0.45), lateral CE angle (P= 0.62), ARO (P= 0.35), or VCA angle (P= 0.26) at the time of primary PAO as well as at the time of second-look arthroscopy.
Conclusion: Patients who showed fibrous cartilage formation in the acetabular fossa had a better HHS than those without fibrous cartilage formation.
Key words: Second-look arthroscopy, Periacetabular osteotomy, Developmental dysplasia of the hip, Acetabular fossa, Fibrous cartilage formation
Introduction
Periacetabular osteotomy (PAO) is one of surgical treatment options for patients with symptomatic acetabular dysplasia 1-5). The survival rate for these patients at the 10
-year follow-up is reported to be about 84% to 90% with arthroplasty as the endpoint 6,7). PAO reportedly reduces
the stress on the hip caused by a significant increase in the weight-bearing surface of the hip joint 8-10). A previous study
of a rabbit model indicated that chondrocytes have been
activated in the early postoperative stage in response to load stress 11). Similarly, in humans, adjusting this weight
-bearing surface tends to result in fibrous cartilage formation in the acetabular fossa and they reported the fibrous cartilage formation is good sign to express the remodeling of the hip joint10). However, few reports have investigated
the acetabular fossa by hip arthroscopy at 1 year after PAO 9), and the incidence and potential pathological
consequences of this fibrous cartilage formation have never been examined. The present study aimed to evaluate fibrous cartilage formation in the acetabular fossa after
Correspondence to: Satohiro Ishii, Department of Orthopaedic Surgery, Faculty of Medicine, Fukuoka University 7-45-1 Nanakuma, Jonan-ku, Fukuoka, 810-0180, Japan
PAO, and to explore the potential factors for such fibrous cartilage formation.
Patients and Methods
This retrospective study was approved by our institutional review board (approval number: 16-1-08).
From September 2011 to September 2015, PAOs were performed at our institution in patients who presented with symptomatic acetabular dysplasia of the hips. We performed PAO combined with hip arthroscopy in 114 patients. Two patients with a Perthes disease were excluded. Sixty-four (56%) of 112 patients underwent second-look arthroscopy at a mean of 15 months (range, 11 to 27 months) after primary operation; these patients were included in this study. No patient had any other orthopedic disorders, such as skeletal dysplasia or neuromuscular disease.
Cartilaginous damage was assessed according to the modified Outerbridge classification system: grade 1, normal cartilage; grade 2, superficial fibrillation, softening, or both; grade 3, fragmentation and deep fissuring; and grade 4, erosion down to the subchondral bone12).
Nine of 64 patients underwent osteochondroplasty at the same time as PAO. Labral tears were not treated at the time of primary operation.
Data Collection
Preoperative, intraoperative, and postoperative findings were recorded. We also examined the clinical features, radiological and arthroscopic findings. Age, body mass index (BMI), the period between primary operation and second-look arthroscopy (days), and Harris hip score
(HHS) which is an indicator of clinical outcome, were assessed. Radiographic parameters, including the lateral center-edge (CE) angle, acetabular roof obliquity (ARO), and vertical-center-anterior (VCA) angle, were evaluated on anteroposterior pelvic radiographs. All pelvic computed tomography (CT) scans were performed 1 month before PAO. We used a 64-channel multidetector CT system
(Aquilion TSX-101A/HA; Toshiba Medical Systems Co.), and the scan protocol had a slice distance of 0.5 mm from the anterior superior iliac spines to below the knee. All images were digitally acquired using the picture archiving and communication system.
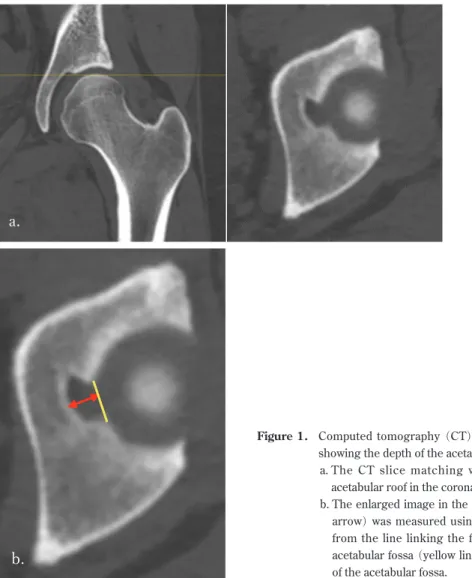
On CT scans, the depth of the acetabular fossa (DAF) was measured using the supine functional pelvic plane as a reference. First, we confirmed the acetabular roof
loaded part (sourcil) along the coronal plane. Second, we confirmed the CT slice of the inner margin of the sourcil along the axial plane. Third, we measured DAF using perpendicular lines from the line linking the front and back of the acetabular fossa to the deepest part of the acetabular fossa (Figure 1a, b).
We observed the acetabular fossa during second-look arthroscopy and performed palpation with a probe at second-look. Fibrous cartilage formation was assessed as present when (1) the tissue was a different color from that of the original acetabular cartilage;(2) the tissue had formed more than 2 mm from the acetabular fossa; and
(3) the tissue was softer than the acetabular cartilage by palpation with a probe.
All operations were performed by the same operator
(K.K.). Measurements of all radiographic parameters, and histogenetic evaluations of the acetabular fossa were performed by two investigators (S.I. and S.A.).
At the time of second-look arthroscopy, fibrous cartilage formation was observed in the acetabular fossa in patients in the formation group, whereas it was absent in patients in the acetabular fossa (non-formation group). This study was performed by dividing the patients into these two groups to evaluate the difference in the hip morphologic features.
Histopathology
Hematoxylin and eosin-stained image of tissue was obtained from the acetabular fossa during second-look arthroscopy. We collected the chondroid tissues from the first patient and the second patient among the patients of the formation group, and submitted to pathology.
Statistical Analysis
The unpaired t-test was used to compare two groups, with the significance level set at P < 0.05. Statistical analyses were performed using SPSS version 20.0 software
(IBM Corp.).
Source of Funding
No external funding was received for this study.
Results
The 64 patients comprised 63 women and 1 man, with a mean age of 38.3 years (range, 16 to 64 years) at the time of primary operation. The mean BMI at the time of primary operation was 22.1 ± 3.8 kg/m2(range, 15.6 to 34.1 kg/
Figure 1. Computed tomography (CT) scans of the left hip showing the depth of the acetabular fossa (DAF).
a. The CT slice matching with the step of the acetabular roof in the coronal plane.
b. The enlarged image in the axial plane. DAF (red arrow) was measured using perpendicular lines from the line linking the front and back of the acetabular fossa (yellow line) to the deepest part of the acetabular fossa.
Figure 2. Hematoxylin and eosin-stained image of tissue obtained from the acetabular fossa during second-look arthroscopy. The pathohistological diagnosis was fibrous cartilage. The normal portion of the tissue was hyaline cartilage, demarcated by a border (yellow dotted line).
The interobserver intraclass correlation coefficient
(ICC) were 0.948–0.962 for radiographic parameters. The intraobserver ICC were 0.942–0.957 for CT parameter. The coefficients for intra- and inter-observer correlations indicated good reliability.
At the time of the primary operation, cartilaginous damage was found on the acetabular side in 36 hips (grade 1, 18 hips; grade 2, 10 hips; grade 3, 8 hips; grade 4, 0 hips) and on the femoral side in 18 hips (grade 1, 13 hips; grade 2, 6 hips; grade 3, 4 hips; grade 4, 0 hips). Some patients showed the formation of chondroid tissue in the acetabular fossa. The histopathological examination revealed this to be fibrous cartilage (Figure 2).
At the time of second-look arthroscopy, fibrous cartilage formation was observed in 37 hips (formation group)
(Figure 3a, b) and absent in 27 hips (non-formation group)
(Figure 4a, b).
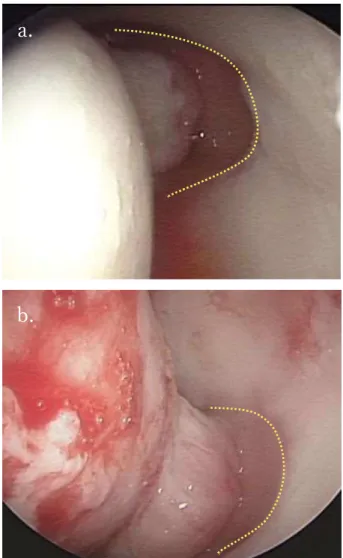
Figure 3. An example of a patient with fibrous cartilage formation after PAO (formation group). The acetabular fossa is within the dotted line.
a. Arthroscopic view of the acetabular fossa before PAO.
b. The acetabular fossa at the time of second-look arthroscopy. The yellow arrow indicates the fibrocartilage.
Figure 4. An example of a patient without fibrous cartilage after PAO (non-formation group). The acetabular fossa is within the dotted line.
a. Arthroscopic view of the acetabular fossa before PAO.
b. The acetabular fossa at the time of second-look arthroscopy (17 months after primary surgery).
superior postoperative HHS to those in the non-formation group (P< 0.05). The pain score for HHS was significantly better in the formation group than in the non-formation group (P< 0.05). DAF was significantly higher in non -formation group than in the -formation group (P< 0.05). There was no significant difference between the two groups in terms of age (P= 0.40), BMI (P= 0.45), lateral CE angle (P= 0.62), ARO (P= 0.35), or VCA angle (P = 0.26) during PAO and at the time of second-look arthroscopy
(Table 1).
Discussion
Joint remodeling is a biological reaction caused by a change in the balance of the joint mechanics in response to changes in intraarticular load stress 7,10,13). Treating
symptomatic acetabular dysplasia with PAO changes the distribution of the load stress on the acetabulum and medializes the femoral head. In turn, however, these biomechanical and anatomical changes can cause an increase in stress to the medial side of the acetabular roof 14,15).
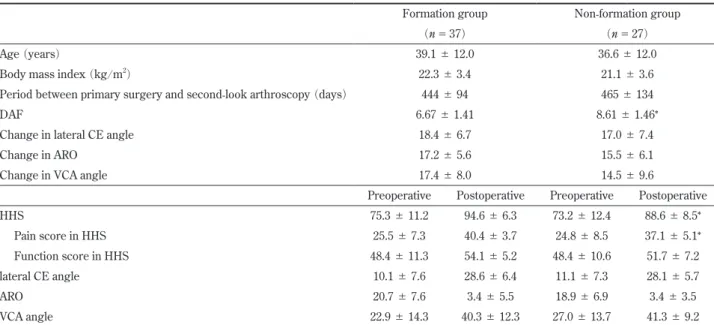
Table 1. Demographic Features, Pain, and Radiographic Parameters for the Formation and the Non-formation Groups
Formation group Non-formation group (n= 37) (n= 27)
Age (years) 39.1 ± 12.0 36.6 ± 12.0
Body mass index (kg/m2) 22.3 ± 3.4 21.1 ± 3.6
Period between primary surgery and second-look arthroscopy (days) 444 ± 94 465 ± 134
DAF 6.67 ± 1.41 8.61 ± 1.46*
Change in lateral CE angle 18.4 ± 6.7 17.0 ± 7.4
Change in ARO 17.2 ± 5.6 15.5 ± 6.1
Change in VCA angle 17.4 ± 8.0 14.5 ± 9.6
Preoperative Postoperative Preoperative Postoperative
HHS 75.3 ± 11.2 94.6 ± 6.3 73.2 ± 12.4 88.6 ± 8.5*
Pain score in HHS 25.5 ± 7.3 40.4 ± 3.7 24.8 ± 8.5 37.1 ± 5.1*
Function score in HHS 48.4±11.3 54.1±5.2 48.4±10.6 51.7±7.2
lateral CE angle 10.1 ± 7.6 28.6 ± 6.4 11.1 ± 7.3 28.1 ± 5.7
ARO 20.7 ± 7.6 3.4 ± 5.5 18.9 ± 6.9 3.4 ± 3.5
VCA angle 22.9 ± 14.3 40.3 ± 12.3 27.0 ± 13.7 41.3 ± 9.2
Formation group: PAO patients with fibrous cartilage formation at second-look arthroscopy, non-formation group: PAO patients with no fibrous cartilage formation at second-look arthroscopy.
HHS: Harris hip score, CE: center-edge, ARO: acetabular roof obliquity, VCA: vertical-center-anterior, DAF: depth of acetabular fossa. *indicates a significant difference between two groups.
In light of the findings of others, we hypothesized that redistribution of the load after PAO would encourage regeneration of the degenerative cartilage and cartilaginous metaplasia within the acetabular fossa 15). We found a
significant difference in post-HHS (particularly the pain score) and the DAF between the two groups, suggesting that cartilage regeneration may be associated with the shape of the acetabular fossa (particularly the depth) rather than the degree of developmental dysplasia of the hip. There was no significant difference between the groups in terms of age, BMI, period between primary operation and second-look arthroscopy, and other radiographic parameters. In the fibrous cartilage formation group, redistribution of the load was thought to be carried out in the region that includes the acetabular fossa. There is an individual difference in the shape of the acetabulum. Pun et al. clearly indicated that dysplastic hips are globally deficient in both cartilage and fossa dimensions on MRI and CT scans 16). We believe that patients with hip dysplasia
who also have a deep fossa may not see improvement in postoperative pain as quickly as others who have a shallower fossa. We acknowledge that there could be other factors contributing to our postoperative results after PAO. However, this result indicates that fibrous cartilage formation is a contributing factor to better postoperative results.
If indeed the degree of postoperative pain from PAO is influenced by fibrous cartilage of the acetabular fossa, surgeons may need to induce microfracturing in the lateral margin of the acetabular fossa in patients to promote fibrous cartilage formation 10).
The present study has several limitations. First, this study had a small sample size, with few participants in each group. However, this number of patients was sufficient to conduct a preliminary investigation, such as the present study and other former works 9,12). Second,
we performed pathological examinations only in some of the patients who were allocated to the formation group. This is due to the possibility that sampling of the fibrous cartilage may adversely affect the patients, and thus, we could not perform pathological examination in all patients. Third, we measured the DAF but were unable to measure the dimension of the acetabular fossa. Measuring this dimension would provide a better assessment of the outcome.
References
1) G a n z R , K l a u e K , V i n h T S , M a s t J W . A n e w periacetabular osteotomy for the treatment of hip dysplasias. Technique and preliminary results. Clin Orthop Relat Res. 232: 26-36, 1988.
2) Ninomiya S, Tagawa H. Rotational acetabular osteotomy for the dysplastic hip. J Bone Joint Surg Am. 66 (3): 430-6,1984.
3) Murphy SB, Millis MB, Hall J E. Surgical correction of acetabular dysplasia in the adult. A Boston experience. Clin Orthop Relat Res. 363: 38-44, 1999.
4) Naito M, Shiramizu K, Akiyoshi Y, Ezoe M, Nakamura Y. Curved periacetabular osteotomy for treatment of dysplastic hip. Clin Orthop Relat Res. 433: 129-35, 2005.
5) Gala L, Clohisy JC, Beaulé PE. Hip dysplasia in the young adult. J Bone Joint Surg Am. 98 (1): 63-73, 2016.
6) Steppacher SD, Tannast M, Ganz R, Siebenrock K A. Mean 20-year follow-up of Bernese periacetabular osteotomy. Clin Orthop Relat Res. 466 (7): 1633-44, 2008.
7) Matheney T, Kim Y J, Zurakowski D, Matero C. Intermediate to long-term results following the Bernese periacetabular osteotomy and predictors of clinical outcome. J Bone Joint Surg Am. 91 (9): 2113 -23, 2009.
8) Hsin J, Saluja R, Elert RE, Wiedel JD. Evaluation of the biomechanics of the hip following a triple osteotomy of the innominate bone. J Bone Joint Surg Am. 78 (6): 855-62, 1996.
9) Fujii M, Nakashima Y, Jingushi S, Yamamoto T, Noguchi Y, Suenaga E, Iwamoto Y. Intraarticular
findings in symptomatic developmental dysplasia of the hip. J Pediatr Orthop. 29 (1): 9-13, 2009.
10) Yamasaki T, Yasunaga Y, Terayama H, Hamaki T, Deie M, Ochi M. Multiple drillings of the acetabular fossa induce early joint remodeling after rotational acetabular osteotomy for hip dysplasia. Arch Orthop Trauma Surg. 128 (9): 909-13, 2008.
11) Shimogaki K, Yasunaga Y, Ochi M. A histological study of articular cartilage after rotational acetabular osteotomy for hip dysplasia. J Bone Joint Surg Br. 87
(7): 1019-23, 2005.
12) Outerbridge RE. The eiology of chondromalacia patellae. J Bone Joint Surg Br. 43-B: 752-7, 1961. 13) Yasunaga Y, Ochi M, Yamasaki T, Shoji T, Izumi S.
Rotational acetabular osteotomy for pre- and early osteoarthritis secondary to dysplasia provides durable results at 20 years. Clin Orthop Relat Res. 474 (10): 2145-53, 2016.
14) Yasunaga Y, Ikuta Y, Kanazawa T, Takahashi K, Hisatome T. The state of the articular cartilage at the time of surgery as an indication for rotational acetabular osteotomy. J Bone Joint Surg Br. 83 (7): 1001-4, 2001.
15) Teratani T, Naito M, Shiramizu K, Nakamura Y, Moriyama S. Modified pubic osteotomy for medialization of the femoral head in periacetabular osteotomy: a retrospective study of 144 hips. Acta Orthop. 79 (4): 474-82, 2008.
16) Pun SY, Hingsammer A, Millis MB, Kim YJ. Is increased acetabular cartilage or fossa size associated with pincer femoroacetabular impingement? Clin Orthop Relat Res. 475 (4): 1013-23, 2017.