2.6 GNSS
データ等を用いた津波波源の即時推定(2)
本項の論文は,富士技術出版株式会社からの転載許可を受けて掲載している。
(Tsushima, H. and Y. Ohta, 2014: Review on near-field tsunami forecasting from offshore tsunami data and onshre GNSS data for tsunami early warning, J. Disaster Res., 9, 339-357)
Review:
Review on Near-Field Tsunami Forecasting from Offshore Tsunami Data and Onshore GNSS Data for
Tsunami Early Warning
Hiroaki Tsushima∗and Yusaku Ohta∗∗
∗Meteorological Research Institute, Japan Meteorological Agency 1-1 Nagamine, Tsukuba, Ibaraki 305-0052, Japan
E-mail: [email protected]
∗∗Research Center for Prediction of Earthquakes and Volcanic Eruptions, Graduate School of Science, Tohoku University
6-6 Aoba Aramaki-Aza, Aoba-ku, Sendai 980-8578, Japan E-mail: [email protected]
[Received February 3, 2014; accepted April 10, 2014]
This paper reviews recent studies on methods of real- time forecasting for near-field tsunamis that use either offshore tsunami data or onshore global navigation satellite system (GNSS) data. Tsunami early warning systems for near-field coastal communities are vital be- cause evacuation time before tsunami arrival is usually very short. We focus on forecasting between the occur- rence of a tsunamigenic earthquake and the arrival of the first tsunami at a near-field coast – typically a few tens of minutes or less after the earthquake. Offshore tsunami measurement that provides coastal commu- nities with direct information on impending tsunamis is very effective in providing reliable tsunami predic- tions. Crustal deformation due to coseismic slips at an earthquake fault detected by real-time GNSS anal- ysis is quite useful in estimating fault expansion and the amount of slip, which in turn contributes to timely tsunami warnings, e.g., within 10 minutes, even for huge interplate earthquakes. Our review encompasses methods on the leading edge of research and those al- ready in the process of being applied practically. We also discuss an effective combination of methods de- veloped for mitigating tsunami disasters.
Keywords: offshore tsunami observation, real-time GNSS (GPS), near-field tsunamis, tsunami early warning system, combination use
1. Introduction
The huge major earthquake that struck northeastern Japan’s Pacific Ocean on March 11, 2011, was named the 2011 off the Pacific coast of Tohoku Earthquake by the Japan Meteorological Agency (JMA) (hereafter, 2011 Tohoku earthquake). The earthquake’s moment magni- tude (Mw) was 9.0, and it triggered a massive tsunami that devastated an 850 km swath of coastal Japan, took more than 15,880 lives, and set off a nuclear plant disaster in Fukushima.
The JMA first estimated the earthquake to be JMA magnitude (Katsumata, 2004 [1]) (Mjma) 7.9 based on rapid analysis of short-period seismic waves (Tatehata, 1997 [2]). Three minutes after the earthquake, the JMA issued the first tsunami warning for coastal Japan based on this estimated magnitude (Ozaki, 2011 [3]), e.g., a 3-6 m tsunami (larger in some locations) would affect coastal regions near to the tsunami source. An offshore Global Positioning System (GPS) buoy (Kato et al., 2000 [4]) deployed off northeastern Japan then recorded a steep rise in sea level and the JMA updated the tsunami warn- ing 28 minutes after the main shock (Ozaki, 2011 [3]) at heights upgraded to 6-10 m or more. The spilling wave of the tsunami, which was over 10 m in height, struck the most exposed coastal region∼30 minutes after the main shock. The first warning was clearly underestimated given the actual tsunami height because the estimated magni- tude of 7.9 was much smaller than the true magnitude of 9.0, i.e., the underestimation of the true scale led to an underestimation in the height of the resulting tsunami.
The update based on the GPS-buoy measurement demon- strates that tsunami height observed offshore is very ef- fective in rapid, reliable updating of tsunami warnings.
The 2011 Tohoku earthquake and its associated tsunami clearly reaffirm the need for an accurate tsunami early warning system, the importance of rapid reliable deter- mination of earthquake magnitude, and the reliability of tsunami prediction based on offshore tsunami observa- tion.
In this review, we focus on recent studies in methods for the real-time forecasting of near-field tsunamis using either offshore tsunami data or onshore global navigation satellite system (GNSS) data. The time window we dis- cuss is from when an earthquake and tsunami occur to when the tsunami arrives at the near-field coast – typi- cally 0 minutes to 30 minutes. We first review recent progress in real-time tsunami forecasting based on off- shore tsunami measurement and onshore GNSS data. We then briefly describe current efforts designed to improve
Fig. 1. Map of stations for offshore tsunami and onshore GNSS observations around the Japan Islands. (a) shows an overall view; (b) and (c) show enlarged views focusing on DONET and the Japan-Trench cable network, respectively.
the tsunami early warning system in Japan following the 2011 Tohoku earthquake. We also discuss recommenda- tions how existing multiple sensors could be used to im- prove the tsunami early warning system for dealing with large-scale events.
2. Real-Time Tsunami Forecasting Based on Offshore Tsunami Data
2.1. Offshore Tsunami Observation System
Observation of water waves plays an important role in tsunami forecasting because such observations may detect tsunamis. Directly measuring tsunamis provides reliable information aiding in tsunami forecasting, both for tsunamis generated by regular tsunamigenic earth- quakes and for those caused by tsunami earthquakes, i.e., earthquakes followed by tsunamis that are much larger than predictions based on seismic data analysis alone (Kanamori, 1972 [5]), and nonseismic events such as landslides (e.g., Miller, 1960 [6]). Specifically, off- shore tsunami observations are very effective in early tsunami forecasting because they provide measurement of a tsunami before its arrival at the near-field coast. In this section, we introduce offshore tsunami observation sys- tems and tsunami studies using offshore data, focusing on the Japanese case.
Over the last 30 years, dozens of offshore tsunami ob- servation systems have been deployed in deep-ocean ar- eas, i.e., water depth>1 km. One such deep-ocean sys- tem is the cabled ocean-bottom earthquake and tsunami
observation system (triangles inFig. 1). The system con- sists of ocean-bottom pressure gauges (OBPGs) for mon- itoring tsunamis. These OBPGs are pressure sensors that utilize quartz oscillators (e.g., Takahashi, 1981 [7]). The resonant frequencies of quartz crystals that are changed by an amount proportional to both pressure and temper- ature are measured. By applying temperature compen- sation that is valid under thermal equilibrium conditions, measured frequencies are converted to bottom pressure.
Then, under hydrostatic equilibrium conditions, pressure is converted to water depth or relative sea level. In 2013, eight cabled systems were installed off Japan (Meteo- rological Research Institute, 1980 [8]; Fujisawa et al., 1986 [9]; Kanazawa and Hasegawa, 1997 [10]; Momma et al., 1997 [11]; Eguchi et al., 1998 [12]; Hirata et al., 2002 [13]; Saito, 2007 [14]; Kaneda et al., 2009 [15]).
The northeastern cable system is no longer operational, however, because its land-based station was destroyed by the 2011 Tohoku earthquake tsunami, i.e., the two OBPG stations shown by black triangles in Fig. 1. These sys- tems are operated by the JMA, University of Tokyo, Na- tional Research Institute for Earth Science and Disaster Prevention (NIED), and Japan Agency for Marine-Earth Science and Technology (JAMSTEC). Each cable sys- tem consists of 2-3 OBPGs (Fig. 1(a)), except for the Dense Oceanfloor Network System for Earthquakes and Tsunamis (DONET, now called DONET1), which has 20 (Kaneda et al., 2009 [15]) (Fig. 1(b)). Observed pres- sure data sampled at a frequency greater than 1 Hz are transmitted in real time to land-based stations through submarine cables. These Japanese cabled observatories are deployed on landward slopes of trenches where sub-
duction earthquakes often occur (Fig. 1), so they measure pressure variations caused both by propagating tsunamis and by deformation of the permanent seafloor just below OBPG locations, such as the 2003 Tokachi-Oki earth- quake (Mw8.3) (Mikada et al., 2006 [16]; Tsushima et al., 2012a [17]) and the 2011 Tohoku earthquake (Mw9.0) (e.g., Maeda et al., 2011 [18]; Tsushima et al., 2011 [19]).
Seafloor deformation indicates the height of tsunamis generated at OBPG locations, so it also provides impor- tant geodetic data on target tsunamis (Ito et al., 2011 [20];
Saito et al., 2011 [21]; Tsushima et al., 2011 [18]). An- other system in use is the Deep-ocean Assessment and Re- porting of Tsunamis (DART) (Gonz´alez et al., 2005 [22]), which is a worldwide network of offshore tsunami ob- servatories developed by the Pacific Marine Environmen- tal Laboratory (PMEL) of the National Oceanic Atmo- spheric Administration (NOAA) (Titov et al., 2005 [23]).
DARTs around Japan are shown by purple diamonds in Fig. 1(a). DART also consists of OBPGs for measur- ing offshore tsunamis, as well as the Japanese cabled sys- tem, but data transmission differs from that in cabled sys- tems, i.e., observed data are transmitted to data centers via moored buoys and communication satellites (Gonz´alez et al., 2005 [22]). Currently, more than 45 DARTs have been deployed worldwide by NOAA and other countries, and the data they record are made available via the Internet by the National Data Buoy Center1. DART has two re- porting modes – standard mode and event mode (Meinig et al., 2005 [24]). In standard mode, the sampling rate of transmitted data is 15 minutes to observe oceanic tides.
Once an automatic tsunami-detection algorithm (Mofjeld, 1997 [25]) is triggered, reporting mode switches to event mode. The typical sampling rate during event mode is one minute, which is constrained mainly by the satellite com- munications baud rate. DART stations are deployed out- side regions of potential permanent seafloor deformation due to subduction earthquakes (Spillane et al., 2008 [26]) (Fig. 1(a)).
Many tsunamis generated by moderate to great earth- quakes have been detected by cabled and DART OBPGs, even though amplitudes of tsunamis at station sites may have been only a few centimeters or less (Hino et al., 2001 [27]; Hirata et al., 2003 [28]; Titov et al., 2005 [23]).
The tsunami waveform observed at an OBPG is sim- pler than that observed at a coastal tide-gauge station and provides a tsunami source signature free of distor- tion due to complex coastal topography (e.g., Gonz´alez et al., 1991 [29]). Since 2000, much tsunami data has been used to investigate earthquake source parameters by comparison with results of numerical tsunami simulation.
Hino et al. (2001) [27] and Hirata et al. (2003) [28]
analyzed cabled-OBPG tsunami waveforms fromMw6-7 earthquakes and demonstrated that using offshore data is effective in constraining source-fault parameters. Other studies have used inversion analysis of OBPG data to es- timate tsunami sources, i.e., coseismic fault slips, and/or initial sea-surface distribution of tsunami events such as
1. http://www.ndbc.noaa.gov/dart.shtml
the 2003 Tokachi-Oki earthquake (Mw8.3) (Tanioka et al., 2004 [30]), the 2006 and 2007 Kuril earthquakes (Mw8.3 andMw8.1), (Fujii and Satake, 2008 [31]), the 2010 Chile earthquake (Mw8.8) (Fujii and Satake, 2013 [32]), and the 2011 Tohoku earthquake (Mw9.0) (discussed later).
GPS-buoy systems also observe offshore tsunamis (Kato et al., 2000 [4]) (blue reverse triangles inFig. 1).
In such systems, a moored buoy with a GPS antenna de- tects the arrival of tsunamis as a change in wave height using real-time kinematic baseline GPS (or GNSS). GPS buoys are operated by the Ministry of Land, Infrastruc- ture, Transport and Tourism and the Port and Airport Re- search Institute as wave stations that are part of the Na- tionwide Ocean Wave information network for Ports and HArborS (NOWPHAS) (Nagai, 1998 [33]). Sea-level ob- servations at a sampling interval of one second (Kawai et al., 2010 [34]) are transmitted in real time by radio waves to land stations. These systems are deployed off- shore within 20 km of the coastline (Fig. 1), which is constrained mainly by radio wave broadcast limits. Wa- ter at deployment sites is shallower (100-400 m) than for deep-ocean OBPGs. A tsunami generated by the 2004 Kii-Peninsula earthquake (Mw7.4) was detected at a GPS buoy deployed off Muroto about eight minutes earlier than at the nearby coast (Kato et al., 2005 [35]). The GPS- buoy event data were used together with the cabled-OBPG data in the tsunami-source inversion studies by Baba et al. (2005) [36], Satake et al. (2005) [37], and Saito et al. (2010) [38]. Later, many GPS buoys were installed off Japan’s coast. The large tsunami generated by the 2010 Chilean earthquake (Mw8.8) was the first such event detected by the GPS-buoy array (11 buoys) (Kawai et al., 2010 [34]). Offshore wave stations of NOWPHAS, which were operating before GPS-buoy deployment, are within several kilometers of the coast and have recorded many tsunamis (e.g., Takayama et al., 1994 [39]) (green squares inFig. 1). These stations also detect tsunamis be- fore their arrival at nearby coasts (e.g., Nagai and Ogawa, 2004 [40]).
These various offshore stations clearly detected the huge tsunami generated by the 2011 Tohoku earthquake (Mw9.0). Specifically, at near-field stations such as ca- bled OBPG and GPS-buoy stations, the tsunami was de- tected 5-10 minutes before it reached coastal tide-gauge stations nearest to the tsunami source (Tsushima et al., 2011 [19]). The tsunami waveforms thus obtained show remarkable characteristics (e.g., Maeda et al., 2011 [18];
Tsushima et al., 2011 [19]; Kawai et al., 2011 [41]), i.e., an initial gradual sea-level increase followed by an impul- sive tsunami, i.e., a large-amplitude short-period tsunami, for which total sea-level elevation was 5 m or more.
Such offshore data reflecting a significant source signa- ture have been used by many source-estimation studies in back-propagation analysis for detecting the source ex- tent (Hayashi et al., 2011a [42]), trial-and-error forward tsunami modeling for obtaining slip distribution (Maeda et al., 2011 [18]), and tsunami inversion for determin- ing the final distribution of coseismic fault slips (Fujii et al., 2011 [43]; Gusman et al., 2012 [44]) and initial
sea-surface displacement (Saito et al., 2011 [21]). These studies obtained a source image that having two ma- jor features – a huge-extent source that should generate long-period tsunamis and a small-extent, largely elevated source east of the epicenter near the trench that should produce an impulsive tsunami. By exploiting high-quality high-sampling-rate (HSR) tsunami data (< 1 minute) within or near the source, multiple time windows were inverted to determine the spatiotemporal evolution of the coseismic fault rupture (Satake et al., 2013 [45]) and initial sea-surface displacement (Takagawa and Tomita, 2012a [46], 2012b [47]). Results demonstrated that the generation of the delayed rupture or sea-surface displace- ment occurred in the near-trench area north of the epi- center. Note that Takagawa and Tomita (2012b) [47]
modified a tsunami-inversion scheme in which coseismic permanent deformation was estimated from tsunami data both at observing points and at different points, for exam- ple, using GPS-buoy data, so that the coseismic step at a nearby land station of each GPS buoy could be obtained.
Coseismic vertical deformation at the land station appears as an apparent sea-level variation in GPS-buoy data, i.e., a baseline shift in a sea-level time series, producing a source-image artifact. They demonstrated the effective- ness of their scheme for reducing source artifacts and the applicability to real-time inversion for tsunami forecast- ing.
As mentioned, various tsunami sizes have been mea- sured by offshore tsunami stations, and several examples exist in which offshore sensors have detected tsunamis be- fore they reached the coast. Another benefit is that ob- tained tsunami data provided substantial information on impending tsunamis. In the next section, we review stud- ies on near-field tsunami forecasting based on these off- shore tsunami data.
2.2. Real-Time Tsunami Forecasting Based on Off- shore Tsunami Data
Various methods have been proposed for using offshore tsunami data to forecast near-field tsunamis. In the calcu- lation of tsunami behavior near to and on land, i.e., in- undation, nonlinear effects such as bottom friction should be taken into account, but calculation is costly and takes time even though rapid forecasting is important, espe- cially with near-field tsunamis. To reduce calculation time, several studies have used linear assumption for fore- casting calculation. Under linear assumption, a predicted tsunami waveform is expressed by a linear superposition of pre-calculated tsunami waveforms, i.e., Green’s func- tions. Other studies have calculated nonlinear tsunami behavior quickly using high-performance systems effec- tively. Here, we review these methods and their retrospec- tive applications to the 2011 Tohoku earthquake, focusing mainly on those of Japanese research groups.
Several studies have proposed tsunami forecasting based on source estimation using offshore tsunami data exploiting the abundant source information such data con- tain. PMEL developed Short-term Inundation Forecast
for Tsunamis (SIFT), based on DART data inversion, for modeling coseismic fault-slips to forecast inundation in real time for coastal sites (Titov et al., 2005 [23]). Pre- ceding an earthquake, they calculate tsunami propaga- tion using pre-defined subfaults at shallow parts of world- wide subduction zones using the “Method Of Splitting Tsunami” (MOST) numerical model (Titov and Gonz´alez, 1997 [48]). This generates a propagation database storing time series information on water height and flow velocity (Gica et al., 2008 [49]). After an earthquake, DART mea- surement is inverted to determine slip distribution on pre- defined subfaults using Green’s function extracted from the database. Once the source is obtained, the linear com- bination of the pre-calculated time series of water heights and velocities from subfaults is applied. Results are then used as dynamic boundary conditions for real-time non- linear calculation to forecast inundation at coastal sites of interest. The inundation model is optimized so that several hours of inundation modeling are done in min- utes on a single processor (Tang et al., 2008 [50]). SIFT has been applied to many tsunami events (e.g., Tang et al., 2008 [50]; Wei et al., 2008 [51]). The 2011 Tohoku earthquake (Mw9.0) was the first event for which near- field data were recorded by multiple DART systems with good station coverage (Tang et al., 2012 [52]). Tang et al.
(2012) [52] showed that the SIFT algorithm identified a 300-400 km long 100 km wide source area from the first tsunami waves recorded at the two closest DARTs within 1.5 hours of the main shock. The source model was used to investigate the tsunami impact on near-field Japanese coasts by Wei et al. (2013) [53], and it agreed very well with post-tsunami survey data (Mori et al., 2011 [54]), modeling the run-up height, spatial pattern, and extent of inundation with an accuracy of 85.5%. PMEL recently added subfaults to the outer-trench region and tested it with the 2012 Japanese tsunami event (Bernard et al., 2013 [55]).
In contrast to PMEL’s approach, several other studies inverted offshore tsunami data to determine the distribu- tion of initial sea-surface displacement to forecast coastal tsunamis. This approach is advantageous in forecasting tsunamis both due to interplate earthquakes and due to other types of tsunami events, such as splay faulting (e.g., Fukao, 1979 [56]), the geometry of which is difficult to es- timate in real time. Since 2000, several researchers have devoted their efforts to developing such a method.
Tsushima et al. (2007 [57], 2009 [58]) proposed a tsunami-forecasting algorithm called “tsunami Forecast- ing based on Inversion for initial sea-Surface Height”
(tFISH) that inverted cabled-OBPG tsunami waveform data to determine initial sea-surface displacement dis- tribution (seafloor deformation in Tsushima et al., 2007 [57]) and then synthesized tsunami waveforms at near-field coastal sites by linearly combining pre- calculated Green’s functions. In tFISH analysis, the ori- gin time and epicenter location of an earthquake based on seismic-wave analysis are used but not requiring infor- mation about earthquake magnitude and fault geometry.
In addition to the spatial smoothness constraint, the epi-
center location is incorporated as a damping constraint to stabilize the solution of the inversion. Successive calcu- lation of forecasting is done within a few minutes. To improve forecasting reliability, OBPG data are updated at short time intervals to repeat forecast calculation. To calculate Green’s functions from unitary displacement of small sea-surface segments, they calculated finite differ- ence approximation of linear long-wave equations (Sa- take, 1995 [59]) to construct a Green’s function database.
Tsushima et al. (2007 [57], 2009 [58]) tested the algo- rithm in its application to “observations” simulated nu- merically from the source model of the 1896 Sanriku tsunami earthquake (Tanioka and Satake, 1996 [60]). Re- sults showed that the tFISH algorithm provides accurate coastal predictions of arrival times and amplitudes of the first tsunamis, obtaining these more than 20 minutes be- fore the first wave reached its maximum at the coastal site nearest to the source. They retrospectively applied it to real data from a small tsunami generated by a local earth- quake (Mw6.8) and forecast the tsunami at coastal tide- gauge stations. Tsushima et al. (2009) [58] showed that forecasting accuracy was affected by spatial relationships between the tsunami source and offshore observation sta- tions. They suggested a possible solution, i.e., deploy- ing additional offshore stations with spacing comparable to the trench-parallel length of the target tsunami source.
Tsushima et al. (2012a) [17] improved their Green’s func- tion so that the tFISH algorithm was applicable to data from an OBPG inside the source area. OBPG records at the source contain pressure variation due to deformation of the permanent seafloor, which is geodetic data impor- tant for constraining a source effectively. They applied the tFISH algorithm with improved Green’s functions to real data obtained by four OBPGs during the 2003Mw8.3 Tokachi-Oki earthquake, two of which were within the source area, thus demonstrating its good performance in both source estimation and near-field tsunami forecasting.
Yasuda et al. (2007) [61] and Yasuda and Mase (2013) [62] developed a method of near-field tsunami forecasting based on the inversion of offshore GPS-buoy data. They considered source areas of Nankai Trough earthquakes, such as the huge earthquake that simultane- ously ruptures all the source areas of the Tokai, Tonankai, and Nankai earthquakes (Central Disaster Management Council., 2003 [63]) to perform numerical tsunami fore- casting experiments. Results demonstrated preferable performance in forecasting tsunami waveforms at nearby coastal sites and the effectiveness of additional GPS buoys for rapid forecasting. Tatsumi and Tomita (2008) [64] in- corporated information on epicenter location into the in- version of GPS-buoy data. Its effectiveness in improv- ing source estimation and tsunami forecasting was shown in its application to observation data simulated from his- torical Nankai Trough earthquakes. To forecast real-time inundation, Tatsumi and Tomita (2009) [65] newly com- bined source inversion, estimation of the volume of water overflowing into coastal sites, and the level-fill method.
Tatsumi and Tomita (2013) [66] also developed other real- time inundation forecasting by jointly applying their in-
version scheme and nonlinear tsunami inundation calcu- lation accelerated by graphics processing unit comput- ing. Numerical simulation results based on the 1946M8.0 Nankai earthquake showed that the method provided reli- able estimates of inundation within five minutes of first- peak tsunami amplitudes being observed at offshore sta- tions near the coast of interest.
These forecasting methods based on inversion for ini- tial sea-surface displacement have been applied retrospec- tively to the 2011Mw9.0 Tohoku earthquake. Tsushima et al. (2011) [19] used offshore tsunami data from four cabled-OBPGs and five GPS-buoy stations off northeast- ern Japan for applying the tFISH algorithm. Results of forecasting, done 20 minutes after earthquake occurrence, demonstrated with a lead time of more than 5 minutes that tsunamis with heights greater than 5-10 m were predicted at tide-gauge stations nearest to the source. Yasuda et al.
(2012) [67] performed detailed analyses by varying com- binations of GPS buoys used in inversion and comparing predicted tsunami waveforms and inundation height data measured by the Tsunami Joint Survey Group (Mori et al., 2011 [54]). They obtained several important find- ings, e.g., tsunami prediction based on data from three GPS buoys with nonbiased station density were more ac- curate than from five buoys with biased density. Tatsumi and Tomita (2013) [66] forecast real-time inundation ret- rospectively and demonstrated that their method provided predictions of arrival time, height, and inundation with
∼50% error about five minutes before the first tsunami reached its maximum height at the site. Their inunda- tion modeling is incorporated in real-time tsunami haz- ard mapping developed by Takagawa et al. (2013) [68], improving speed and enhancing accuracy. The system also incorporates tsunami inversion with spatiotemporal rupture effects (Takagawa and Tomita, 2012b [47]) and thus provided inundation mapping soon after acquisition of offshore tsunami measurements. Time for successive calculation was about two minutes.
Another useful approach to forecasting coastal tsunami height in real time is the law of tsunami amplification.
The height of a tsunami is amplified during its propaga- tion from offshore to the coast because water depth is re- duced. This effect is based on the energy-conservation law, known as Green’s law (Green, 1837 [69]). If an ac- curate amplification factor can be prepared in advance, its real-time application to tsunami height observed off- shore could immediately provide its predicted height at a coastal point of interest. Several studies have investigated the tsunami-amplification factor using past tsunami data and/or numerical tsunami simulation. To estimate max- imum tsunami height at a coastal tide gauge using data from offshore OBPGs, Baba et al. (2004) [70] modified Green’s law by assuming that tsunami wave height is dou- bled by reflection at a coastline, i.e., total reflection. Note that water depth at a coastal station was assumed implic- itly to be 1 m. The proposal showed good performance in far-field tsunami events but could not be verified for near-field events because there were no appropriate data at that time. Takayama (2008) [71] extended amplification
factors of Baba et al. (2004) [70] by taking into account water depth at the coastal station and then discussed the effects of other parameters such as epicenter distance on amplification factors. His statistical analysis showed that corrections related to offshore tsunami amplitude and/or epicenter distance improve the performance of amplifi- cation factors, depending on how the offshore OBPG and coastal tide gauge are paired. Hayashi (2010a) [72]
derived amplification factors for first-wave height and maximum-wave amplitude between NOWPHAS stations, i.e., offshore wave gauges and GPS buoys, and coastal tide gauges using both near-field and far-field tsunami measurement. In addition to water depth at a coastal site, he empirically incorporated the effects of a tsunami wave reflected from the coastline, both on coastal tsunami height and on offshore tsunami height. This is because offshore stations in NOWPHAS are located<20 km from the coastline and a reflection wave might return to an offshore station before the first-wave height reached its peak there. Prediction error using his method is within 30% of observations. Hayashi (2010b) [73] proposed us- ing amplification factors practically in a tsunami warn- ing system. Baba et al. (2013) [74] conducted Monte Carlo tsunami simulation to investigate the empirical re- lationship between DONET pressure measurements and coastal tsunami height for near-field tsunamigenic earth- quakes. More than 3,400 fault models were assumed and resulting tsunami propagation was calculated by paral- lelized tsunami simulation code, called “JAMSTEC im- proved former code developed by Geoscience Australia and URS Corporation (Jakeman et al., 2010 [75]) which uses Satake (2002) [76]’s kernel” (JAGURS) (Baba et al., 2014 [77]). By analyzing simulation results, they devel- oped an amplification-factor in which the average wave- form of the absolute value of hydrostatic pressure change at all DONET stations is used as offshore data for pre- dicting coastal tsunami height. Because DONET stations are deployed where the sea is deep, the obtained tsunami- amplification factor and DONET data enable rapid predic- tion of coastal tsunami height. The accuracy of estimation is comparable to that using GPS-buoy data acquired near the coast.
In addition to these developments, an approach was de- signed using a pre-calculated tsunami-scenario database.
Abe and Imamura (2010) [78] proposed a strategy for real-time inundation forecasting of near-field tsunamis in which numerous tsunami-inundation scenarios were cal- culated before earthquakes occurred. Then, following an earthquake, the number of possible scenarios was nar- rowed down from pre-calculated inundation scenarios by referring to information available in real time, such as seismic source parameters and tsunami height observa- tion. This reduced real-time calculation time. To evaluate its performance, Abe and Imamura (2012) [79] applied the method retrospectively to the 2011 Tohoku earth- quake. Results indicated that prediction for Sendai agreed with observed inundation, but that for Ishinomaki was an underestimation. That could be mitigated by adding inun- dation scenarios ofM8.6-9.0 earthquakes to the database
(original: M<8.4) and using GPS-buoy data nearest the city. Estimated lead times for these two cities would be 25-30 minutes.
Seto et al. (2013) [80] proposed an effective, conve- nient procedure for evaluating and helping prevent under- estimations in tsunami warnings using offshore GPS-buoy measurement. Their evaluation model is a simple equa- tion expressing the relationship between moment magni- tude and initial or maximum tsunami height measured by a GPS buoy. Preceding an earthquake, evaluation equa- tions are derived using results of numerical tsunami simu- lation for various fault models. Following an earthquake, the first evaluation is made by comparing initial tsunami heights from GPS-buoy measurement and those estimated by their model. Heights predicted by the model are ob- tained by applying the rapid magnitude used for the previ- ously issued tsunami warning to their equations. A second evaluation is based on maximum tsunami height measured at GPS buoys in the same way. These convenient evalua- tions are very easy and done in real time.
As shown, significant efforts have been made to im- prove tsunami forecasting based on offshore data. Given the effectiveness of offshore tsunami data, such improve- ments should be continued in the future.
3. Real-Time Tsunami Forecasting Based on Onshore GNSS Data
3.1. High-Rate GNSS Data Processing for Seismol- ogy
Recently, HSR (typically used 1-Hz-sampled) GNSS data have been used to create GNSS seismograms. GNSS data directly measure ground displacement, unlike broad- band seismometers that measure velocity or accelera- tion, and they must be mathematically integrated once or twice to obtain displacement data that may, however, be potentially degraded by iteration (e.g., Miyazaki et al., 2004 [81]). HSR GNSS data are a basic technology for real-time tsunami forecasting based on onshore GNSS data, so we briefly introduce studies on HSR GNSS data processing and its applications below.
Conventionally, GNSS data – usually GPS – were used to estimate “daily” coordinates to determine the seismo- logical nature of crustal deformation in seismological and geodesic applications. The difference between coordi- nates from the day before and the day after an earth- quake, for example, is strongly indicative of coseismic displacement. Similarly, steady and slow displacement trends caused by plate motion and subduction are impor- tant information for estimating strain accumulation be- fore an earthquake. In this context, most GNSS data processing software packages used for scientific purposes estimate these daily coordinates precisely, e.g., Bernese GNSS software (Dach et al., 2007 [82]), GIPSY-OASIS II (Lichten and Border, 1987 [83]), and GAMIT/GLOBK (Herring et al., 2006 [84]). For the estimation of the daily coordinates, the unknown parameters are limited. Bernese
GNSS software, for example, thus applies standard least squares adjustment when estimating unknown parameters with a priori information. The standard least squares method is typical and robust in estimating daily GNSS coordinates. Least squares estimation is, however, clearly unsuitable for more frequent coordinate estimation, i.e., with a one-second sampling interval, because of the large number of unknown parameters to be solved at any one time. In this situation, processing time will be longer than realistic calculation time. Standard least square estima- tion is also unsuitable for real-time processing because of all of the epochs necessary for each calculation. Kalman- filter-based (KF) processing, in contrast, is useful for es- timating such unknown time-dependent parameters. The KF forms the basis of most state estimation algorithms used in navigation systems and uses all of the measure- ment information available instead of just the most recent set of measurements (Groves, 2013 [85]). Many examples of precise positioning software use the KF approach, e.g., GIPSY-OASIS II and RTKLIB (Takasu, 2010 [86]).
The potential of HSR GPS data for use in seismol- ogy was first discussed by Hirahara et al. (1994) [87], Miyazaki et al. (1998) [88], Ge (1999) [89], and Ge et al. (2000) [90], who focused on very short base- lines for detecting large displacement based on short- time-interval analysis. Based on these studies, Larson et al. (2003) [91] found good agreement between ground displacement integrated from records of strong seismic motion and long baseline 1-Hz-sampled GPS position estimates collected several hundred kilometers from the 2002 Denali earthquake epicenter and based on GIPSY- OASIS II processing. Bock et al. (2004) [92] also de- tected a large surface wave caused by the Denali earth- quake using the dense network of 1-Hz GPS stations of the Southern California integrated GPS network (Hudnut and Nancy, 2001 [93]). In their analysis, displacements were derived using independent 1 Hz instantaneous po- sitioning proposed by Bock et al. (2000) [94]. Ohta et al. (2006) [95] analyzed kinematic GPS records of the 2004 Sumatra-Andaman earthquake using very long baselines of over several thousand kilometers and demon- strated good agreement between GPS time series and in- tegrated broadband seismic displacement records. Ohta et al. (2008) [96] extracted “pure” coseismic displace- ments for the 2008 Iwate-Miyagi inland earthquake de- duced from kinematic precise point positioning (PPP).
Bilich et al. (2008) [97] showed GPS seismology capa- bilities specifically with regard to the relative strengths of GPS and seismic datasets based on the 2002 Denali earthquake. Most of these previous studies estimated co- ordinate values relative to the reference site(s) and re- quired precise information on GPS satellite orbits. Some efforts have been directed, however, toward estimating only short-term variations in GPS stations with no other reference sites. Issiki et al. (2000) [98], for example, proposed point-precise variance detection (PVD) to es- timate only short-term variations at GPS stations based on multiple GPS satellite carrier-phase data and GPS al- manac data with a stand-alone dual-frequency GPS re-
ceiver. They suggested that because PVD only requires small calculational loads, it would allow quasi real-time rapid measurement of components with high-frequency variations. Colosimo et al. (2011) [99] presented a sim- ilar approach using what they called the variometric ap- proach for displacement analysis stand-alone engine. This approach estimated the time series of three-dimensional
“velocity” and integrated the estimated velocity into “dis- placement” over the interval. Biases in estimated veloci- ties accumulating over time, however, appeared as drift in estimated time series, thus limiting the integration inter- val to a few minutes (Branzanti et al., 2013 [100]). Li et al. (2013) [101] proposed capturing coseismic displace- ments quickly in real time using a single GNSS receiver, assuming that if the receiver position before an earthquake was determined accurately enough, phase ambiguity be- tween GNSS stations and satellites could be fixed in sub- sequent epochs. They indicated that this assumption could overcome the convergence problem of kinematic PPP and avoid the integration of the variometric approach (e.g., Colosimo et al., 2011 [99]). These many efforts mainly described the detection of displacement caused by coseis- mic and passage of seismic waves such as surface waves.
HSR GPS time series are also useful for modeling seismic ruptures on fault planes. Several studies investigated the rupture process of large earthquakes (e.g., Miyazaki et al.
(2004) [81]; Yokota et al., (2009) [102]) based on HSR GPS time series. The advantage of HSR GPS time series is the sensitivity of cumulative slip distribution compared to that of a seismometer.
Larson (2009) [103] reviewed “GPS seismology” and suggested that the future of GPS seismology should fo- cus on using GPS as a strong-motion instrument. Strong- motion seismometers measure acceleration, whereas GPS seismology contributes to accurately estimating displace- ment. The seismometer is band-limited because it is an in- ertial system consisting of a spring and weight. The GPS (GNSS) seismometer is also inertial between the earth and GNSS satellites, but the system is larger than the seis- mometer and, in principle, has no band limit.
Based on developments in GPS (GNSS) seismology, several researchers have attempted to use real-time GNSS analysis results in earthquake and tsunami warning sys- tems. In the section that follows, we review the role of real-time GPS (GNSS) seismology in tsunami disaster mitigation.
3.2. Rapid Earthquake-Size Determination and Tsunami Forecasting Based on GNSS Data Following the 2004 Sumatra-Andaman earthquake, Blewitt et al. (2006) [104] proposed that true earthquake magnitude and tsunamigenic potential could be obtained from inland GPS data within a short period – less than 15 minutes – of the main shock. In September 2007, a workshop entitled “Real-Time GPS Science Require- ments” was held in Leavenworth, Washington, USA, at which many geodesy and seismology scientists and engi- neers, including one of this paper’s authors, worked to-
gether to determine the requirements of a GPS network for disaster prevention. Based on workshop discussions, Blewitt et al. (2009) [105] identified a potentially impor- tant design for a GNSS or GPS system that could con- tribute to real-time earthquake source determination and tsunami warning. They suggested that 10 mm real-time full GNSS – that is, not limited to GPS – displacement ac- curacy is required to prevent false tsunami warnings. Sim- ilarly, Sobolev et al. (2007) [106] proposed a GPS shield concept that used special near-field GPS arrays to reliably predict tsunami wave heights. Based on numerical exper- iments of earthquake and tsunami scenario for Padang, Sumatra, they suggested that a GPS shield measuring both horizontal and vertical displacements could resolve higher order features of slip distribution on the plate inter- face. Based on numerical experiments, they showed that tsunami waves could be predicted reliably and issued in less than 10 minutes of an earthquake’s occurrence. Song (2007) [107] proposed a unique approach in which he es- timated seafloor displacement that was projected or ex- trapolated from near-field GPS measurements. Seafloor displacement along the cross-shelf section were modeled using an empirical trench profile. Once seafloor displace- ment was estimated, initial tsunami height and propaga- tion could be calculated immediately. He replicated three historical tsunamis – the 2004 Sumatra-Andaman earth- quake, the 1964 Alaska earthquake, and the 2005 Nias earthquake – based on real and/or simulated GPS data and succeeded in reproducing coastal tsunami heights recorded by tide gauges. He also indicated that these steps were achievable within a few minutes of the trig- ger event. The Geospatial Information Authority of Japan (GSI) developed a rapid earthquake fault model estima- tion algorithm and Nishimura et al. (2010) [108] a corre- sponding procedure using real-time 1 Hz GPS data. They tried estimating rectangular fault model using multiple ap- proaches. In one, they assumed a focal mechanism – fault strike, dip, and rake angle – for each pre-defined rectan- gular area determined experimentally based on previous large earthquakes. Based on this focal mechanism, they estimated a single coseismic fault model using inversion analysis witha prioriinformation.
The Mw9.0 2011 Tohoku earthquake occurred after these pioneering efforts. As mentioned in the introduc- tion, the JMA tsunami warning system clearly underesti- mated actual tsunami height. Effort to rapidly determine earthquake size based on real-time GNSS data progressed following the 2011 Tohoku earthquake. Allen and Ziv (2011) [109] extracted static offset shortly after S-wave arrival was detected using a simple algorithm based on the short-term average (STA) versus the long-term aver- age (LTA) trigger algorithm (Allen, 1978 [110]). Melgar et al. (2012) [111] proposed and called fastCMT to de- termine the moment tensor and centroid location for large earthquakes based on real-time high-rate GPS data. They applied their algorithm to two large earthquakes replayed in simulated real-time mode: the 2003 Mw8.3 Tokachi- Oki and the 2010Mw7.2 El Mayor-Cucapah earthquakes.
They demonstrated that an accurate centroid moment ten-
sor (CMT) solution could be obtained within two to three minutes after rupture initiation without any need for a prioriinformation. The fastCMT algorithm uses a pre- defined arbitrary grid to invert the CMT solution, so the earthquake location is limited in CMT inversion both on the subducting plate interface, and at other locations, such as intraslab, outer rise, and inland earthquakes. This is a great advantage in actual monitoring because large earth- quakes occur in areas other than on the subducting plate interface. The fastCMT algorithm assumes a point source, which is reasonable in a situation where an inland GNSS site is located far enough from the centroid. For larger magnitude events, this clearly increases because the fault plane also expands with increasing magnitude. For re- liable, accurate early tsunami warnings, information on both finite fault size and slip amount is important.
Ohta et al. (2012) [112] developed an algorithm to detect/estimate static ground displacement due to earth- quake faulting from real-time kinematic GPS (RTK-GPS) time series, called the RAPiD algorithm. This algorithm has three main steps to the algorithm. The first is dis- placement detection, where the value from the STA and LTA based on 1 Hz RTK-GPS data is calculated. When this value is larger than a previously defined threshold, the algorithm registers static displacement occurrence. In the second step, once an occurrence is registered, the amount of displacement is estimated. Finally, this esti- mated displacement is used to create a fault model of one rectangular plane with homogeneous slip. To assess its performance, they applied the RAPiD algorithm to data obtained in the 2011 Tohoku earthquake. Based on the quasi real-time fault determination, they found that esti- mated moment release reachedMw8.7 five minutes after the origin, which is relatively close to the actual earth- quake size ofMw9.0 compared to the first JMA magnitude estimation. They simulated a tsunami based on the es- timated fault plane using pre-computed tsunami Green’s functions. The estimated tsunami arrival time and height agreed well with actual tide-gauge data. It is noteworthy that their algorithm detected an event realized by the real- time GPS time series only. In other words, their algorithm needs no other information, for example, from the JMA’s earthquake early warning (EEW) system. In their devel- oped algorithm, however, the estimated moment release ofMw8.7 was clearly underestimated compared to the ac- tualMw9.0, which may have been due to the heterogeneity of fault slip distribution along the plate interface.
To determine earthquake size and expansion more re- liably, Crowell et al. (2012) [113] investigated two dif- ferent methods for rapidly inverting heterogeneous finite earthquake slip distribution using real-time GPS time se- ries. One method used pre-defined fault planes, such as the plate interface, and the other used the fastCMT solu- tion proposed by Melgar et al. (2012) [111] to initially estimate the ruptured fault plane. They applied their two methods to the 2003Mw8.3 Tokachi-Oki earthquake and the 2010Mw7.2 El Mayor-Cucapah earthquake in north- ern Baja California. Based on the two methods, they con- cluded that the fastCMT method performed well for both
earthquakes with the added benefit of requiring noa priori information on fault geometry. The estimated earthquake size (Mw) was the almost same as the actual one for both methods. These results were reasonable because they es- timated heterogeneous slip distribution on the fault plane.
In a similar approach, Colombelli et al. (2013) [114]
developed an inversion algorithm for slip distribution on the fault plane. Their strategy does not require restric- tive a priori assumptions about the ongoing earthquake and it is a “self-adapting” strategy. The initial fault plane used for slip inversion is built using preliminary estima- tion of magnitude and the model is then upgraded as new values for magnitude are determined. Hoechner et al.
(2013) [115] applied the GPS shield concept proposed by Sobolev et al. (2007) [106] to the 2011 Tohoku earth- quake. They also estimated tsunami height along Japan’s coastline based on estimated slip distribution on the plate interface. The estimated tsunami height exceeded 10 m around central Tohoku – a height consistent with actual tsunami height based on field surveys compiled by Mori et al. (2012) [116]. Melgar et al. (2013) [117] modi- fied the fastCMT algorithm through extension to a linear geometry by superposing point sources. It was modified mainly for the huge earthquake (Mw>8.5) because the point source assumption is clearly unsuitable for such a huge event. They inverted several moment tensors (MTs) along pre-defined points, after which they calculated the weighted average of all individual MTs to obtain a single CMT estimation. For a posteriori analysis of the 2011 To- hoku earthquake, they estimated a moment magnitude of 9.0 and its mechanism. This modified fastCMT algorithm is very useful for estimating both the earthquake mecha- nism and magnitude for large interplate earthquakes and other types of event. After information on the earth- quake mechanism and centroid is received from modified fastCMT analysis, they inverted for static slip using the same coseismic offsets as those used for CMT modeling.
These previous studies mostly used baseline analysis for processing real-time GNSS (GPS) data. Baseline anal- ysis has been used in many precise positioning applica- tions such as geodetic surveys. Baseline analysis in real time yields cm-level accuracy with few difficulties by pro- cessing carrier-phase observables of GNSS (GPS) signals at both user and reference receivers. In real-time baseline analysis, the reference site(s) must be used for process- ing. Ohta et al. (2012) [112] highlighted the effect of ground shaking on real-time baseline GPS analysis due to the passage of the long period seismic wave. Shaking at the reference site could cause incorrect estimation of co- seismic permanent displacement that could, in turn, cause unstable estimation of the coseismic fault model or slip distribution on the plate interface. From this perspective, they indicated that PPP is another way to monitor real- time crustal deformation. PPP uses data such as precise ephemerides and GNSS (GPS) satellite clock corrections provided by various analysis centers to estimate site co- ordinates without the need for data from reference sites.
PPP is advantageous in light of the problem of the shaking of the reference site. Wright et al. (2012) [118] applied
the PPP strategy to GPS data processing for the 2011 To- hoku earthquake for rapid coseismic fault slip determina- tion; inevitably, their result was not affected by the ref- erence site shaking. Real-time PPP, however, is slightly lacking in precision, accuracy, and stability compared to conventional real-time baseline analysis. This is mainly due to the quality of GNSS (GPS) satellite real-time or- bits and clock corrections. With future improvements of those products, the PPP approach should play a leading role in real-time crustal deformation monitoring.
In this and earlier sections, we have reviewed many works on near-field tsunami warning systems based on offshore tsunami measurement and onshore GNSS data.
In the sections that follow, we briefly review progress in implementing many of these strategies by governmental agencies in Japan.
4. Progress in Implementing Near-Field Tsunami Warning Systems Based on Off- shore Tsunami Data and Onshore GNSS Data in Japan
4.1. Offshore Tsunami Data
Here we briefly introduce progress made in implement- ing tsunami forecasting using offshore tsunami data for tsunami early warning systems in Japan.
After the 2011 Tohoku earthquake and tsunami, the JMA investigated the contents of tsunami warning bul- letins and the timing of their issue (Hoshiba and Ozaki, 2012 [119]; Japan Meteorological Agency, 2013 [120]).
The investigation pinpointed several problems, such as the underestimation of earthquake magnitude based on rapid analysis of seismic waves soon after the earthquake occurred that resulted in the underestimation of tsunami height. Improvements required to overcome some of the problems in basic policies and technical strategies were also indicated. After the investigation, certain activi- ties were performed to overcome these problems. Kat- sumata et al. (2013) [121], for example, developed a pro- cedure for avoiding underestimating earthquake magni- tude. Thereafter, in many great efforts for implementing these improvements, the JMA introduced a new tsunami warning system on March 7, 2013 (Japan Meteorologi- cal Agency, 2012 [122]; Japan Meteorological Agency, 2013 [120]).
One of the problems identified related to the tsunami warning for the 2011 Tohoku earthquake was that the data recorded by cabled OBPGs located further offshore than the GPS buoys were not used for updating the warning (Hoshiba and Ozaki, 2012 [119]). This was because the operating procedures for updating warnings using OBPG data had not yet been established at the time. The JMA therefore started to use cabled OBPG data for updating tsunami warnings on March 9, 2012. The measurement of tsunami height at an OBPG is converted to the height pre- dicted on the coast by applying an empirically obtained tsunami amplification factor. In 2012 and 2013, the JMA
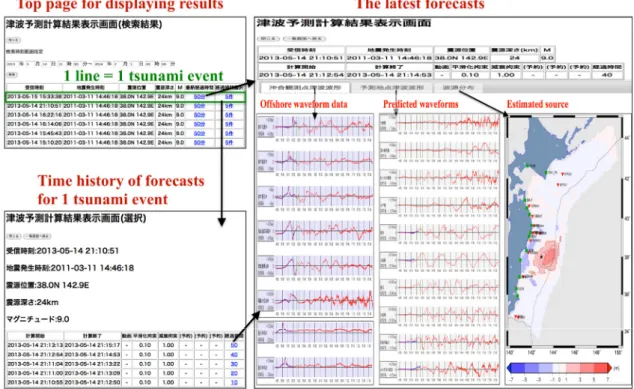
Fig. 2. Example of results provided by the prototype system for real-time tsunami forecasting developed by the Meteorological Research Institute.
deployed DART buoys in the outer regions of the Japan Trench to enhance offshore tsunami monitoring capabili- ties – these now account for three DART buoys been de- ployed in total (Fig. 1(a)). On December 25, 2012, these deep-ocean pressure measurements started being used for updating tsunami warnings based on the amplification factor approach.
Further improvement is presently being promoted. As mentioned in Section 2.2, source inversion is one of the most effective techniques for real-time tsunami pre- diction from offshore tsunami measurements, especially those recorded by cabled OBPGs and DART buoys, be- cause these data contain substantial information about the source. In an effort to implement such forecasting proce- dures into a tsunami warning system, the Meteorological Research Institute of the JMA developed a prototype sys- tem in 2012 for predicting near-field tsunami based on source inversion (Tsushima et al., 2013 [123]). Here, we briefly introduce the functions of the system and its per- formance for applications in real-time analysis. The ma- jor part of the system is based on the tFISH algorithm (Tsushima et al., 2009 [58], 2012a [17]) in which the distribution of initial sea-surface displacements inverted from offshore tsunami data is used for forecasting tsunami waveforms at target sites. In this system, offshore points near coastal sites are chosen as the target site. The pre- dicted tsunami height at the target site is then amplified to obtain the heights at coastal sites using the amplification factors developed by Hayashi (2010b) [73]. What trig- gers the real-time forecasting analysis is the earthquake magnitude fed into the system. Once the given magni- tude exceeds a pre-defined threshold, forecasting calcula-
tion is started automatically and is carried out repeatedly at short intervals by renewing offshore tsunami waveform data. The figures for the obtained results are produced automatically, i.e., the offshore tsunami waveforms, es- timated source model, and predicted tsunami waveforms (Fig. 2). These are viewed with a web browser and op- erators can therefore obtain the latest forecasting results promptly. The software used for real-time analysis is in- stalled on hardware that is designed specifically for the operation of software. The database of Green’s functions for the tsunami has been developed for two oceanic areas around Japan, i.e., the Kuril-Japan Trench and the Nankai Trough seismogenic regions. A simulated test run was performed using offshore tsunami data from the 2011 To- hoku earthquake (Tsushima et al., 2013 [123]). Forecast- ing calculations were performed in 10 to 50 minutes after the main shock at intervals of 10 minutes. Successive cal- culations were then undertaken without error despite the lack of data on offshore measurements, and the forecast- ing calculation was accomplished within about two min- utes. This shows that the system will deliver good perfor- mance for real-time analysis.
In future, many applications that may be developed for this prototype system using real data from past tsunami events and those using simulated data from assumed tsunamigenic earthquakes of various sizes and in various locations will be required for determining the detailed per- formance of the system. A performance test in which off- shore data without tsunami signals are used will be very important for verifying the capability of the system to avoid false alarms. The knowledge accumulated from test runs such as these will help bring the prototype system
closer to practical operation.
Studies on enhancing the procedures for reducing real- time noise will be very important in practical opera- tions of tsunami early warning systems, both for improv- ing tsunami forecasting accuracy and for avoiding false alarms due to noise contamination in offshore measure- ments. Specifically, a procedure for treating OBPG data should be prioritized for development for the large OBPG network that is currently under construction around Japan as detailed in Section 5. In addition to the effects of tsunamis, OBPG data include the effects of ocean tides, atmospheric and oceanographic disturbances, vertical de- formation of the seafloor, seismic waves, and elastic oscil- lations of water columns (Kajiura, 1970 [124]; Nosov and Kolesov, 2007 [125]; Matsumoto et al., 2012 [126]). It should be noted that false pressure variations with sub- stantial amplitudes due to temperature changes around OBPGs are sometimes recorded by an OBPG (Taka- hashi, 1981 [7]; Hirata and Baba, 2006 [127]; Baba et al., 2006 [128]; Inazu and Hino, 2011 [129]). Preex- isting procedures have been applied for reducing such noise components (Saito, 1978 [130]; Ishiguro et al., 1984 [131]; Matsumoto et al., 2000 [132]), and studies on the analysis of noise properties and the development of procedures to reduce individual noise components have been implemented (Hirata and Baba, 2006 [127]; Baba et al., 2006 [128]; Tolkova, 2009 [133]; Inazu and Hino, 2011 [129]; Matsumoto et al., 2012 [126]). Continuous improvements in noise reduction methods promise to de- liver more reliable tsunami warnings in the future.
4.2. Onshore Real-Time GNSS Data
In this section, we briefly introduce steps in the progress of the implementation of real-time GNSS pro- cessing for tsunami early warning systems in Japan.
The GSI operates a network of more than 1,200 contin- uous GNSS stations – the GNSS Earth Observation Net- work System, called GEONET – across the entire area of Japan (Fig. 1). Most GEONET stations record and trans- mit dual-frequency phase data once each second (1 Hz), and these have been used primarily as reference point data for public surveys since before the 2011 Tohoku earth- quake struck. Following the 2011 Tohoku earthquake, the policy board of the Headquarters for Earthquake Re- search Promotion in Japan commented about the future of high-precision tsunami early warning systems based on the underestimation of the predicted tsunami height for the 2011 Tohoku earthquake. The policy board suggested that the structural reinforcement of tsunami early warn- ing systems required for the mitigation of the tsunami hazard. They also highlighted the requirement for real- time crustal deformation monitoring by the onshore pre- existing GEONET. The Central Disaster Management Council of the Cabinet Office of the Japanese government also pointed out the requirement for more precise, more rapid tsunami forecasting techniques that should be based on a comprehensive approach. Following these govern- mental statements, the GSI decided from 2011 on the de-
velopment of monitoring crustal deformation in real time using GEONET real-time streaming data.
The GSI has been performing routine daily analyses of GEONET data since 1996, and so it revised its analysis strategies for routine daily analysis to achieve higher pre- cision and greater accuracy. The version of the routine analysis strategy currently used is version 4. This daily routine analysis solution is called the “F3” solution. The latency of the F3 solution is two weeks because of the delay in the release of final precise orbital information from the International GNSS Service. The GSI also esti- mates coordinates for all of the GEONET sites every three hours (data length is six hours, latency of the processing result is five hours), which is called the Q3 solution, based on the ultra-rapid orbital information from the Interna- tional GNSS Service. Previously, the GSI did not estimate the coordinates in real time except for a limited number of stations – a maximum of 30 sites – for experimental purposes (Nishimura et al., 2010 [108]). At around this same time, Tohoku University started its preliminary anal- ysis for real-time GNSS data processing for rapid earth- quake size determination and its practical use in tsunami early warning systems, which started before the 2011 To- hoku earthquake (Ohta et al., 2010 [134]; Kobayashi et al., 2010 [135]). The GSI and Tohoku University sub- sequently jointly developed a new real-time analysis sys- tem using the GEONET for quasi real-time Mw estima- tion, which has been in operation since September 2012.
The GSI launched the prototype of the real-time GNSS (GPS) analysis system in 2012 with 146 GEONET sta- tions mainly covering the Tohoku district, and this is planned for being expanded to cover all of Japan. This prototype system consists of three major components: (1) real-time GNSS data processing, (2) the automated ex- traction of displacement fields resulting from large earth- quakes, and (3) the automated estimation ofMwby an ap- proximated single rectangular fault model. For event de- tection, the RAPiD or EEW issued by the JMA has been adopted. This entire process is performed within a few minutes at most and estimated results are announced im- mediately to GSI personnel via email. The GSI is cur- rently assessing the stability, precision, and accuracy of the real-time GNSS time series based on the prototype system composing the 146 GEONET sites. Under the test operation of the prototype, the GSI has reported many false positives in crustal deformation using the RAPiD al- gorithm and caused mainly by the instability of the real- time GNSS time series. Kobayashi et al. (2012) [136]
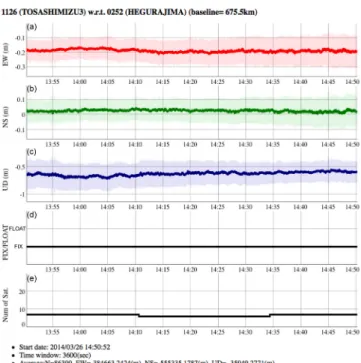
improved the RAPiD algorithm to mitigate these false positives of crustal deformation. Under the improved al- gorithm, an earthquake occurrence is defined as having occurred only when the target GNSS site and all of its neighboring GNSS sites have detect a displacement. They suggested that the improved algorithm would reduce the occurrence of false positives dramatically. A group from Tohoku University has also developed a visualization tool for monitoring the real-time GNSS time series (Demachi et al., 2013 [137]). Fig. 3shows an example of the real- time GNSS time series for the 1126 station of GEONET
Fig. 3. Example of real-time GNSS time series visualiza- tion developed by Demachi et al. (2013) [137]. Real-time streaming data were analyzed at Tohoku University. (a), (b), and (c) show east-west, north-south, and up-down compo- nents; (d) shows the status of the phase ambiguity resolu- tion of the GNSS data processing. FIX and FLOAT define whether phase ambiguity resolution is successful or unsuc- cessful; (e) shows the number of GNSS satellites used for processing. Note that this example is of a period in which nothing related to our subjects of interest has happened.
(Tosashimizu) relative to the 0252 station of GEONET (Hegurajima). The length of the baseline between the two sites is 676 km. The developed tool is used to plot the time series in real time and provide interactive operation. The tool is also used for zooming in on the time series interac- tively, which is an extremely important visualization func- tion used in the actual monitoring of all GEONET sites.
The GSI will thereby implement their visualization tool for real-time GNSS time series monitoring during 2014.
Based on these efforts, the GSI will expand real-time GNSS processing to Japan nationwide in 2014. Under current plans, the GSI intends to share information on earthquake size based on GNSS with the JMA.
5. Discussion and Concluding Remarks
In this section, we discuss projected developments for the introduction of a more reliable early warning system for near-field tsunamis. In Section 3, we have reviewed recent progress in near-field tsunami forecasting based on offshore tsunami measurements and onshore GNSS time series data. In this section, we will start by discussing the properties of each type of measurement.
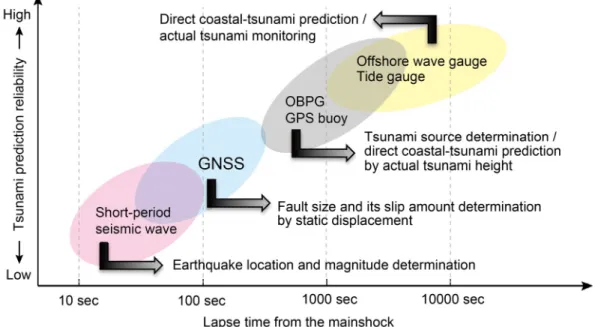
Figure 4 shows the coverage of individual types of
sensors used in near-field tsunami prediction. The rapid analysis of short-period seismic wave data, for example, Mjmaor EEW, by the JMA will provide the first informa- tion on the size and location of an earthquake. This is extremely important information in the first issuance of tsunami warnings.
Real-time GNSS data have an advantage compared with the seismometer in the robust estimation of the co- seismic fault dimension and location because the spatial pattern of permanent coseismic displacement from the GNSS measurements is strongly affected by these source parameters. Many other approaches exist, of course, for rapid determining the size of an earthquake and the mech- anism underlying it based on seismograms. W-phase anal- ysis, for example (Kanamori, 1993 [138]; Kanamori and Rivera, 2008 [139]), is one way of estimating the magni- tude of a huge earthquake within a very short time. Du- putel et al. (2011) [140] demonstrated the use of rapid W-phase analysis based on F-net broadband seismic net- work data obtained by the NIED for the 2011 Tohoku earthquake. These analyses are based on a point-source assumption, but finite-source parameters such as hetero- geneous slip distribution (Geist, 2002 [141]) and spatial extent greatly influence the resulting tsunami height dis- tribution regarding near-field coastal areas. The estimated point source can be translated to the finite fault model ex- perimentally by applying the scaling law between fault dimension and magnitude (e.g., Kanamori and Anderson, 1975 [142]). In the case of a huge earthquake, how- ever, coseismic fault expansion and its aspect ratio may be extremely diverse because the width and length of the seismogenic zone differ between subduction zones. Be- navente and Cummins (2013) [143] explored the appli- cability of W-phase waveform inversions for recovering the first-order coseismic slip distribution for a large earth- quake. They initially estimated the point source based on W-phase inversion, then they used a simple linear multi- ple time window method to account for changes in rup- ture velocity using smoothing and moment minimization constraints to infer the slip and rake variations over the fault. They also identified one of the problems involved in their approach, which is the question of how fault dimen- sions are to be determined. Seen from this perspective, real-time GNSS data have a distinct advantage in tsunami early warning.
In Section 3.2, we have reviewed the many efforts based on real-time GNSS data for the rapid determina- tion of earthquake size. Most studies identified that the entire process of earthquake size determination could be accomplished within a few minutes at most, which is al- most same as with the source time function of the tar- get event. As mentioned earlier, the GNSS is not band- limited, at least in principle. Real-time GNSS data are therefore expected to be useful in updating initial tsunami warnings based on short-period seismic data (Fig. 4). The use of onshore GNSS data alone, however, has limitations with regard to precise tsunami warnings because huge interplate earthquakes frequently occur far offshore. In fact, the maximum slip portion of the 2011 Tohoku earth-
Fig. 4. Individual sensor coverage for near-field tsunami early warnings. The horizontal axis shows the lapse time after the main shock. The vertical axis shows the reliability of predicted tsunami results.
quake was concentrated mainly in the up-dip portion of the subducting plate interface (e.g., Ide et al., 2011 [144];
Iinuma et al., 2012 [145]; Satake et al., 2013 [45]). In the 2011 event, localized large slip in the shallower por- tion of the subducting plate generated an impulsive large tsunami (e.g., Maeda et al., 2011 [18]). Tsunami forecast- ing based on the estimated earthquake size and its expan- sion determined by using onshore data is also an indirect estimation and thus it is expected that the combined use of both onshore and offshore data will provide more reli- able tsunami forecasting. Melgar and Bock (2013) [146], for example, developed a tsunami-forecasting algorithm based on the joint inversion of onshore GPS, strong mo- tion, and offshore and coastal tsunami data for a fault- slip model. They demonstrated that rapid ingestion of offshore shallow-water (100-1000 m) wave-gauge data, including the cabled-OBPG data, substantially improves the earthquake source and tsunami forecasts for the 2011 Tohoku earthquake.
From this point of view, the actual measurement of tsunami height in the offshore region also is important for revising tsunami warnings. It also takes longer, however, to obtain tsunami signals from offshore tsunami observa- tions than would be taken by measuring seismic waves and crustal deformation by using seismograph and GNSS because the tsunami propagates more slowly than elastic deformation. The time for detection depends strongly on the density and distribution of offshore sensors. In south- western Japan, the DONET2 network, which consists of 31 OBPG stations (yellow triangles inFig. 1(b)), is under now development around the Nankai seismogenic zone to complement the existing DONET1 (Kaneda, 2013 [147]).
Along the Japan Trench region, a cabled ocean-bottom observation network of a large scale and with high den- sity is now being constructed by the NIED (Uehira et al.,
2012 [148]; Kanazawa, 2013 [149]; Saito, 2013 [150]) (yellow triangles inFig. 1(c)). With this network, 150 sta- tions consisting of seismometer and pressure gauges is to be deployed at intervals of 30 to 60 km. This large- scale high-density OBPG network should prove to be very effective in improving the accuracy of tsunami fore- casting very quickly, as shown by numerical simulations based on source-inversion techniques (Tsushima et al., 2012b [151]) and on data-assimilation approaches with- out an earthquake and tsunami source (Maeda et al., 2013 [152]), although this deployment is proving to be very expensive.
Coastal tide gauges provide on-site tsunami informa- tion that can be used in upgrading tsunami warnings for other coastal areas that have not been directly af- fected by the tsunami. Monitoring the tsunami decay pro- cess (Hayashi et al., 2009 [153], 2011b [154]; Hayashi, 2012 [155]; Saito et al., 2013 [156]) from tide-gauge data is also useful for the timely cancellation of warnings con- cerning both near- and far-field tsunamis (Hayashi et al., 2010 [157], 2012 [158]) because tsunami heights at tide gauges are linked directly to information on the loss of life.
Individual types of sensors, as indicated previously, have both advantages and disadvantages, which means that multiple sensors should be used in combination to bring out the advantages of individual data sources. We have already reviewed Melgar and Bock’s approach in this section (Melgar and Bock, 2013 [146]), in which they demonstrated that the rapid ingestion of offshore shallow- water (100-1000 m) wave-gauge data substantially im- proved earthquake source and tsunami forecasts for the 2011 Tohoku earthquake. This is a very good example for the combination use of multiple types of sensors. We are also developing a different combination approach us-