_-Naphthylisothiocyanate (ANIT) Induced Cholestasis in Rats
Kiyohisa Uchida*†, Yoshio Ogura*, Nobuo Yamaga* and Kazuo Yamada*
*Division of Medical Biochemistry, Department of Pathophysiological and Therapeutic Science, School of Medicine, Tottori University, Yonago 683-8503 and †The Cell Science Research Foundation, Osaka 541-0045 Japan
In order to distinguish the disorder of bile acid and cholesterol metabolism in _-naphthyl-isothiocyanate (ANIT)-induced cholestasis, we examined changes in bile acid levels and compositions in bile, serum, feces and urine, as well as cholesterol levels in bile, serum, liver and feces in Wistar male rats (10–13 weeks) after a single oral administration of 100 mg/kg of ANIT. The bile flow and the biliary secretions of cholesterol, phospholipids and bile acids markedly decreased on days 1 and 2 but increased over the normal values on day 4 and then returned to the normal ranges. The fecal excretion of bile acids decreased after the treatment and remained low by day 4 but markedly increased thereafter. The urinary excretion of bile acids changed almost in parallel with serum bile acid level, increasing to 37 mg/day on day 2, 28 mg/day on days 3–4 but to a trace on days 5–6. The urinary bile acids on day 2 mainly consisted of cholic acid while those on days 3–4 and biliary bile acids on day 4 were mostly `-muricholic acid. The serum cholesterol level markedly increased maximally on day 2 and decreased thereafter. The fecal excretion of sterols, cholesterol and coprostanol, decreased on days 1–2 but rather increased thereafter. These data suggest that the cholestasis induced by ANIT is very similar to that in bile duct ligated rats for a short period but not to those ligated for long periods. In addition, the present data suggest that the bile acid independent bile flow is impaired and the daily synthesis of bile acids, especially `-muricholic acid, is increased in the ANIT induced cholestasis.
Key words: bile secretion; biliary lipids; fecal bile acids and sterols; _-naphthylisothiocyanate; serum lipids; urinary bile acids
Abbreviations: ANIT, _-naphthylisothiocyanate; bsep, bile salt export pump; GLC, gas-liquid chromatogra-phy; mdr2, multidrug resistance 2; mrp2, multidrug resistance associated protein 2
_-Naphthylisothiocyanate (ANIT) is a com-pound which causes cholestasis, hepatocellular and biliary epithelial cell necrosis, bile duct ob-struction and biliary epithelial cell hyperplasia in rats (Plaa and Priestly, 1976). The changes in biliary epithelial cells are reported to be com-parable to that induced by bile duct ligation (Kossor et al., 1995).
Previously, we examined the changes in bile acid metabolism after bile duct ligation in rats (Kinugasa et al., 1981, Takita et al., 1988) and those after the release of bile duct ligation (Fujio et al., 1989). A striking change in bile duct ligated rats was a marked increase in `-muricholic acid with a concomitant decrease of
cholic acid. The change was normalized within a week after the release of ligation regardless of the duration of ligation, but the changes in bile flow and biliary bile acid secretion were differ-ent according to the duration. Release after a 1-week ligation showed a temporal rebound in-crease in both bile flow and biliary bile acid se-cretion, but release after a 2-week ligation caused a continuous hypersecretion of the bile without any rebound increase in biliary bile acid secretion (Fujio et al., 1989).
In the present experiments, we examined the changes in bile flow and bile acid metabolism after ANIT administration until cholestasis was completely recovered in rats.
portion of the largest lobe of the liver ( lobus
si-nistra externa) was homogenized with 9
vol-umes of water. The serum and the liver homog-enate were extracted in 9 volumes of ethanol by refluxing for 20 min at 90–95˚C. Total choles-terol was determined with portions of the serum and liver lipid extracts as previously reported (Uchida et al., 1965). Phospholipids were de-termined by the method of Gomori (1942). Biliary lipid determination
The bile was added to 20 volumes of ethanol, brought to boil once for several minutes, cooled down to room temperature, and then filtered. An aliquot of the filtrate was evaporated to dryness under a mild stream of nitrogen and the residue was hydrolyzed at 120˚C for 6 h in 1.25 M sodium hydroxide solution. Sterols were ex-tracted with diethyl ether, the reaction mixture was acidified with 2 M hydrochloric acid and then the bile acids were extracted with diethyl ether. The bile acids were methylated with freshly prepared diazomethane and then tri-fluoroacetylated with trifluoroacetic anhydride. The bile acid derivatives were quantified by gas-liquid chromatography (GLC) with a 1% QF-1 column and cholesterol with a 1% SE-30 column (Uchida et al., 1970, 1977). Biliary phos-pholipids were determined by the methods of Gomori (1942).
Urinary and serum bile acid determina-tion
The urine was applied to an Amberlite XAD-2 column and bile acids were eluted with meth-anol according to the method of Makino et al. (1974). The eluate was evaporated to dryness and the residue was dissolved in 30 mL of acetone-ethanol (9:1) containing 0.01 volume of 2 M hy-drochloric acid. The solution was left at room temperature for 2 to 3 days to complete solvolysis. The reaction mixture was then evaporated to dry-ness and the residue was subjected to alkaline hydrolysis. After extraction with diethyl ether, the bile acids were methylated and trifluoroacetylat-ed, and analyzed by GLC as mentioned above.
Serum bile acids were isolated by the use of an Amberlyst A-26 column (Sandberg et al., Materials and Methods
ANIT obtained from Nakarai Pure-Chemicals (Tokyo, Japan) was dissolved in corn oil at a con-centration of 100 mg/mL, and a single dose of ANIT (100 mg/kg) was administered orally to rats. This dosage was selected based on the re-port of Kossor et al. (1995) who examined the effect of various doses of ANIT (25–150 mg/kg) in rats and showed that a dose of 100 mg/kg induc-ed a modest cholestasis at 48 h after treatment. Control rats received 1 mL/kg of corn oil orally. Animal treatments
Wistar strain male rats weighing about 300 g (10–13 weeks old) were kept in an air-condi-tioned room (25 ± 1˚C, 50–60% humidity) lighted 12 h a day (8:00–20:00) and maintained on a commercial stock diet ( Japan CLEA CA-1, Tokyo, Japan).
In the first experiment, rats were individual-ly caged and daiindividual-ly urine specimens were col-lected for 10 days after the administration of ANIT. Daily urine volume, diet intake and wa-ter intake were recorded. In the second experi-ment, rats were individually caged and sacrific-ed 2, 4, 6, 8 and 10 days after the administration of ANIT to collect bile, blood and liver speci-mens. Two-day feces specimens were collect-ed prior to sacrifice as describcollect-ed previously (Uchida et al., 1977). On the day of sacrifice, the rats were cannulated of their bile duct with PE-10 polyethylene tubings in order to collect the bile for 30 min under sodium pentobarbital anesthesia (50 mg/kg, intraperitoneally). Dur-ing the time of bile collection, the rectal temper-ature was maintained at 36–37˚C using an elec-tric warm plate. The blood was then withdrawn by heart puncture and the liver was removed for lipid determination. Bile was collected be-tween 9:00–11:00 to avoid any variation due to the circadian rhythm.
Serum and liver lipid determination The serum was separated by centrifugation at 3,000 rpm for 15 min after allowing the blood to stand for at least 30 min at room temperature. A
1965) and quantified by GLC after alkaline hy-drolysis without any procedure for solvolysis. Fecal sterol and bile acid determination The feces were dried and powdered, according to the procedures described previously (Uchida et al., 1977). An aliquot of the pulverized feces was extracted with 20 volumes of boiling etha-nol for 1 h and filtered after cooling down to room temperature. The extraction procedures were repeated three times. The combined fil-trate was evaporated to dryness under reduced pressure, and the residue was hydrolyzed at 120˚C for 6 h in 1.25 M sodium hydroxide
solu-tion. Sterols were extracted with diethyl ether, the reaction mixture was acidified with 2 M hydrochloric acid and then bile acids were ex-tracted with diethyl ether. The methylated and trifluoroacetylated bile acids were quantified by GLC with a 1% QF-1 column and sterols with a 1% SE-30 column (Uchida et al., 1977; Kinugasa et al., 1981). The extraction efficiency of sterols and bile acids from feces was over 92.5% (Kinugasa et al., 1981).
Statistical analysis
Data are expressed as mean ± SE. The difference between the means of variables was calculated
Table 1. Changes in body weight, diet intake and water intake after _-naphthylisothiocyanate (ANIT) administration in rats
Days after ANIT administration
0 1 2 4 6 8 10
Body weight (g) 338 ± 3.2 315 ± 3.8* 304 ± 2.3* 312 ± 1.5* 318 ± 5.2 332 ± 4.1 342 ± 2.7 Diet intake (g/day) 22 ± 1.0 5 ± 0.8* 3 ± 1.3* 14 ± 2.7* 22 ± 1.0 26 ± 1.4 — Water intake (mL/day) 30 ± 4.5 5 ± 1.6* 18 ± 4.4 33 ± 2.8 34 ± 5.3 39 ± 3.5 —
Mean ± SE in 5 rats. —, not determined.
* Statistically significant compared with day 0 (P < 0.05).
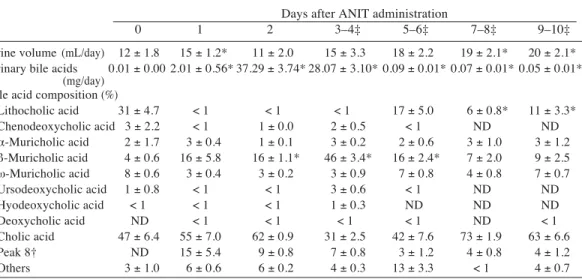
Table 2. Changes in urinary bile acids after _-naphthylisothiocyanate (ANIT) administration in rats Days after ANIT administration
0 1 2 3–4‡ 5–6‡ 7–8‡ 9–10‡
Urine volume (mL/day) 12 ± 1.8 15 ± 1.2* 11 ± 2.0 15 ± 3.3 18 ± 2.2 19 ± 2.1* 20 ± 2.1* Urinary bile acids 0.01 ± 0.00 2.01 ± 0.56* 37.29 ± 3.74* 28.07 ± 3.10* 0.09 ± 0.01* 0.07 ± 0.01* 0.05 ± 0.01*
(mg/day) Bile acid composition (%)
Lithocholic acid 31 ± 4.7 < 1 < 1 < 1 17 ± 5.0 6 ± 0.8* 11 ± 3.3* Chenodeoxycholic acid 3 ± 2.2 < 1 1 ± 0.0 2 ± 0.5 < 1 ND ND _-Muricholic acid 2 ± 1.7 3 ± 0.4 1 ± 0.1 3 ± 0.2 2 ± 0.6 3 ± 1.0 3 ± 1.2 `-Muricholic acid 4 ± 0.6 16 ± 5.8 16 ± 1.1* 46 ± 3.4* 16 ± 2.4* 7 ± 2.0 9 ± 2.5 t-Muricholic acid 8 ± 0.6 3 ± 0.4 3 ± 0.2 3 ± 0.9 7 ± 0.8 4 ± 0.8 7 ± 0.7 Ursodeoxycholic acid 1 ± 0.8 < 1 < 1 3 ± 0.6 < 1 ND ND Hyodeoxycholic acid < 1 < 1 < 1 1 ± 0.3 ND ND ND Deoxycholic acid ND < 1 < 1 < 1 < 1 ND < 1 Cholic acid 47 ± 6.4 55 ± 7.0 62 ± 0.9 31 ± 2.5 42 ± 7.6 73 ± 1.9 63 ± 6.6 Peak 8† ND 15 ± 5.4 9 ± 0.8 7 ± 0.8 3 ± 1.2 4 ± 0.8 4 ± 1.2 Others 3 ± 1.0 6 ± 0.6 6 ± 0.2 4 ± 0.3 13 ± 3.3 < 1 4 ± 0.7 Mean ± SE in 5 rats. ND, not detectable. † Unidentified.
‡ Samples of 2-day urine specimens were combined. * Statistically significant compared with day 0 (P < 0.05).
by Student’s t-test. Values of P < 0.05 were con-sidered to be statistically significant.
Results
As shown in Table 1, the body weight decreased and showed the lowest value on day 2 after ANIT administration and recovered gradually there-after. Diet and water intake decreased marked-ly on the first day but diet intake recovered to the initial level by day 6 and the water intake by day 4.
Urine volume increased on day 1, returned to the initial level on day 2, and slightly increas-ed thereafter. The urinary excretion of bile acids markedly increased on day 2 and probably on day 3, and then rapidly decreased. The ma-jor component in urinary bile acids was cholic acid in the control rats, but `-muricholic acid increased after ANIT administration and be-came the major component on days 3–4. Cholic acid rather decreased on days 3–4, but gradually increased thereafter in accordance with the de-crease of `-muricholic acid (Table 2).
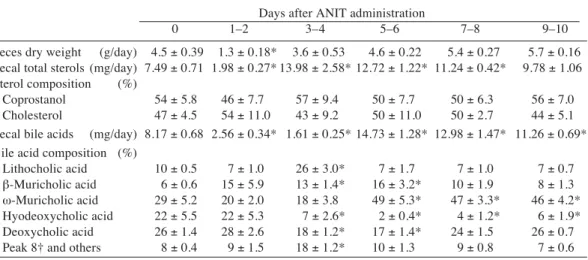
The changes in the feces dry weight, and fecal sterol and bile acid excretions are shown in Table 3. The feces dry weight decreased on
days 1–2 but was restored after days 5–6. The fecal sterol excretion decreased once on days 1– 2, but markedly increased on days 3–4 and then gradually decreased. The composition ratios of coprostanol and cholesterol were almost identi-cal in all the groups. The feidenti-cal bile acid excre-tion decreased after ANIT administraexcre-tion to the lowest level on days 3–4, but in turn markedly increased on days 5–6 attaining almost twice the level of the control rats, and gradually de-clined thereafter. Deoxycholic acid comprised about 25% in the control rats but decreased on days 3–4 and 5–6, and was then restored to the initial level. Instead, `-muricholic acid and t-muricholic acid increased while deoxycholic acid decreased. Hyodeoxycholic acid decreas-ed after days 3–4, and remaindecreas-ed low thereafter, while t-muricholic acid increased and kept high levels after days 5–6.
Table 4 shows the changes in the bile flow and biliary lipid secretions after ANIT adminis-tration. The bile flow markedly decreased, al-most to 1/10 that of the initial level, on days 1 and 2, but increased showing higher levels than the initial level on days 4 and 10. Biliary bile acid secretion also decreased on days 1 and 2, increased on day 4 and was restored to the con-trol level after day 6. The biliary cholesterol
Table 3. Changes in feces dry weight and fecal sterols and bile acids after _-naphthylisothio-cyanate (ANIT) administration in rats
Days after ANIT administration
0 1–2 3–4 5–6 7–8 9–10
Feces dry weight (g/day) 4.5 ± 0.39 1.3 ± 0.18* 3.6 ± 0.53 4.6 ± 0.22 5.4 ± 0.27 5.7 ± 0.16 Fecal total sterols (mg/day) 7.49 ± 0.71 1.98 ± 0.27* 13.98 ± 2.58* 12.72 ± 1.22* 11.24 ± 0.42* 9.78 ± 1.06 Sterol composition (%)
Coprostanol 54 ± 5.8 46 ± 7.7 57 ± 9.4 50 ± 7.7 50 ± 6.3 56 ± 7.0 Cholesterol 47 ± 4.5 54 ± 11.0 43 ± 9.2 50 ± 11.0 50 ± 2.7 44 ± 5.1 Fecal bile acids (mg/day) 8.17 ± 0.68 2.56 ± 0.34* 1.61 ± 0.25* 14.73 ± 1.28* 12.98 ± 1.47* 11.26 ± 0.69* Bile acid composition (%)
Lithocholic acid 10 ± 0.5 7 ± 1.0 26 ± 3.0* 7 ± 1.7 7 ± 1.0 7 ± 0.7 `-Muricholic acid 6 ± 0.6 15 ± 5.9 13 ± 1.4* 16 ± 3.2* 10 ± 1.9 8 ± 1.3 t-Muricholic acid 29 ± 5.2 20 ± 2.0 18 ± 3.8 49 ± 5.3* 47 ± 3.3* 46 ± 4.2* Hyodeoxycholic acid 22 ± 5.5 22 ± 5.3 7 ± 2.6* 2 ± 0.4* 4 ± 1.2* 6 ± 1.9* Deoxycholic acid 26 ± 1.4 28 ± 2.6 18 ± 1.2* 17 ± 1.4* 24 ± 1.5 26 ± 0.7 Peak 8† and others 8 ± 0.4 9 ± 1.5 18 ± 1.2* 10 ± 1.3 9 ± 0.8 7 ± 0.6
Mean ± SE in 5 rats. † Unidentified.
and phospholipid secretions changed almost in parallel with the bile acid secretion.
Striking changes in the biliary bile acid com-position were an increase of `-muricholic acid and a concomitant decrease of cholic acid on days 2 and 4. The compositions of the other bile acids were not changed significantly (Table 5).
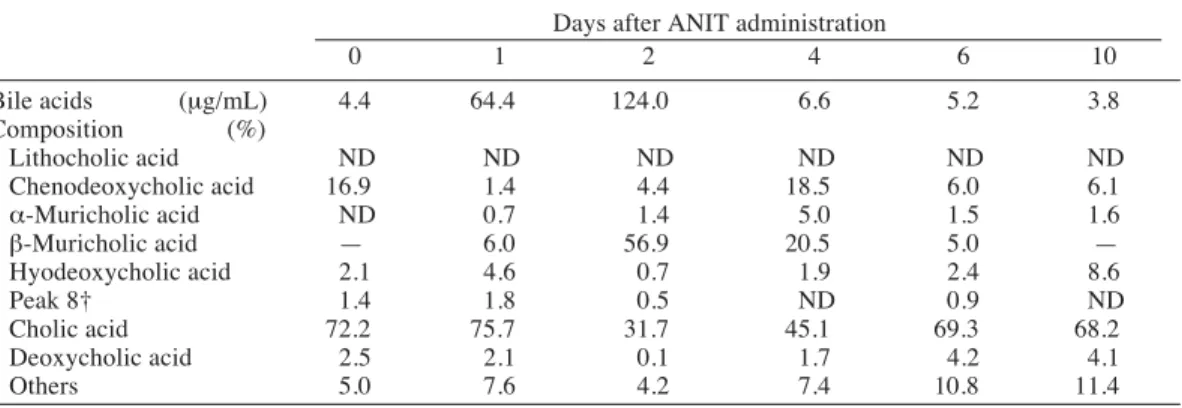
As shown in Table 6, the serum bile acid concentration markedly increased on day 1 and maximally on day 2 (about 30-fold) but abrupt-ly declined on day 4 almost attaining the control level. A decrease in cholic acid and an increase in `-muricholic acid were also noted on days 2 and 4. Chenodeoxycholic acid showed high values on day 0 and day 4, but the reason for this large variation was not clear. Such a high value for chenodeoxycholic acid was detected neither in the urine, feces nor bile.
The correlations between biliary bile acid
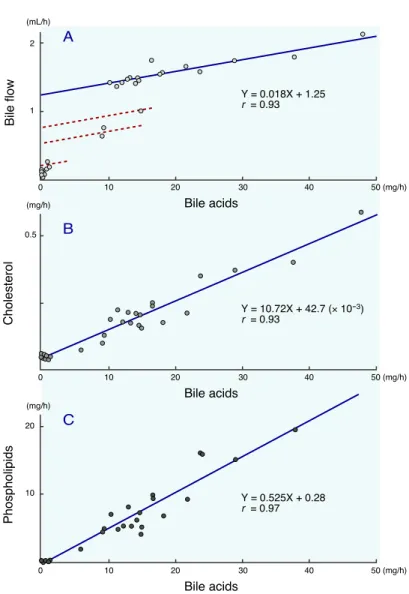
secretion and bile flow, biliary bile acid secre-tion and biliary cholesterol secresecre-tion, and bili-ary bile acid secretion and bilibili-ary phospholipid secretion are shown in Fig. 1. As shown in Fig. 1A, a linear regression line was obtained be-tween the bile acid secretion and bile flow in the region where the bile acid secretion was over 10 mg/h, by which the bile acid dependent bile flow was calculated to be 0.018 mL/mg and the bile acid independent bile flow to be 1.25 mL/h. However, in the region where the bile acid se-cretion was less than 10 mg/h, the spots were under the regression line.
On the contrary, the cholesterol and phos-pholipid secretions were linearly related to the bile acid secretion in all regions. It was calcu-lated from these relationships that the choles-terol/bile acids ratio in the bile was 0.012 and the phospholipids/bile acids ratio was 0.27 on a
Table 5. Changes in biliary bile acid composition after _-naphthylisothiocyanate (ANIT) admini-stration in rats
Composition Days after ANIT administration
(%) 0 1 2 4 6 10 Lithocholic acid 1 ± 0.1 < 1 <1 1 ± 0.0 < 1 < 1 Chenodeoxycholic acid 3 ± 0.8 1 ± 0.4 1 ± 0.2* 5 ± 0.9 2 ± 0.2 3 ± 0.5 _-Muricholic acid 3 ± 0.5 2 ± 0.6 2 ± 0.1 4 ± 0.5 3 ± 0.4 3 ± 0.3 `-Muricholic acid 24 ± 4.5 25 ± 10.3 48 ± 7.3* 42 ± 5.3* 27 ± 7.0 22 ± 4.6 t-Muricholic acid 1 ± 0.1 2 ± 0.2 1 ± 0.1 < 1 1 ± 0.1 1 ± 0.2 Hyodeoxycholic acid 2 ± 0.4 4 ± 0.7 1 ± 0.2 1 ± 0.2 1 ± 0.4 2 ± 0.4 Deoxycholic acid 2 ± 0.1 1 ± 0.1* 1 ± 0.1* 1 ± 0.3* 3 ± 0.3 4 ± 0.3* Cholic acid 41 ± 0.8 38 ± 9.6 31 ± 6.8 21 ± 1.6* 42 ± 4.4 45 ± 2.1 Peak 8† 14 ± 2.4 16 ± 2.1 9 ± 1.5 16 ± 4.3 13 ± 3.7 13 ± 2.7 Others 9 ± 0.6 12 ± 0.9* 8 ± 0.7 9 ± 1.4 8 ± 1.6 8 ± 1.0 Mean ± SE in 5 rats. † Unidentified.
* Statistically significant compared with day 0 (P < 0.05).
Table 4. Changes in bile flow and biliary lipid secretions after _-naphthylisothiocyanate (ANIT) administration in rats
Days after ANIT administration
0 1 2 4 6 10 Bile flow (mL/h) 1.43 ± 0.02 0.12 ± 0.02* 0.12 ± 0.04* 1.83 ± 0.11* 1.23 ± 0.17 1.60 ± 0.05* Total cholesterol (mg/h) 0.20 ± 0.01 0.05 ± 0.00 0.05 ± 0.00 0.43 ± 0.05* 0.18 ± 0.03 0.19 ± 0.01 Phospholipids (mg/h) 5.03 ± 0.39 0.27 ± 0.07* 0.24 ± 0.06* 20.22 ± 3.74* 6.74 ± 0.90 7.53 ± 0.81* Bile acids (mg/h) 12.90 ± 0.82 0.37 ± 0.26* 0.52 ± 0.16* 34.49 ± 5.32* 12.61 ± 1.37 16.72 ± 1.49 Mean ± SE in 5 rats.
molar basis. Therefore, the molar ratio of cho-lesterol and phospholipids in the bile was about 1:22.
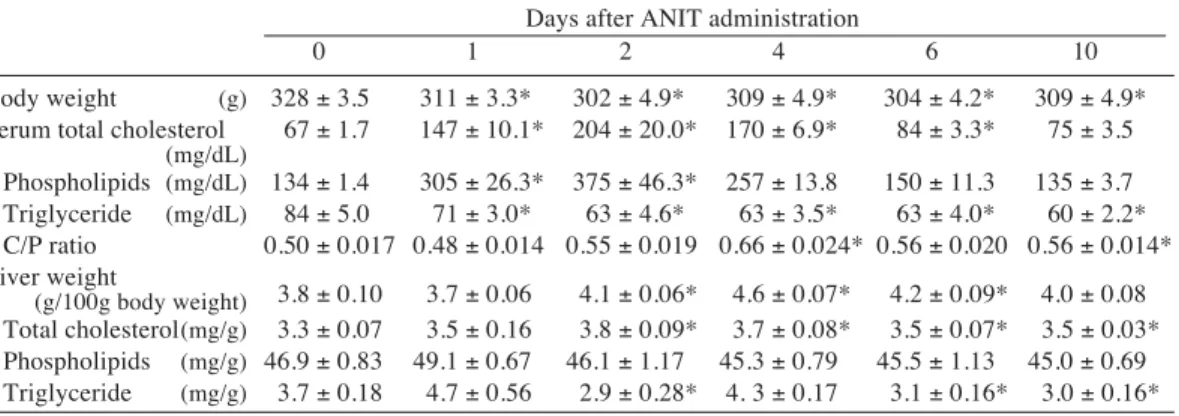
The changes in the serum and liver lipid levels are given in Table 7. The serum choles-terol and phospholipid levels significantly in-creased on day 1 and further inin-creased on day 2, but gradually decreased thereafter and return-ed to control levels on day 10. The cholesterol/ phospholipids ratio remained almost constant but rather increased after day 4. The serum tri-glyceride level slightly decreased after ANIT administration. The liver weight per 100 g body weight rather increased after day 2, reflecting decreases in body weight. The liver cholesterol level slightly increased after ANIT treatment but the phospholipid levels remained unchang-ed. The liver triglyceride level decreased on day 2 but only slightly on days 6 and 10.
Discussion
The present experiments not only demonstrated that ANIT caused cholestasis in rats, but also clarified the changes in cholesterol and bile acid levels in the bile, serum, liver, urine and feces in relation to cholestasis. The bile flow was in-hibited, less than 10% of the control, for at least 2 days after a single oral administration of 100 mg/kg of ANIT, but showed hypersecretion on day 4 and then returned to the control level.
The biliary secretions of bile acids, cholesterol and phospholipids changed almost in parallel with the bile flow. These changes are almost consistent with previous reports (Maeyama, 1977, Fukumoto et al., 1980, Lock et al., 1982). In the previous experiment, we examined changes in bile flow and biliary bile acid secre-tion after release of the bile duct ligasecre-tion in rats (Fujio et al., 1989). The release after a short period of obstruction restored normal bile flow but release after a long period of obstruction did not. When the ligation was released by 1 week, bile flow and biliary bile acid secretion increas-ed once over the control levels and were then restored to the normal ranges. When the liga-tion was released after 2 weeks, the bile flow markedly increased and remained high there-after, while the biliary bile acid secretion gradu-ally increased to the normal range. The present data in the ANIT treated rats coincide with the pattern observed after a short period ligation.
As shown in Fig. 1A, the spots in the region where the bile acid secretion was less than 10 mg/h were under the regression line. The bile acid dependent bile flow is provided by the bili-ary bile acid composition and is increased by non-micellar bile acids such as oxo-bile acids (Loria et al., 1989). ANIT treatment caused changes in bile acid composition, an increase of `-muricholic acid with a concomitant decrease of cholic acid, but showed no remarkable in-crease of oxo-bile acids (Table 5). Therefore, it
Table 6. Changes in serum bile acids after _-naphthylisothiocyanate (ANIT) administration in rats Days after ANIT administration
0 1 2 4 6 10 Bile acids (μg/mL) 4.4 64.4 124.0 6.6 5.2 3.8 Composition (%) Lithocholic acid ND ND ND ND ND ND Chenodeoxycholic acid 16.9 1.4 4.4 18.5 6.0 6.1 _-Muricholic acid ND 0.7 1.4 5.0 1.5 1.6 `-Muricholic acid — 6.0 56.9 20.5 5.0 — Hyodeoxycholic acid 2.1 4.6 0.7 1.9 2.4 8.6 Peak 8† 1.4 1.8 0.5 ND 0.9 ND Cholic acid 72.2 75.7 31.7 45.1 69.3 68.2 Deoxycholic acid 2.5 2.1 0.1 1.7 4.2 4.1 Others 5.0 7.6 4.2 7.4 10.8 11.4
Samples of 5 rats were combined before analysis. —, included in cholic acid.
ND, not detectable. † Unidentified.
2 1 0.5 20 10 Bile acids 0 10 20 30 40 50 (mg/h) Bile acids 0 10 20 30 40 50 (mg/h) Bile acids 0 10 20 30 40 50 (mg/h) Bile flow Cholesterol Phospholipids (mL/h) (mg/h) (mg/h) A B C Y = 0.018X + 1.25 r = 0.93 Y = 10.72X + 42.7 (× 10-3) r = 0.93 Y = 0.525X + 0.28 r = 0.97
Fig. 1. Correlations between biliary bile acid secretion and bile flow (A), biliary bile acid secretion and biliary cholesterol secretion (B) and biliary bile acid secretion and biliary phospholipid secretion (C) in controls and ANIT treated rats. Broken lines in (A) are given under the assumption that the bile acid dependent bile flow is not changed by ANIT (see text).
is assumed that bile acid dependent bile flow is not influenced by ANIT. Based on this assum-ption, dots representing the bile acid secretion in the region less than 10 mg/h are considered to be on the regression lines shown by broken lines having the same slope with the solid line.
Fukumoto et al. (1980) and Lock et al. (1982) reported that the bile acid independent bile flow was inhibited in ANIT treated rats from a study measuring the biliary clearance of erythritol. This conclusion was consistent with the present
data (Fig. 1A). Furthermore, the bile flow in ANIT treated rats markedly increased on day 4, but this increase was due to the bile acid depen-dent bile flow, because the plots for day 4 were completely matched with the regression line be-tween biliary bile acid secretion and bile flow (Fig. 1A). On the other hand, the cholesterol and phospholipid secretions were linearly relat-ed to the bile acid secretion closing the origin (Figs. 1B and C), and the molar ratio of choles-terol and phospholipid in the bile was 1:22.
This value is not consistent with the cholesterol and phospholipid ratio in the liver membrane of rats (Daum, 1985).
Biliary bile acid excretion is under the regu-lation of transporters, the bile salt export pump (bsep) (Gerloff et al., 1998) and multidrug re-sistance associated protein 2 (mrp2) (Paulusma et al., 1996), in the canalicular membrane of the hepatocyte. Bsep is concerned with the excre-tion of amino acid conjugated bile acids and mrp2 with the excretion of bile acid sulfates and glucuronides. Biliary cholesterol and phospho-lipid secretions are related to multidrug resist-ance 2 (mdr2) P-glycoprotein. Phospholipid se-cretion is completely, and the cholesterol secre-tion is partially, dependent on mdr2 gene ex-pression (Oude Elferink et al., 1996).
Cholestasis induced by lipopolysaccharide (Kubitz et al., 1999; Lee et al., 2000), phalloidin (Rost et al., 1999), ethinylestradiol (Lee et al., 2000), or bile duct ligation (Lee et al., 2000; Paulusma et al., 2000) is accompanied by changes in bsep and/or mrp2. ANIT produced cholestasis and decreased biliary cholesterol and phospho-lipid secretion in parallel with the bile acid se-cretion (Figs. 1B and C), but ANIT is reported to have no effect on mrp2 (Ogawa et al., 2000). The effect of ANIT on bsep is not yet known.
`-Muricholic acid in the biliary bile aids in-creased especially on day 4, the day when the biliary bile acid secretion markedly increased,
with a concomitant decrease in cholic acid. These changes, however, were normalized on day 6 or later. Maeyama (1977) also reported an increase of `-muricholic acid in ANIT treat-ed rats even after the bile flow was recovertreat-ed. The increase of `-muricholic acid and a de-crease of cholic acid were also found in the se-rum, urine and feces. In the feces, the increase of `-muricholic acid was found as the increase of t-muricholic acid formed from `-muricholic acid by the action of intestinal bacteria.
The increase of `-muricholic acid is also re-ported in bile duct ligated rats (Kinugasa et al., 1981; Takita et al., 1988; Fujio et al., 1989), in-dicating that cholestasis causes an increase in `-muricholic acid formation. Takita et al. (1988) suggested that an alternative metabolic pathway in bile acid synthesis via 26-hydroxycholesterol, 3`-hydroxy-5-cholenoic acid and lithocholic acid contributes to the increase of `-muricholic acid in bile duct ligated rats. `-Muricholic acid formation is known to increase after the feeding of cholesterol in rats (Uchida et al., 1977), which results in an elevation of the liver cholesterol level. In the case of ANIT treatment (the pres-ent experimpres-ent) and bile duct ligation (Kinugasa et al., 1981), a minor or no increase in the liver cholesterol level was found, though significant hypercholesterolemia was produced. The mecha-nism for this increase of `-muricholic acid in cholestasis is not yet known.
Table 7. Changes in serum and liver lipid levels after _-naphthylisothiocyanate (ANIT) administra-tion in rats
Days after ANIT administration
0 1 2 4 6 10
Body weight (g) 328 ± 3.5 311 ± 3.3* 302 ± 4.9* 309 ± 4.9* 304 ± 4.2* 309 ± 4.9* Serum total cholesterol 67 ± 1.7 147 ± 10.1* 204 ± 20.0* 170 ± 6.9* 84 ± 3.3* 75 ± 3.5
(mg/dL) Phospholipids (mg/dL) 134 ± 1.4 305 ± 26.3* 375 ± 46.3* 257 ± 13.8 150 ± 11.3 135 ± 3.7 Triglyceride (mg/dL) 84 ± 5.0 71 ± 3.0* 63 ± 4.6* 63 ± 3.5* 63 ± 4.0* 60 ± 2.2* C/P ratio 0.50 ± 0.017 0.48 ± 0.014 0.55 ± 0.019 0.66 ± 0.024* 0.56 ± 0.020 0.56 ± 0.014* Liver weight 3.8 ± 0.10 3.7 ± 0.06 4.1 ± 0.06* 4.6 ± 0.07* 4.2 ± 0.09* 4.0 ± 0.08 (g/100g body weight) Total cholesterol(mg/g) 3.3 ± 0.07 3.5 ± 0.16 3.8 ± 0.09* 3.7 ± 0.08* 3.5 ± 0.07* 3.5 ± 0.03* Phospholipids (mg/g) 46.9 ± 0.83 49.1 ± 0.67 46.1 ± 1.17 45.3 ± 0.79 45.5 ± 1.13 45.0 ± 0.69 Triglyceride (mg/g) 3.7 ± 0.18 4.7 ± 0.56 2.9 ± 0.28* 4. 3 ± 0.17 3.1 ± 0.16* 3.0 ± 0.16* Mean ± SE in 5 rats. C/P, cholesterol/phospholipids.
The serum bile acid concentration markedly increased after ANIT treatment and the urinary bile acid excretion increased being delayed about 1 day more than the increase of the serum bile acids. The enormous amounts of urinary bile acids on day 2 came, we expect, from the bile acid pool in the enterohepatic circulation.
Fecal bile acid excretion decreased during cholestasis, but increased after day 5 or later exceeding the initial level. This increase is a reflection of the increase of the bile acid synthe-sis in the liver. Hepatic cholesterol synthesynthe-sis and cholesterol 7_-hydroxylation activities are reported to increase in bile duct ligated rats (Danielsson, 1973; Cooper and Ockner, 1974; Adler et al., 1977). When one lobe of the liver was experimentally ligated, cholesterol synthe-sis increased only in the ligated lobe (Cooper and Ockner, 1974; Adler et al., 1977). There-fore, cholestasis is considered to increase hepat-ic cholesterol synthesis, and probably subse-quent bile acid synthesis, in rats.
Fecal sterol excretion decreased on days 1– 2 reflecting a decrease in feces dry weight, but markedly increased on days 3–4 and then grad-ually decreased to the initial level. The compo-sition ratios of coprostanol and cholesterol were almost identical through out the experimental period, suggesting that the intestinal bacteria concerned with the sterol transformation were not changed by ANIT treatment. On the other hand, the secondary bile acid composition was changed after ANIT treatment. t-Muricholic acid increased and hyodeoxycholic acid de-creased after days 5–6 or later. `-Muricholic acid is transformed to t-muricholic acid and then to hyodeoxycholic acid by the intestinal bacteria. Therefore, the intestinal bacteria con-cerned with the bile acid metabolism were changed in the ANIT treated rats.
The serum cholesterol and phospholipid levels increased for 4 to 5 days after ANIT treatment. Since enhancement of cholesterol absorption is not the reason, the increase may be a reflection of biliary epithelial cell necrosis (Orsler et al., 1999).
Acknowledgments: We sincerely thank Messrs. Haruto
Takase, Yasuharu Nomura, Masumi Kadowaki and Masao Masui of Shionogi Research Laboratories for their skillful technical assistance, and also Ms. Yoshiko Kurosawa of The Cell Science Research Foundation, Mr. Morio Oohori of Shionogi Co. Ltd., and Ms. Yumiko Uyama of the Division of Medical Biochem-istry, Department of Pathophysiological and Thera-peutic Science, School of Medicine, Tottori University for their help in preparing the manuscript.
References
1 Adler RD, Wannagat FJ, Ockner RK. Bile secre-tion in selective biliary obstrucsecre-tion. Adaptasecre-tion of taurocholate transport maximum to increased secretory load in the rat. Gastroenterology 1977; 73:129–136.
2 Cooper AD, Ockner RK. Studies of hepatic cho-lesterol synthesis in experimental acute biliary obstruction. Gastroenterology 1974;66:586–595. 3 Danielsson H. Effect of biliary obstruction on formation and metabolism of bile acids in rat. Steroids 1973;22:567–579.
4 Daum G. Lipids of mitochondria. Biochim Bio-phys Acta 1985;822:1–42.
5 Fujio Y, Yamamoto M, Uchida K, Saito Y. Studies on changes in bile flow and bile acid metabolism after intra-duodenal release of bile in bile duct li-gated rats. Tando 1989;3:118–129 (in Japanese with English abstract).
6 Fukumoto Y, Okita K, Kodama T, Noda K, Harada T, Mizuta M, et al. Studies of _-naphthylisothio-cyanate-induced hepatic disturbance. Hepato-Gastroenterology 1980;27:457–464.
7 Gerloff T, Stieger B, Hagenbuch B, Landmann LA, Meier PJ. The sister of P-glycoprotein represents the canalicular bile salt export pump of mam-malian liver. J Biol Chem 1998;273:10046– 10050.
8 Gomori G. A modification of the colorimetric phosphorus determination for use with the photo-electric colorimeter. J Lab Clin Med 1942;27: 955–960.
9 Kinugasa T, Uchida K, Kadowaki M, Takase H, Nomura Y, Saito Y. Effect of bile duct ligation on bile acid metabolism in rats. J Lipid Res 1981; 22:201–207.
10 Kossor DC, Goldstein RS, Ngo W, DeNicola DB, Leonard TB, Dulik DM, et al. Biliary epithelial cell proliferation following _-naphthyl-isothio-cyanate (ANIT) treatment: relationship to bile duct obstruction. Fundam Appl Toxicol 1995;26: 51–62.
11 Kubitz R, Wettstein M, Warskulat U, Haussinger D. Regulation of multidrug resistance protein 2 in the rat liver by lipopolysaccharide and dexameth-azone. Gastroenterology 1999;116:401–410.
12 Lee JM, Trauner M, Soroka CJ, Stieger B, Meier PJ, Boyer JL. Expression of the bile salt export pump is maintained after chronic cholestasis in the rat. Gastroenterology 2000;118:163–172. 13 Lock S, Lavigne J, Plaa GL. The effect of
_-naphthylisothiocyanate on bile secretion prior to and during the onset of cholestasis in the rat. Toxicol Lett 1982;10:427–435.
14 Loria P, Carulli N, Medici G, Tripodi A, Iori R, Rovesti S, et al. Determinations of bile secretion: effect of bile salt structure on bile flow and biliary cation secretion. Gastroenterology 1989;96: 1142–1150.
15 Maeyama T. Experimental cholestasis induced by _-naphthylisothiocyanate in rats—Relation to bile acid metabolism—. Kanzo 1977;18:645– 655 (in Japanese with English abstract).
16 Makino I, Shinozaki K, Nakagawa S, Mashimo K. Measurement of sulfated and nonsulfated bile acids in human serum and urine. J Lipid Res 1974;15:132–138.
17 Ogawa K, Suzuki H, Hirohashi T, Ishikawa T, Meier PJ, Hirose K, et al. Characterization of in-ducible nature of MRP3 in rat liver. Am J Physiol 2000;278:G438–G446.
18 Orsler DJ, Ahmed-Choudhury J, Chipman JK, Hamond T, Coleman R. ANIT-induced disruption of biliary function in rat hepatocyte couplets. Toxicol Sci 1999;47:203–210.
19 Oude Elferink RPJ, Ottenhoff R, van Wijland M, Frijters CMG, van Nieuwkerk C, Groen AK. Uncoupling of biliary phospholipid and cho-lesterol secretion in mice with reduced expres-sion of mdr2 P-glycoprotein. J Lipid Res 1996; 37:1065–1075.
20 Paulusma CC, Bosma PJ, Zaman GJR, Bakker CTM, Otter M, Scheffer GL, et al. Congenital jaundice in rats with a mutation in a multidrug re-sistance-associated protein gene. Science 1996;
271:1126–1128.
21 Paulusma CC, Kothe MJC, Bakker CTM, Bosma PJ, van Bokhoven I, van Marle J, et al. Zonal down-regulation and redistribution of the multi-drug resistance protein 2 during bile duct ligation in rat liver. Hepatology 2000;31:684–693. 22 Plaa GL, Priestly BG. Intrahepatic cholestasis
induced by drugs and chemicals. Pharmacol Rev 1976;28:207–273.
23 Rost D, Kartenbeck J, Kepple D. Changes in the localization of the rat canalicular conjugate ex-port pump Mrp2 in phalloidin-induced cholesta-sis. Hepatology 1999;29:814–821.
24 Sandberg DH, Sjövall J, Sjövall K, Turner DA. Measurement of human serum bile acids by gas-liquid chromatography. J Lipid Res 1965;6:182– 192.
25 Takita M, Ikawa S, Ogura Y. Effect of bile duct ligation on bile acid and cholesterol metabolism in rats. J Biochem 1988;103:778–786.
26 Uchida K, Kadowaki M, Miyake T. Failure of estrogen to produce a hyper-cholesterolemic ef-fect in immature rats. Endocrinology 1965;76: 766–770.
27 Uchida K, Nomura Y, Kadowaki M, Miyata K, Miyake T. Effects of estradiol, dietary cholester-ol and l-thyroxine on biliary bile acid composi-tion and secretory rate, and on plasma, liver and bile cholesterol levels in rats. Endocrinol Japon 1970;17:107–121.
28 Uchida K, Nomura Y, Kadowaki M, Takeuchi N, Yamamura Y. Effect of dietary cholesterol on cholesterol and bile acid metabolism in rats. Jpn J Pharmacol 1977;27:193–204.
Received April 26, 2002; accepted May 17, 2002 Corresponding author: Prof. Kazuo Yamada