Eco-physiological study on reproduction of the
range-extengded sea urchin Heliocidaris
crassispina
著者
Feng Wengping
学位授与機関
Tohoku University
学位授与番号
11301甲第19316号
Eco-physiological study on reproduction
of the range-extended sea urchin
Heliocidaris crassispina
分布拡大したムラサキウニの再生産に
関する生理生態学的研究
Wenping FENG
封 文萍
Contents
Chapter I. Introduction ... 1
Background ... 1
Research history ... 3
Purpose ... 6
Chapter II. Gonad development and population structure ... 7
Purpose ... 7
Materials and methods ... 7
Results ... 9
Discussion ... 19
Chapter III. Reproductive cycle and nutrient accumulation ... 27
Purpose ... 27
Materials and methods ... 27
Results ... 30
Discussion ... 43
Chapter IV. Effect of temperature on early life stage ... 52
Purpose ... 52
Section 1. Feeding and behavior ... 52
Materials and methods ... 52
Results ... 57
Section 2. Early development ... 70
Materials and methods ... 70
Results ... 72
Discussion ... 73
Chapter V. Conclusion ... 82
Acknowledgements ... 84
1 Chapter I. Introduction
Background
The recent report of IPCC (Intergovernmental Panel on Climate Change) indicated that human activity will cause ocean warming to 1.5°C by 2030–2052 (IPCC, 2019). Despite the ocean have absorbed > 80% of the heat affecting the global climate system, increase in ocean temperature was three times slower than that in air temperatures over land (Sunday et al., 2012). And the marine organisms were more sensitive to increase in temperature than those of terrestrial species (Pörtner and Knust, 2007; Pörtner et al., 2014). Marine organisms respond to ocean warming in several ways. First, they can move (poleward extend) to new areas that become available within their thermal niche (Parmesan and Yohe, 2003; Ling et al., 2008; Poloczanska et al., 2013). Range extension may arise as a result of changes in the ecosystem structure and function of the newly extended habitat (Davis et al., 1998; Walther et al., 2002; Edwards and Richardson, 2004; Doney et al., 2012, Dawson et al., 2011) and give rise to potential threats to fisheries (Johnson et al., 2005). Second, they can adapt to climate change either via phenotypic plasticity or evolutionary changes. Phenotypic plasticity is often considered as the first response to environmental change (Munday et al., 2013; Gienapp et al., 2008), including morphological, physiological and behavioral plasticities. Evolutionary changes of marine organisms are extension of their in situ thermal niche throughout multiple generations caused by changing environment (Visser, 2008; Williams et al., 2008). Third, marine organisms can experience range contractions where a modified climate exceeds their thermal niche, followed by death.
Sea urchin is ectothermic marine animal, of which distribution and reproduction (Agatsuma et al., 2007; Ling et al., 2008; Pecorino et al., 2013), physiology (Wolfe et al., 2013; Zhao et al., 2018) and behavior (Brothers and Mcclintock, 2015) changed along with the ocean warming. Agatsuma et al. (2007) reported that the range of
2
Hokkaido in the Sea of Japan after massive recruitment in 1989, 1990 and 1991 under high water temperatures during the larval period. The populations in the new habitats showed a fast growth rate and a defined gametogenic cycle with high gonad production in 1992 and 1993 (Agatsuma and Nakata, 2004). The range of Centrostephanus
rodgersii was extended to Tasmania (Johnson et al., 2005) in the last 50–60 years and
subsequently to New Zealand (Pecorino et al., 2013), due to the transport of surviving larvae (Andrew et al., 2001; Johnson et al., 2005) driven by the poleward advance of the East Australian Current (Ridgway et al., 2007). In its new habitats, C. rodgersii displays a strong seasonal cycle of gonad production and produces viable gametes (Ling et al., 2008). The gametes of the female and male can be produced synchronously (Pecorino et al., 2013). However, little is known about how range-extended species adjust to their new abiotic and biotic environments physiologically and ecologically by sex.
Heliocidaris crassispina has been intensively studied as Anthocidaris crassispina,
which is found in intertidal and subtidal zones in the Pacific coastal regions around Ibaraki, in the southern Sea of Japan around Akita, and southeastern China (Shigei, 1995). It is a common herbivore in the middle part of the Sea of Japan (Hayashi et al., 2000). High densities (0.8–21.6 ind./m2) of H. crassispina were found at a depth of 7
m in Wakasa Bay in Kyoto, Japan, where is the central distribution of H. crassispina in Japan (Tsuji et al., 1994). Mesocentrotus nudus is distributed in the Pacific Ocean in Rausu, from Sagami Bay to Erimo Cape, Hokkaido, and in the Sea of Japan from Omi Island, Yamaguchi, to Soya Cape, northern Hokkaido in Japan (Kawamura, 1993; Shigei, 1995).
Before 2014, H. crassispina was rarely distributed in southwestern Oga Peninsula in Japan (Nakabayashi, pers. commun.). The range extension in Toga Bay, Oga Peninsula, Akita Prefecture in northeastern Honshu, Japan was first observed in 2014 (Nakabayashi, 2016). Thereafter, H. crassispina distributed all around Akita and also in Aomori Prefectures in the Sea of Japan and along the Tsugaru Strait in 2015 (Nakabayashi et al., 2016; Kirihara and Fujikawa, 2018). On the other hand, M. nudus,
3
which was predominant until a couple of years ago, disappeared in shallow waters in Toga Bay along the Oga Peninsula (Mizuno and Eguchi, 2015; Ito, 2014), possibly due to their movement to the deeper waters or death at high water temperatures in summer (Tsuji et al., 1994) before 2014.
Research history
Marine organisms primarily respond to ocean warming by shifting their reproductive phenology and showing a prolonged period of reproduction (Parmesan and Yohe, 2003; Edwards and Richardson, 2004; Poloczanska et al., 2016). Such warming-induced shifts in reproduction might impact the population dynamics and demography of organisms (Edwards and Richardson, 2004; Poloczanska et al., 2016). The reproductive biology of H. crassispina has been studied since the 1960s (Kobayashi, 1969; Mori et al., 1980; Yoo et al., 1982; Sakairi et al., 1989; Yamasaki and Kiyomoto, 1993; Horii, 1997; Yatsuya and Nakahara, 2004; Urriago et al., 2016). The spawning of H. crassispina occurs synchronously between the sexes from August to September in Wakasa Bay (Yatsuya and Nakahara, 2004) and from July to August on Hirado Island, Nagasaki Prefecture, Japan (Yamasaki and Kiyomoto, 1993). In Japan,
H. crassispina is harvested around Kyoto in the Sea of Japan and around Wakasa Bay
in the Pacific Ocean, which is the center of its distribution (Tsuji et al., 1989). The evaluation of the reproductive strategies (Poorbagher et al., 2010, Kapsenberg et al., 2017) and population structure of range-extended sea urchins (Ling et al., 2009) would enable us to explain their adaptation to new environments at the margin of their range. In addition, comparison with sea urchins of the same species in the central range would contribute to a better understanding. However, no information on the reproduction and population structure of H. crassispina in newly extended habitat has been reported.
Sea urchins are ectothermic animals whose physiology (Wolfe et al., 2013; Zhao et al., 2018) and behavior (Brothers and Mcclintock, 2015) are negatively impacted by ocean warming. Physiological thermal tolerance limits of marine organisms play an important role in reflecting the distribution range shifts (Pörtner, 2001; Pörtner and
4
Knust, 2007) and the organism’s adaptation in response to the warming environment (Peck, 2005; Barnes and Peck, 2008). Many studies reveal that metabolic processes of sea urchins are governed by water temperature (McBride et al., 1997; Spirlet et al., 1998; Brockington and Clarke, 2001; Hochachka and Somero, 2002; Shipigel et al., 2004). Understanding the temperature impacts on H. crassispina and M. nudus physiologically and behaviorally are fundamental to figure out the reason of replacement of M. nudus by H. crassispina in Oga Peninsula and to assess their potential distribution (Ricciardi et al., 2000; Somero, 2005; Kearney and Porter, 2009).
Compounds rich in carbon (C) were primarily used to meet the demands of metabolism in invertebrates (Elendt, 1989), and nitrogen (N) also plays an important role in metabolism (Mayor et al., 2011; Zhu et al., 2016), growth and reproduction of invertebrate (Roman, 1983; Elendt, 1989). Most researches on the seasonal changes in protein (nitrogen) and carbohydrates (carbon) of gonad and gut in sea urchin from the point of view of nutrient level, which were correlated with reproduction and food availability (Moss and Lawrence et al., 1972; Fernandez, 1998; Montero-Torreiro and Garcia-Martinez, 2003; Rocha et al., 2019). However, little research treated the changes in C and N contents of gonad and gut as an indicator, to reflect the metabolism or adaptation of sea urchin under changing environment (e.g. temperature). Additionally, Giese et al. (1959) suggested that the seasonal variability of constituents of the gonad is a key factor in asynchronous spawning between the sexes in sea urchin.
Food consumption (feeding rate) as a phenotypic trait indicates the physiological and health conditions of marine organisms (Huntingford et al., 2010). It increased along with temperature increase (McBride et al., 1997; Douke and Hamanaka, 2001; Siikavuopio et al., 2006). A number of studies have shown that feeding regulation allow marine organisms to express an advantageous adaptation for performing successfully under changing environment (e.g. ocean warming or acidification) (Saba et al., 2012; Burnell et al., 2013; Nagelkerken and Munday, 2016), and that to have a greater ecological niche width (Sobero´n and Peterson, 2005; Helaouet and Beaugrand, 2009). If the feeding of sea urchin is less sensitive to temperature, showing a large optimal
5
temperature range, it would reflect the greater niche width and adaptability. Machiguchi et al. (1994) reported that food consumption of M. nudus decreased in winter at water temperatures of < 5°C. However, little is known on feeding of H. crassispina associated with changing temperature. In addition, comparison of the optimal temperature ranges of feeding rate between H. crassispina and M. nudus is essential to provide a clue on the replacement of the M. nudus by H. crassispina.
Righting response and Aristotle's lantern reflex reflect the phenotypic adjustments in behavior of sea urchin under the changing environment. Righting response coordinate sea urchins by the neuromuscular system, affecting the ability of the organism to survive from predators and strong surge (Kleitman, 1941; Percy, 1973). The Aristotle's lantern reflex is the ability of sea urchin to hold and to grind food (De Ridder and Lawrence, 1982). The elevated temperature suppresses the righting responses (Farmanfarmaian and Giese, 1963; Brothers and McClintock, 2015; Sherman, 2015) and lantern reflexes (Brothers and McClintock, 2015) of sea urchin. However, little study on the negative impact of low temperature on sea urchin behavior have been undertaken except for Farmanfarmaian and Giese (1963).
Recruitment of marine invertebrates is impacted by temperature (Pechenik, 1987; Hart and Scheibling, 1988; O’Connor et al., 2007). The hypothesis that thermal tolerance of planktonic propagules limits the geographical distribution of marine invertebrates is supported by the correlation between spawning temperature and successfully larval development (Andronikov, 1975; Fujisawa, 1990; Reitzel et al., 2005). Fujisawa and Shigei (1990) reported that the major spawning of H. crassispina occurred in summer at high water temperature of 17–29°C, and the increased temperature could increase the growth and development rate of embryos within the suitable temperature range (Fujisawa and Shigei,1990; Plamer, 1994; Ling et al., 2008; Pecorino et al., 2013). Understanding the temperature limits of H. crassispina from fertilization to larval development and juvenile are essential to figure out the adaptation and recruitment of H. crassispina in newly extended habitat.
6 Purpose
My study aims to figure out (1) the driver of the range extension, (2) temperature causing replacement of M. nudus by H. crassispina and (3) reproductive adaptation of the new extender. It is the first time to study on a new sea urchin population extended last decade.
In chapter II, the gonad development and population structure of H. crassispina between northern extended and central ranges were compared. In chapter III, the reproductive cycle and nutrient accumulation of H. crassispina in newly extended habitat were analyzed by annual changes in gonad development and C/N ratio of gonad, gut and gut content to confirm the delayed spermatogenesis and figure out the specific cause. In chapter IV, I explored the effect of temperature on early life stage of H.
crassispina: the feeding and behavior of juvenile (Section 1), fertilization to larvae and
their temperature limits (Section 2). In chapter V, I concluded the reproductive adaptation of H. crassispina in newly-extended habitat, and the range extension of H.
crassispina in future.
7 Chapter II. Gonad development and population structure
Purpose
This chapter aims to (1) figure out the driver of the range extension, (2) explore the differences in the gonad development in spawning season and population structure of
H. crassispina between extended (Toga Bay) and central ranges (Shitsumi).
Materials and methods
Sample collection
A total of 106 H. crassispina were haphazardly collected in August 2014 by scuba diving in a Sargassum siliquastrum bed at depths of 3–5 m in Toga Bay, along the Sea of Japan coast of the Oga Peninsula, Akita Prefecture, northeastern Japan (39°57´N, 139°42´E). Also, 100 H. crassispina individuals were randomly collected in August 2018 from a barren by scuba diving at a depth of 3 m off Shitsumi, Obama, Fukui Prefecture, Japan (35°31´N, 135°47´E). After collection, the sea urchins were transported to the Marine Plant Ecology Lab, Tohoku University, Sendai, Miyagi Prefecture, Japan.
We referred to the monthly average seawater temperature data measured at a depth of 2.4 m off the coast of Unosaki (39°51´N, 139°48´E) near Toga Bay over a 31-year period from 1984 to 2014 by the Akita Prefectural Institute of Fisheries. We also referred to the monthly average sea surface water temperature data measured off the coast of Miko and Ogawa near Shitsumi (35°36´N, 135°49´E) from January 1989 to March 2018 and from April to December 2018, respectively, by the Wakasa Mikata Fisheries Cooperative.
Measurement and age determination
We measured the test diameter (TD) and wet body weight (BW) of all sea urchins with a Vernier caliper (0.1 mm accuracy) and an electronic balance (0.1 g accuracy), respectively.
8
The apical systems of all individuals were dissected and preserved in a 10% formalin solution. Age was determined by counting the number of black bands formed in charred genital plates (Jensen, 1969), which is used as an age marker for H.
crassispina (Chiu, 1990), as its spawning occurs in July–August in Wakasa Bay, Kyoto,
near the sampling site (Tsuji et al., 1989).
Gonad indices and gonad development
The gonad wet weight (GW) (0.01 g accuracy) of all sea urchins was measured using an electronic balance, and the gonad index (GI) (GW × 100 / BW) was calculated.
To observe the gonads histologically, 65 individuals in Toga Bay and 95 individuals off Shitsumi were used, because the residual sea urchins have possibly undeveloped gonads and their gonads were too small to observe histologically. One of five gonads per individual sea urchin was preserved in 20% formalin. The dehydration, clearing and embedding of the gonads were conducted by standard methods for paraffin histology (Humason, 1979). Serial cross-sections (6 μm) were cut and stained with Mayer's hematoxylin and eosin. Gonad development was classified into six stages according to the changes in the relative abundance of germinal cells and nutritive phagocytes (NPs) (Byrne, 1990; King et al., 1994):
Stage I: Recovering stage, with small numbers of primary spermatocytes or previtellogenic oocytes along the acinal wall and NPs filling the lumen.
Stage II: Growing stage, with increasing numbers of spermatocytes or early vitellogenic oocytes along the acinar wall and NPs filling the lumen.
Stage III: Premature stage, with spermatozoa or ova at the center of the lumen and spermatocytes or vitellogenic oocytes along the acinar wall.
Stage IV: Mature stage, with spermatozoa or ova filling the lumen and spermatocytes and small numbers of vitellogenic oocytes along the acinal wall
Stage V: Partly spawned stage, with ova loosely packed and separated by spaces and spermatozoa less concentrated, with spaces in the lumen
Stage VI: Spent stage, with some relict spermatozoa or ova and empty spaces in the lumen.
Since there was a wide variation in the developmental stages of the acini in each individual gonad, the number of different gonad developmental stages per 10 acini of
9
an individual in Toga Bay and off Shitsumi were compared. The sex ratio in each habitat was calculated.
Gonad color
Gonad color was measured in 65 and 95 individuals in Toga Bay and off Shishimi, respectively. The gonads of residual sea urchins were too small for their measurement. The color meter (ZE-6000, Nippon Denshoku Industries Co. Ltd., Tokyo, Japan) was used that detects tristimulus values directly with flicker photometry using a 12 V, 20 W halogen lamp. Based on the Commission Internationale de I’Eclairage color measurement system (Robinson et al., 2002a), L* (lightness), a* (redness), and b* (yellowness) were measured. Three replicates of gonad measurements per individual were carried out. All biological traits of H. crassispina collected in Toga Bay and off Shitsumi were compared by sex.
Statistical analysis
The data were log-transformed and tested for assumptions of normality (Shapiro Wilk test) and homogeneity of variance (Levene’s test). The significant differences in the TD and BW of individuals among ages in Toga Bay and off Shitsumi were statistically analyzed by one-way ANOVA, followed by Tukey’s multiple comparison test. Significant differences in the number of different gonad developmental stages per 10 acini of an individual, the gonad index and gonad color (L*, a*, b*) between sexes and localities were analyzed with the t-test. The skew of the sex ratio and the significant differences in the composition of gonad development stages between the sexes off Shitsumi and between localities by sex were analyzed using the chi-square test. The statistical analysis was performed using SPSS 21.0 statistical software.
Results
Size, year class composition, and growth
10
shown in Fig. 1. The sea urchins largely exhibited TDs in the range of 40–54 mm off Shitsumi (Fig. 1a). In Toga Bay, the majority of individuals occurred within the 40–60 mm TD group, nearly the same as those off Shitsumi (Fig. 1b)
The individuals off Shitsumi consisted of successive 2012 to 2016 year classes. Most of the individuals fell within the 2013−2015 year classes, corresponding to 3−5 years of age, and the 2014 year class, corresponding to 4 years of age, was the largest (Fig. 2a). In addition, successive year-classes was also observed in Toga Bay, showing seven year-classes from 2006 to 2012. There was a consistent increase in the number of urchins from the 2006 year class to the 2010 year class. In particular, the year-classes of 2010 and 2009, which are coincident with 4 and 5 years of age, respectively, were largest. (Fig 2b).
The TD and BW of H. crassispina by age and sex off Shitsumi and Toga Bay are shown in Table 1 and 2, respectively. Off Shitsumi, the TD and BW of the male and sex-combined (total) groups differed significantly from 3−5 years of age (p < 0.05), with individuals at 3 years of age being significantly smaller than those at 5 years of age (p < 0.05). The TD came close to exceeding 50 mm at 5 years of age (Table 1). In Toga Bay, there were no significant differences between male and female urchins at 4– 7 years of age for either of these parameters (p > 0.05). For both sexes, there were significant differences in TD and BW among urchins from 4–7 years of age (p < 0.01). TD and BW of both sexes increased significantly between 4 and 5 years of age, with the exception of male BW. The TD of both sexes exceeded 50 mm at 5 years of age (Table 2).
Gonad development and sex ratio
The percentages of each gonadal development stage of H. crassispina by sex off Shitsumi and in Toga Bay are shown in Fig. 3. The composition of the gonad developmental stages differed significantly between the sexes off Shitsumi (χ2 = 93.223,
df = 5, p < 0.0001) and in Toga Bay (χ2 = 65.733, df = 4, p < 0.0001). Testicular
development varied greatly from the growing to the spent stages, among which the premature (31.8%) and mature stages (31.8%) were dominant. In contrast, ovaries were largely occupied by the partly spawned (51.0%) and spent stages (45.1%), indicating that testicular development was delayed. The composition of the testicular development
11
Fig. 1. Size-frequency distribution of Heliocidaris crassispina collected off Shitsumi (a) and in Toga Bay (b).
0 4 8 12 16 0 20 30 40 50 60 70 0 2 4 6 8 10 12 (b) N um be r of i ndi vi dua ls Test diameter (mm) (a)
12
Fig. 2. Year class composition of Heliocidaris crassispina collected off Shitsumi (a) and in Toga Bay (b). Roman numerals indicate ages.
2012 2013 2014 2015 2016 0 10 20 30 40 50 III II IV V VI 2006 2007 2008 2009 2010 2011 2012 0 5 10 15 20 25 30 V VI VII VIII IV III II Year-class N um be r of i ndi vi dua ls (a) (b)
13
Table 1. Test diameter (TD, mm) and body weight (BW, g) (means ± SD) of Heliocidaris crassispina collected off Shitsumi by age and sex.
Age ♀ ♂ Total N TD BW n TD BW n TD BW III 11 44.6 ± 8.1 35.7 ± 17.9 12 42.8 ± 7.2a 32.5 ± 12.5a 23 44.1 ± 7.7a 35.2 ± 15.8a IV 24 47.5 ± 9.1 49.5 ± 18.9 20 45.6 ± 8.5a 38.9 ± 16.3ab 44 46.6 ± 8.7ab 44.6 ± 18.1ab V 13 49.3 ± 10.0 46.9 ± 20.2 8 55.0 ± 9.5b 61.9 ± 25.1b 21 51.1 ± 9.6b 51.4 ± 22.1b F 0.796 2.033 5.43 4.265 4.422 5.508 Df 2 2 2 2 2 2 p 0.457 0.143 0.009 0.022 0.015 0.006
14
Table 2. Test diameter (TD, mm) and body weight (BW, g) (means ± SD) of female and male Heliocidaris crassispina (n = 65) collected in Toga Bay from III−VIII years of age.
♂ ♀ Total Age n TD BW N TD BW n TD BW III 1 32.6 14.3 1 35 15.3 2 33.3 ± 2.4 14.8 ± 0.7 IV 5 46.6 ± 2.3a 41.2 ± 6.2a 10 44.7 ±3.4a 37.6 ± 8.3a 15 45.3 ± 3.1a 38.8 ± 7.6a V 11 52.0 ± 2.4b 61.6 ± 11.4ab 10 51.5 ± 5.3b 57.7 ± 16.4b 21 51.8 ± 3.9b 59.8 ± 13.8b VI 4 55.4 ± 2.9bc 70.0 ± 16.3bc 10 53.5 ± 6.5b 65.5 ± 21.8b 14 54.1 ± 5.6bc 67.7 ± 19.8bc VII 3 58.0 ± 2.4c 89.1 ± 5.2c 6 57.7 ± 3.9b 78.0 ± 17.5b 9 57.8 ± 3.3c 81.7 ± 15.1c VIII 3 64.9 ± 7.0c 90.7 ± 11.3c 1 59.3 84.7 4 62.7 ± 7.3c 84.8 ± 14.8c F 16.576 12.654 9.636 11.365 18.112 20.872 Df 3 3 3 3 3 3 P 0.001 0.001 < 0.001 < 0.001 < 0.001 < 0.001
15
Fig. 3. Percentages of each gonad development stage of Heliocidaris crassispina by sex collected off Shitsumi and in Toga Bay.
0% 20% 40% 60% 80% 100%
Female Male Female Male Shitsumi Toga Bay
P er cen tag e ( % ) I II III IV V VI I II III IV V VI 100 80 60 40 20 0
16
stage differed significantly between localities (χ2 = 18.854, df = 4, p = 0.0008). The
testes were occupied by the premature stage (74.1%) in Toga Bay, indicating that testicular development in Toga Bay was more delayed than that off Shitsumi. The composition of the ovarian development stage differed significantly between Shitsumi and Toga Bay (χ2 = 11.191, df = 2, p = 0.0037). Off Shitsumi, 51.0% and 45.1% of
ovaries were occupied by the partly spawned and spent stages, respectively. However, in Toga Bay, ovaries developed to the growing (15.8%), partly spawned (36.8%) and spent stages (47.4%).
The number of different gonad developmental stages per 10 acini identified in individual sea urchins by sex off Shitsumi compared to that in Toga Bay is shown in Fig. 4. The number of different gonad developmental stages per 10 acini in the testis was markedly higher than that in the ovaries off Shitsumi and in Toga Bay (p < 0.05). In addition, the number in testis off Shitsumi was significantly lower than that in Toga Bay (p < 0.05).
The sea urchins collected off Shitsumi showed a sex ratio of 1:0.9 (51 females and 44 males). No significant skewing of the sex ratio was detected (χ2 = 1.032, df = 1, p =
0.310). Of the 65 sea urchins sampled in Toga Bay, 38 were female and 27 were male, indicating a sex ratio of 1:0.7, skewed toward females, although no significant difference between sex (χ2 = 3.723, df = 1, p = 0.054) was detected.
Gonad indices
The gonad indices (GI) of H. crassispina by sex off Shitsumi compared to those in Toga Bay are shown in Fig. 5. The GI was 4.1 in females and 3.6 in males off Shitsumi. No significant sexual difference was detected (p > 0.05). The GI of males off Shitsumi was significantly lower than that in Toga Bay (p < 0.05).
Gonad color
17
Fig. 4. Number of different gonad developmental stages (mean ± SE) per 10 acini of individual Heliocidaris crassispina by sex collected off Shitsum and in Toga Bay. Different large and small alphabetical letters indicate significant sexual differences (p < 0.05). An asterisk represents significant differences between localities (p < 0.05).
B A b a * 0 1 2 3 Female Male N um be r of di ff er ent g ona d d ev el o p m en tal s tag
18
Fig. 5. Gonad indices (mean ± SE) of Heliocidaris crassispina by sex collected off Shitsumi and in Toga Bay. Different small alphabetical letters indicate significantly sexual differences (p < 0.05). An asterisk represents significant differences between localities (p < 0.05). b a * 0 1 2 3 4 5 6 Female Male G ona d inde x ( % )
19
to that in Toga Bay by sex is shown in Fig. 6. In both sexes, L*, a* and b* showed significantly lower values off Shitsumi than in Toga Bay (p < 0.05), with the exception of a* in males. In contrast to the significant sexual differences in L*, a*, and b* found in Toga Bay, the L* and b* values did not differ between sexes off Shitsumi (p > 0.05), although the a* value of females was significantly higher than that of males (p < 0.05), as found in Toga Bay.
Seawater temperature
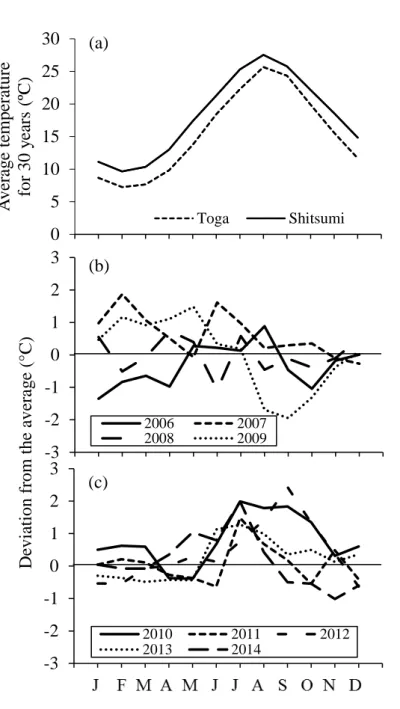
The monthly average seawater temperatures over 30 years off Miko (1989–2018) and Unosaki (1985–2014) and their deviations from the average values in 2018 and 2014, respectively, are shown in Fig. 7. The average seawater temperature off Miko ranged from 9.7–27.5°C, which was 2.6 ± 0.3°C higher than that off Unosaki (7.3– 25.7°C) on average in each month (Fig. 7a). The deviations in winter and spring (January–April) were higher than the average in 2007, 2009 (Fig. 7b), and lower than the average in 2006, 2012 and 2013. Deviations in the summer (July–September) were higher than the average in 2010, 2012 and 2013, and lower than the average in 2009 (Fig. 7c). In particular, sea surface temperatures from July to September 2010 and September 2012 were, 1.8–2.0°C (24.3–27.5°C) and 2.4°C (26.7°C) higher than the average, respectively. Higher water temperatures than the average in July and August continued during 2006–2014 (Fig. 7c).
Discussion
Population structure
Abiotic and biotic factors affect the spatial and temporal variations in the recruitment rates of sea urchin juveniles, which are correlated with the larval supply and settlement success (Balch et al., 2001). The occurrence of successive year classes of H. crassispina were 2012–2016 off Shitsumi and 2006–2012 in Toga Bay, indicated persistent juvenile recruitment. The age structure off Shitsumi mainly consisted of 3–5
20
Fig. 6. Gonad colors (L*, a*, b*) (mean ± SE) of Heliocidaris crassispina by sex collected off Shitsumi and in Toga Bay. Large and small alphabetical letters indicate significant sexual differences off Shitsumi and in Toga Bay, respectively (p < 0.05). Asterisks represent significant differences between localities (p < 0.05).
A B* b* a* a* a* b* 0 10 20 30 40 50 60 70
Female Male Female Male Female Male
L* a* b* C hr om at ic va lue
Shitsumi Toga Bay
b*
L* a*
21
Fig. 7. Monthly average seawater temperature for 30 years from 1989 to 2018 off Shitsumi and from 1985 to 2014 in Toga Bay (a), and the deviations from the average in Toga Bay from 2006 to 2014 (b and c).
0 5 10 15 20 25 30 J F M A M J J A S O N D A v er ag e t em p er at u re fo r 3 0 y ea rs ( ºC ) Toga Shitsumi -3 -2 -1 0 1 2 3 0 1 2 3 4 5 6 7 8 9 10 11 12 13 2006 2007 2008 2009 -3 -2 -1 0 1 2 3 0 1 2 3 4 5 6 7 8 9 10 11 12 13 2010 2011 2012 2013 2014 D ev iat io n f ro m t h e av er ag e (° C ) (b) (a) (c)
22
years old individuals and was almost coincident with that in new range in Toga Bay (3– 6 years). Although the sea urchins were collected in different years in the two localities, the similar age structures of H. crassispina may reflect persistent annual recruitment patterns under an absence of fishing pressure. To be noted, the 2010-year class was found to have the highest abundance of individuals in Toga Bay, which could be explained by the results of a long-term monitoring study, which indicated that typhoon disturbance increased juvenile recruitment of H. crassispina in this year, although the cause is uncertain (Kiyomoto, 2011). Typhoon No. 4, which had a central pressure of 994 hPa, landed in Akita City adjacent to the Oga Peninsula in August 2010 (Japanese Meteorological Agency, 2018) may have resulted in increased juvenile recruitment in Toga Bay.
In contrast to the lack of skewed sex ratios of H. crassispina collected off Shitsumi in the present study, a slightly skewed sex ratio toward females was found in the extended range of this species in Toga Bay. A sex ratio skewed toward females (1.6:1) has also been found in Centrostephanus rodgersii in an extended range in northern New Zealand (Pecorino et al., 2013), which might be attributable to a founder effect, indicating that the new population is structured with an unbalanced sex ratio (Fisher, 1930; Hamilton, 1967).
Reproduction
Off Shitsumi, while the ovaries almost completely occupied by the partly spawned and spent stages, the testes showed great variation from the growing to the spent stages. In addition, the markedly higher number of different gonad developmental stages per 10 acini in the testis than the in ovaries indicated that testicular development was delayed compared to ovarian development. Past studies have reported synchronous gametogenesis of H. crassispina between sexes in Wakasa Bay, Kyoto (Yatsuya and Nakahara, 2004), Hirado Island, Nagasaki (Yamasaki and Kiyomoto, 1993) and Hong Kong (Urriago et al., 2016) (Table 3). The delayed testicular development observed off Shitsumi is attributable to the low food availability in the barren (Guillou and Lumingas,
23
Table 3. Ecological information of Heliocidaris crassispina inhabited in different localities.
n.d.: no description
Population Dominant seaweed Latitude Longitude SST (ºC) References
Shitsumi, Fukui Barren 35°54' 135°81' 10–28 This study
Toga Bay, Akita Sargassum siliquastrum 39°57' 139°42' 8–26 This study
Kodomari, Kyoto Sargassum spp. 35°32' 135°31' n.d. Yatsuya and Nakahara (2004)
Corallina spp. 35°32' 135°31' n.d.
Hirado, Nagasaki n.d. 33°30' 129°43' 15–27 Yamasaki and Kiyomoto (1993)
Cape d’Aguilar, Hong Kong No erect macroalgae 22°20' 114°25' 17–28 Urriago et al., (2016)
Nine Pins, Hong Kong 22°26' 114°34' 17–28
24
1999) (Table 3).
In the new range of the urchins in Toga Bay, the testes of H. crassispina showed delayed development compared to the ovaries, and partially asynchronous spawning was observed between the sexes. The significantly greater percentage of the premature stage and lower percentage of the mature stage of the testes found in Toga Bay than in Shitsumi suggest more delayed testicular development of H. crassispina in Toga Bay than in Shitsumi. Additionally, ovarian development was slightly delayed in Toga Bay compared to that off Shitsumi. An increasing seawater temperature promotes gametogenesis and serves as an exogenous cue for gamete release by sea urchins (Byrne, 1990; Mercier and Hamel, 2009). The higher annual average seawater temperatures (2.6°C) off Shitsumi than in Toga Bay are associated with less delayed testicular development. Thus, male H. crassispina may be more vulnerable to lower nutrient uptake due to low food availability in the central range and to low water temperature in the extended range than females. Low food availability in the extended range may have a large negative impact on male reproduction.
Growth, gonad size and gonad color
Off Shitsumi, the growth of H. crassispina exceeding a 50 mm TD at 5 years of age is slow compared to that in Sargassum beds (~ 60 mm at 5 years) in Wakasa Bay, Japan, near Shitsumi (Yatsuya and Nakahara, 2004), possibly due to low food availability in barrens, as previously reported in other sea urchin species (Ebert, 1968; Minor and Scheibling, 1997; Meidel and Scheibling, 1999). In Toga Bay, H.
crassispina from S. siliquastrum beds also exceeds a 50 mm TD at 5 years of age,
suggesting that low temperature suppresses the growth of the urchins (Chang et al., 1999; Siikavuopio et al., 2008), possibly due to a decrease in food consumption and absorption associated with the low activity of digestive enzymes at low temperature (Klinger et al., 1986) in newly extended areas. Verifying the food availability and the effect of low temperature on the food intake of H. crassispina along the Oga Peninsula, and associated growth rates need to be undertaken.
25
No significant difference in the gonad indices of females was observed between the localities. In contrast, the lower gonad indices of males off Shitsumi than in Toga Bay reflect the obvious delay of testicular development in Toga Bay (premature stage) compared to that off Shitsumi (premature, mature and spent stages).
The significantly higher a* value and lower L* value observed in males of H.
crassispina off Shitsumi than in Toga Bay may be attributed to the release of sperm in
the testes off Shitsumi. For example, the testes of Strongylocentrotus droebachiensis show the highest concentrations of carotenoids at the post spawning stage, when the minimum gonad index is recorded (Hagen et al., 2008). Among carotenoid pigments, β-carotene in food is the major factor influencing gonad color associated with a* and b*
values (Griffiths and Perrott, 1976; Matsuno and Tsushima, 2001; Robinson et al., 2002b; Pearce et al., 2004; Agatsuma et al., 2005). The significantly lower L*, a* and
b* values of the ovaries of H. crassispina off Shitsumi compared to those in Toga Bay may be associated with the low β-carotene content of foods in the barren off Shitsumi (Pearce et al., 2004; Takagi et al., 2017), rather than the impact of reproduction (Borisovets et al., 2002; Hagen et al., 2008), because of the dominance of the partly spawned and spent stages in both localities.
Driver of the range extension
Range extensions in the distribution and abundance of marine organisms are directly driven by temperature (Fields et al., 1993; Allison et al., 2005; Agatsuma et al., 2007; Ling et al., 2008; Ling et al., 2009; Ling and Johnson, 2009; Pecorino et al., 2013). The average annual sea surface temperature in the central Sea of Japan has increased since 1999, with values that were higher than average recorded until 2014 (Japanese Meteorological Agency, 2018). In August 2010 and 2012, extremely high sea surface temperatures of 27.5°C and 27.1°C, respectively, were recorded in Oga. Tsuji et al. (1989, 1994) reported that H. crassispina and M. nudus were distributed at depths of < 4 m and > 4 m, respectively, on the west coast of Wakasa Bay, Kyoto, where high seawater temperatures over 28°C in the summer of 1994 caused a mass mortality
26
of M. nudus. As a result of this mass mortality, H. crassispina extended into the deeper regions previously inhabited by M. nudus (Tsuji et al., 1994). Based on the age composition data, H. crassispina extended its range into Toga Bay in 2006, when the summer (August) sea surface temperature was high. These high sea surface temperatures in July and August continued until 2017. Therefore, it is most likely that the range extension of H. crassispina from historic habitat was due to an increase in the sea surface temperatures, particularly in the summer.
Ling et al. (2008) reported that the poor development of C. rodgersii larvae at temperatures below 12°C indicated that this species had not undergone an adaptive shift to the cooler Tasmanian environment. In contrast, in northern New Zealand, the lower thermal threshold of the larvae was 16°C (Pecorino et al., 2013). In Tasmania, there was a strong pattern of decreasing sea urchin age and abundance with increasing distance from the historic range, being consistent with a model of range extension driven by a recent change in patterns of larval dispersal (Ling et al., 2009). In the current study, delayed testicular development suggest that the newly extended population maintain by recruits of larvae transported from southern population.
27 Chapter III. Reproductive cycle and nutrient accumulation
Purpose
In this chapter, I investigated the seasonal changes in gonad development in relation to temperature and the associated C and N contents of the gonad and gut and gut contents as indicators of the nutritional state of newly range-extended H.
crassispina by sex. I aim to (1) verify delayed spermatogenesis in relation to water
temperature and (2) identify its specific cause to (3) provide valuable information about the climate change biology of marine invertebrates.
Materials and methods
Sea urchin collection
Thirty adult H. crassispina with a > 40 mm test diameter (TD) were collected by scuba diving approximately monthly over 14 months from October 2016 to January 2018, except in November 2016 and January 2017, in a Sargassum siliquastrum bed at depths of 3−5 m in Toga Bay of the Sea of Japan along the coast of the Oga Peninsula, Akita Prefecture, northeastern Japan (39°57´N, 139°42´E). Then, the urchins were transported to the Marine Plant Ecology Lab of Tohoku University, Miyagi Prefecture, Japan.
We referred to monthly mean seawater temperature data measured over 33 years, from 1986 to 2018, at a depth of 2.4 m off the coast of Unosaki, Oga (39°51´N, 139°48´E), by the Akita Prefectural Institute of Fisheries.
Measurement and age determination
Sea urchin test diameter (TD) and body wet weight (BW) were measured using a Vernier caliper (0.1 mm accuracy) and an electronic balance (0.1 g accuracy).
The apical system of all sea urchins collected was dissected and preserved in 10% formalin solution. Their age was determined by counting the number of black bands
28
formed in charred genital plates (Jensen, 1969), which is used as an age marker in H.
crassispina (Chiu, 1990), and spawning occurred in September according to this study.
Body compartment indices
All H. crassispina specimens were dissected to collect the gonad, gut, gut contents, test and Aristotle’s lantern. The dry weights of each body compartment were measured using an electronic balance (1 mg accuracy) after drying in a hot-air convection oven at 80°C for one week. Each body compartment index was calculated as the percentage of the weight of each body compartment relative to the total body weight, from which the gonad dry weight was subtracted.
Gonad development
The gonads of all sea urchins were fixed and preserved in 20% formalin. Standard methods for paraffin histology were used (Humason, 1979). Paraffin sections of the gonad (6 μm cross-sections) were stained with Mayer's hematoxylin and eosin. Gonad development was classified into six stages according to the changes in the relative abundance of germinal cells and nutritive phagocytes (NPs) present in the gonad: Stage I: Recovery; Stage II: Growing; Stage III: Premature; Stage IV: Mature; Stage V: Partly spawned; Stage VI: Spent (Byrne, 1990; King et al., 1994)
As there was large variation in the developmental stages of acini in each gonad, the number of different gonad developmental stages in 10 acini per individual was counted by sex. The sex ratio of all collected sea urchins was calculated.
Carbon, nitrogen and ash contents
The dry gonad and gut tissues and gut contents (including inorganic matter such as shells and sand) were powdered with a Beads Cell Disrupter (Micro Smash MS-100). To exclude the adverse effect of inorganic matter on gut content, the ash content was measured (0.001 mg accuracy) with a balance after combusting the gut contents at 600°C for 6 h in a muffle furnace. The carbon (C) and nitrogen (N) contents of the
29
gonad and gut tissues and the gut contents and the ash content of the gut contents were analyzed by using an Auto NCS analysis Instrument (FLASH 2000, Thermo Fisher Scientific, Massachusetts, USA) with the calibration method. The C and N contents of the ash were subtracted from those of the gut contents. Finally, the C/N ratios of the gonad and gut tissues and gut contents were calculated.
Statistical analysis
The data were log-transformed and tested for assumptions of normality (Shapiro Wilk test) and homogeneity of variance (Levene’s test). Significant sexual differences in the number of different gonad developmental stages, body compartment indices, and the C/N ratios of the gonad and gut tissues and gut contents were tested with t tests. Significant differences in TD, BW, and the gonad, test and lantern indices by sex between months were analyzed by one-way ANOVA, followed by Tukey’s multiple comparison test. The gut and gut content indices, the number of different gonad developmental stages in 10 acini per individual, and the C/N ratios of the gonad and gut tissues and gut contents by sex between months were analyzed by the Kruskal-Wallis test, followed by the Steel-Dwass multiple comparison test. The significant skewing of the sex ratio and significant differences in age compositions between months were analyzed by using the chi-squared test.
To explore the influence of temperature on food intake and digestion, the correlations between the monthly average seawater temperatures and gut indices and gut content indices by sex during the present study were analyzed. And to explore the influence of temperature on delayed testicular development, the correlations between the monthly average seawater temperatures, gonad indices and gonad development stages by sex from February to August, when the gonads transitioned from the recovery stage to the spent stage, were analyzed. The correlations between the monthly average seawater temperatures and gonad indices, gut indices, gut content indices and gonad development stages by sex were analyzed by Spearman’s rank correlation. Here, gonad developmental stages I–VI were converted into 1–6. To explore the associations of C and N contents with the production of the gonad and gut by sex, the correlations
30
between the monthly average C/N ratios of the gonad and gut tissues and gut contents and the corresponding indices by sex during the present study were analyzed by Spearman’s rank correlation.
To explore the warming trend of seawater in Toga Bay, monthly average seawater temperature data from 1986–2018 were transformed by simple moving average (3 years) algorithm, significant changes in average temperature by month and year were analyzed by linear regression. Statistical analyses were performed using SPSS 21 and JMP 12.0 statistical software.
Results
Test diameter, body weight and age composition
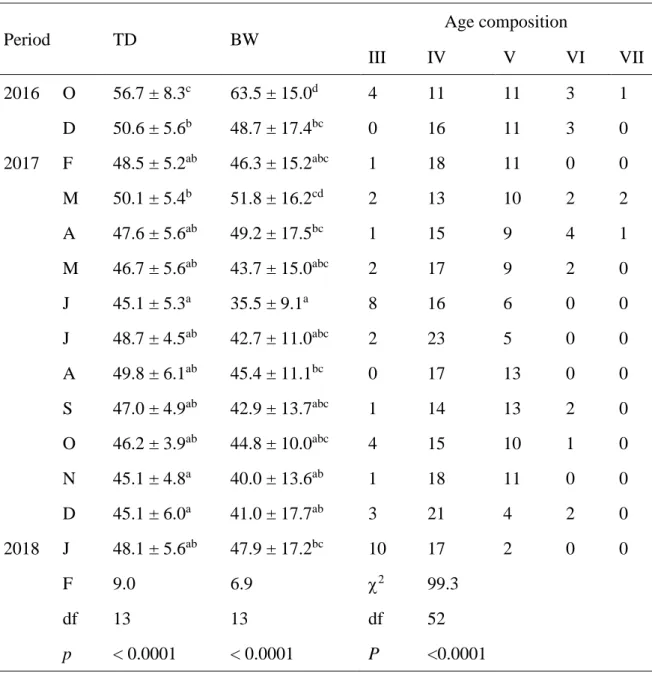
Test diameter (TD), body weight (BW) (mean ± SD) and age composition (III-VII) of Heliocidaris crassispina are shown in Table 1. There were significant differences in the TD and BW of H. crassispina between each month (p < 0.05). The average TD and BW ranged from 45.1–56.7 mm and 35.5–63.5 g, respectively. There was a significant difference in the age composition between months (p < 0.05). Most individuals were 4–5 years of age, except for the dominance of individuals of 3–4 years of age in January 2018.
Reproductive cycle
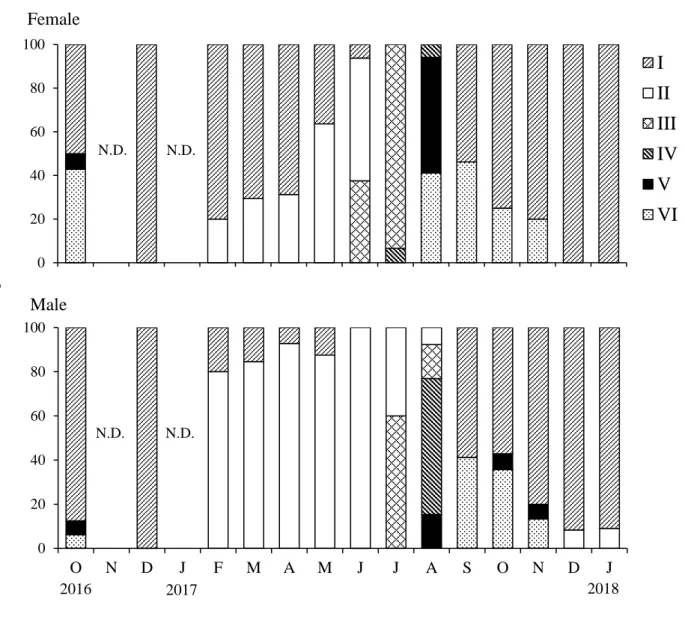
The monthly changes in the gonad developmental stages of H. crassispina by sex are shown in Fig. 1. In females, the gonads gradually transitioned from the recovery stage in December 2016 to the growing stage in May 2017. The premature stage was predominant in July, followed by the partly spawned and spent stages in August. Thereafter, the recovery stage increased and was predominant in December and January 2018. In males, the gonads rapidly transitioned from the recovery stage in December 2016 to the growing stage in February 2017, which predominated until June 2017. Then, the gonad transitioned to the premature stage in July and the mature stage in August,
31
Table 1. Test diameter (TD), body weight (BW) (mean ± SD) and age composition (III-VII) of Heliocidaris crassispina.
Period TD BW Age composition III IV V VI VII 2016 O 56.7 ± 8.3c 63.5 ± 15.0d 4 11 11 3 1 D 50.6 ± 5.6b 48.7 ± 17.4bc 0 16 11 3 0 2017 F 48.5 ± 5.2ab 46.3 ± 15.2abc 1 18 11 0 0 M 50.1 ± 5.4b 51.8 ± 16.2cd 2 13 10 2 2 A 47.6 ± 5.6ab 49.2 ± 17.5bc 1 15 9 4 1 M 46.7 ± 5.6ab 43.7 ± 15.0abc 2 17 9 2 0 J 45.1 ± 5.3a 35.5 ± 9.1a 8 16 6 0 0 J 48.7 ± 4.5ab 42.7 ± 11.0abc 2 23 5 0 0 A 49.8 ± 6.1ab 45.4 ± 11.1bc 0 17 13 0 0 S 47.0 ± 4.9ab 42.9 ± 13.7abc 1 14 13 2 0 O 46.2 ± 3.9ab 44.8 ± 10.0abc 4 15 10 1 0 N 45.1 ± 4.8a 40.0 ± 13.6ab 1 18 11 0 0 D 45.1 ± 6.0a 41.0 ± 17.7ab 3 21 4 2 0 2018 J 48.1 ± 5.6ab 47.9 ± 17.2bc 10 17 2 0 0 F 9.0 6.9 χ2 99.3 df 13 13 df 52 p < 0.0001 < 0.0001 P <0.0001 Lowercase letters indicate significant differences between months.
32
Fig. 1. Monthly changes in the gonad developmental stages of Heliocidaris crassispina by sex in Toga Bay along the Oga Peninsula. N.D. indicates no data. Legends indicate gonad developmental stages (Stage I: Recovery; Stage II: Growing; Stage III: Premature; Stage IV: Mature; Stage V: Partly spawned; Stage VI: Spent). Letters from O to J of X axes indicate months.
0 20 40 60 80 100 O N D J F M A M J J A S O N D J Month Female I II III IV V VI 0 20 40 60 80 100 O N D J F M A M J J A S O N D J Male P er cen ta g e ( % ) 2016 2017 2018 N.D. N.D. N.D. N.D.
33
followed by the spent stage in September and October, when the recovery stage increased, and this stage predominated in December and January 2018. The gametogenic cycle of both sexes of sea urchin was annual with a single spawning. However, the males showed delayed maturation and spawning during June–August regardless of the predominance of the growing stage during February–May compared to the high percentage of the recovery stage during February–April in females.
A significant positive correlation was detected between the monthly average seawater temperatures and gonadal developmental stages in both sexes of H.
crassispina from February to August (Table 2).
Consistency of gonad developmental stages and sex ratios
The average numbers of different gonad developmental stages among 10 acini in an H. crassispina individual are shown in Fig. 2. Significant differences were detected between months (p < 0.05) (Table 3). In females, the number of different gonad developmental stages greatly increased from 1.20 in February to 1.81 in June 2017 (p < 0.05), when the number was significantly greater than that in males (p < 0.05), then significantly decreased from August to January 2018 (p < 0.05). In males, the number of gonad developmental stages was 1.87 in July and 2.31 in August, when the numbers were much greater than those in females (p < 0.05).
The sex ratio was 1.27:1 (235 females and 185 males), being obviously skewed toward females (χ2 = 11.905, df = 1, p = 0.001).
Gonad, gut, gut content, test and lantern indices
The monthly changes in the gonad, gut, gut content, test and lantern indices of H.
crassispina by sex are shown in Fig. 3. Significant differences in each index were
detected between months (Table 3). In males, the gonad indices peaked in July (3.2) and sharply decreased to a minimum in September (p < 0.05). In females, the gonad
34
Table 2. Spearman’s rank correlations between monthly average seawater temperatures and the gonad developmental stages and gonad indices of Heliocidaris crassispina by sex during February–August and the gut indices and gut content indices by sex recorded during the present study.
Sex n rs p
Gonad developmental stage ♀ 7 1 <0.001
♂ 7 0.929 0.003
Gonad index ♀ 7 –0.036 0.939
♂ 7 0.0714 0.071
Gut index ♀ 14 –0.662 0.01
♂ 14 –0.767 0.001
Gut content index ♀ 14 –0.103 0.725
35
Table 3. Results of one-way ANOVA and Kruskal-Wallis tests of the biological traits of
Heliocidaris crassispina by sex between months.
One-way ANOVA Sex F df p
Gonad index ♀ 5.2 13 <0.001 ♂ 8.2 13 <0.001 Test index ♀ 3.7 13 <0.0001 ♂ 2.8 13 <0.01 Lantern index ♀ 2.7 13 <0.01 ♂ 3.4 13 <0.001
Kruskal-Wallis test Sex χ2 df p
Number of gonad developmental stages ♀ 44.7 13 <0.0001 ♂ 54.8 13 <0.0001 Gut index ♀ 105.5 13 <0.0001 ♂ 84.2 13 <0.0001
Gut content index ♀ 167.2 13 <0.0001
♂ 139.1 13 <0.0001 C/N of gonads ♀ 118.5 13 <0.0001 ♂ 98.4 13 <0.0001 C/N of gut ♀ 122.6 13 <0.0001 ♂ 106.4 13 <0.0001 C/N of gut contents ♀ 141.5 13 <0.0001 ♂ 98.8 13 <0.0001 C contents of gonad ♀ 52.1 13 <0.0001 ♂ 53.6 13 <0.0001 N contents of gonad ♀ 119.9 13 <0.0001 ♂ 96.4 13 <0.0001
36
Fig. 2. Number of different gonad developmental stages per 10 acini in individual
Heliocidaris crassispina by sex (mean ± SE). N.D. indicates no data. Letters from O to
J of X axes indicate months. Upper- and lowercase letters indicate significant differences in males and females between months. Asterisks indicate sexual differences.
ab ab ab ab ab ab c* ab b ab ab ab ab a AB A AB A AB AB A B* B* AB AB AB A AB 3 2 1 0 1 2 3 O N D J F M A M J J A S O N D J N o. of g ona da l de ve lopm ent al s ta g e Female Male N.D. 2016 2017 2018 N.D.
37
Fig. 3. Monthly changes in the gonad (a), gut (b), gut content (c), test (d) and lantern (e) indices of Heliocidaris crassispina by sex (means ± SD). Letters from O to J of X axes indicate months. Upper- and lowercase letters indicate significant differences in male and female gonads, respectively, between months (p < 0.05).
abc abcd cd abcd abcd d cd bcd bcd a a ab ab abcd ABCD ABCD D CD BCD D D D D A AB AB ABC ABCD 0 1 2 3 4 O N D J F M A M J J A S O N D J G ona d i nde x Female Male (a) A
ABC ABC ABC ABC
ABC ABC ABC
ABC AB AB BC C C a ab ab ab b ab ab ab a a a ab ab b 0 1 2 O N D J F M A M J J A S O N D J G ut i nde x Month DE CD BC B B BC D A A DE CD E DE CD def ef bcd bcd bcd bcd ef a a de def f ef cde 0 2 4 6 O D F M A M J J A S O N D J G ut c ont er nt i nde x c abc ab abc a ab ab ab abc abc bc ab ab ab B AB AB AB AB A A A AB AB AB AB AB AB 92 93 94 95 O N D J F M A M J J A S O N D J T es t i n d ex Month a ab ab ab b b b b ab ab ab ab ab ab A A ABC ABC AB BC C ABC ABC ABC ABC ABC ABC AB 3 4 5 6 O N D J F M A M J J A S O N D J L ant er n i nde x (c) (d) (e) (b) 2016 2017 2018
38
indices peaked in May (2.8) and were low compared to those in males during June– August, sharply decreasing from August to September (p < 0.05) (Fig. 3a).
The gut indices of both sexes increased from October 2016 to February 2017 and then decreased until August, after which they greatly increased from October to
December or January in 2018 (p < 0.05). The gut indices of females were slightly higher than those of males from February to July (Fig. 3b).
The gut content indices of males and females decreased sharply from October or December 2016, respectively, to February 2017 (p < 0.05). In both sexes, the gut content indices significantly increased from May to June (p < 0.05), followed by a dramatic decrease to the lowest values in July and August (p <0.05), and they then greatly increased to peak in November (p < 0.05). Thus, the gut content indices showed a defined seasonal change (Fig. 3c).
The test indices were > 93 year-round. The range was less than 2. The test indices sharply decreased from October 2016 to May in males and February 2017 in females (p < 0.05) and then stagnated until July. In females, the indices significantly increased from April to October (p < 0.05) (Fig. 3d). The lantern indices significantly increased from October 2016 to May 2017 in males (p < 0.05) and to April 2017 in females (p < 0.05). In males, the indices decreased greatly from June 2017 to January 2018 (p < 0.05) (Fig. 3e). Thus, the seasonal test and lantern indices showed a roughly converse relationship.
There were no sex differences in the gonad, gut, gut content, test and lantern indices (p > 0.05). There was a significant negative correlation between the monthly average of temperatures and gut indices in both sexes (p < 0.05). The gonad and gut content indices of the two sexes were not significantly correlated with the average temperatures (p > 0.05) (Table 2).
C, N and C/N ratios of gonad and gut tissues and gut contents
39
Fig. 4. Seasonal changes in the C/N ratios of the gonad (a), gut (b) and gut contents (c) of Heliocidaris crassispina by sex (means ± SE). Letters from O to J of X axes indicate months. Upper- and lowercase letters indicate significant differences in male and female gonads, respectively, between months. Asterisks indicate sexual differences (p < 0.05). abcd abc ab* ab a a a* a* ab* d bcd bcd cd cd BCD BCD
ABC ABC ABC ABC A A AB D BCD CD D CD 4 6 8 10 12 14 O N D J F M A M J J A S O N D J Female Male Gonad (a) e cde bc ab bc c a abc cde abc cd de e e C D ABC AB AB BC A ABC C A C C C C 3 4 5 6 7 8 O N D J F M A M J J A S O N D J C /N Gut (b) cd cd ab ab abc a bc bcd cd abc cd de e de CD BCD AB* A A A ABC ABCD BCD* ABC BCD D D D 5 10 15 20 25 O N D J F M A M J J A S O N D J Gut content (c) 2016 2017 2018
40
and the gut contents between months (Table 3). The C/N ratios of the gonads of both sexes dramatically increased from June to September 2017 (p < 0.05). From February to October, the C/N ratios of females were higher than those of males, and significant differences were detected in February, June, July and August (p < 0.05) (Fig. 4a). The C/N ratios of the guts of both sexes stagnated from February to May. After a significant decrease in June, they significantly increased through August (p < 0.05), followed by gradual increases through January 2018, with a significant decrease being observed in males in September (p < 0.05) (Fig. 4b).
The C/N ratios of the gut contents of both sexes significantly decreased from October 2016 to February 2017 (p < 0.05), stagnated until May, and then increased through December (p < 0.05). The C/N ratios of the gut contents of males were markedly higher than those of females in February and August (p < 0.05) (Fig. 4c).
Seasonal changes in C and N contents were evident in gonad of female and male
H. crassispina (Fig. 5a). The C contents of gonad in both sexes roughly decreased from
February to June 2017, then increased gradually during the rest period (p < 0.05). C contents of ovary were significantly higher than those of testis during May–August (p < 0.05) (Fig. 5a). N contents of gonad in both sexes increased gradually and peaked in June 2017, when gametogenesis was initiated, then sharply decreased to the minimum in spawning during July–September 2017 (p < 0.05), stagnated afterward (p < 0.05). There was no significantly sexual difference in N contents of gonad among months, except for July (Fig. 5b).
Correlations between C/N ratios of the gonad, gut and gut contents
Spearman’s rank correlations between monthly average C/N ratios of the gonad, gut and gut contents and the corresponding indices by sex are shown in Table 5. In both sexes, the C/N ratio of the gut content was positively correlated with the C/N ratios of the gonad and gut tissues (p < 0.05). However, no significant correlation was detected between the C/N ratios of the gonad and gut. There were negative correlations between
41
Fig. 5. Seasonal changes in the carbon (a) and nitrogen (b) contents of Heliocidaris
crassispina by sex (means ± SE). Letters from O to J of X axes indicate months. Upper-
and lowercase letters indicate significant differences in male and female gonads, respectively, between months. Asterisks indicate sexual differences (p < 0.05).
ab ab ab ab ab ab* ab* a ab* b ab ab ab b C B AB AB AB AB A AB AB AB AB B B B 35 40 45 50 55 O N D J F M A M J J A S O N D J Female Male (a) C ar bon ( m g /100m g ) abc bc bc bc bc c c c bc a ab ab a a AB BC BC BC BC BC C C* BC A AB AB A AB 4 5 6 7 8 9 O N D J F M A M J J A S O N D J (b) N it rog en ( m g /100m g ) 2016 2017 2018
42
Table 5. Spearman’s rank correlations between monthly average C/N ratios of the gonad, gut and gut contents and the corresponding indices by sex (n=14). Female Male Parameters (1) (2) (3) (4) (5) (1) (2) (3) (4) (5) (1) Gonad index (2) C/N of gonad –0.85** 0.56* –0.89** 0.68** 0.59* (3) Gut index (4) C/N of gut
(5) Gut content index –0.67**
(6) C/N of gut content –0.65* 0.58* 0.76** 0.60* 0.76**
**: p < 0.01, *: p < 0.05. Numerals indicate correlation coefficients, where bold font indicates positive correlations. The blanks indicate no significant correlation.
43
the gonad index and the C/N ratio of gonad in both sexes (p < 0.01). Additionally, the gut content index was negatively correlated with the gonad index in males (p < 0.01). The C/N ratio of the gut content was negatively correlated with the gonad index in females (p < 0.05). In males, the gut content index was positively correlated with the C/N ratio of the gonads.
Long-term temperature
Monthly and annual average seawater temperatures off Unosaki for 33 years from 1986 to 2018 are shown in Fig. 6. Significances of correlations by month and annual average among temperatures of 33 years are shown in Table 6. The monthly average seawater temperature increased from a minimum of 7.2°C in February to a maximum of 25.8°C in August (Fig. 6a). Significantly positive correlations were detected in annual average temperature and the averages from May to August (p < 0.01) (Fig. 6b, Table 6).
Discussion
Gonad development and sex ratio
Histological observations of the gonads of both sexes showed a gametogenic cycle with a single spawning, strongly suggesting that H. crassispina is capable of producing and releasing gametes in the newly extended area. The predominance of the growing stage in males during February–May and high percentages of the recovery stage in females during February–April indicate an increase in spermatocytes in testes, while there are few previtellogenic oocytes in the ovaries. This coincides with the development of the testes and ovaries of H. crassispina observed in the Sargassum area in the central range in Japan from March to May (Yatsuya and Nakahara, 2004); on Hirado Island, Nagasaki Prefecture, Japan, from October to February (Yamasaki and Kiyomoto, 1993); and in urchins reared at 15–20°C from April to May (Sakairi et al.,
44
Fig. 6. Monthly (a) and annual average (b) seawater temperature off Unosaki (39°51´N, 139°48´E) for 33 years from 1986 to 2018.
A v er ag e s ea w at er t em p er at u re ( °C ) 0 10 20 30 J F M A M J J A S O N D Month (a) 12 14 16 18 1985 1990 1995 2000 2005 2010 2015 2020 (b) Year
45
Table 6. Significances of correlations by month and annual average among temperatures of 33 years (1986–2018) off Unosaki (n = 33).
R P Annual avg. 0.531 0.002 Jan. 0.343 0.063 Feb. 0.044 0.817 Mar. 0.089 0.639 Apr. 0.332 0.073 May 0.706 <0.001 June 0.706 <0.001 July 0.856 <0.001 Aug. 0.636 <0.001 Sep. 0.102 0.591 Oct. 0.297 0.112 Nov. 0.324 0.081 Dec. 0.307 0.082
46
1989). Gametogenesis is a process requiring large amounts of nutrients such as proteins, lipids and carbohydrates (including polysaccharides) in sea urchins (Mita and Nakamura, 1993; Marsh and Watts, 2001). Unuma et al. (2003) analyzed the biochemical composition of gonads from the recovery to the mature stages in
Pseudocentrotus depressus. They found that the contents of total proteins, lipids and
polysaccharides in the testes were higher than those in the ovaries in the recovery to growing stages, suggesting that the testes accumulate greater amounts of nutrients and energy than the ovaries at the same gonad developmental stages. However, whether amounts of nutrients and energy required for the formation of previtellogenic oocytes are greater than those required by primary spermatocytes in sea urchins is unknown.
At the premature and mature stages, the lipid and protein contents of ovaries are greater than those of testes (McClintock and Pearse, 1987; Unuma et al., 2003). As females normally exhibit larger NPs than males, the ovaries must store more nutrients than the testis (Walker et al., 2001). Additionally, the greater reproductive output of females than males implies a high energy cost of spawning (Pérez et al., 2010). Therefore, the ovary exhibits a longer period of reproductive maturity to accumulate greater nutrient stores than the testis (Lawrence, 1987). However, the ovaries were in premature–mature stages during June–July in this study. Spawning occurred from July to September, mainly in August and September. In contrast, the testes were in the growing–mature stages from June to July and in the partially spawned stage from July to August, indicating that spermatogenesis is delayed one month compared to oogenesis. Spawning occurred mainly from August to September, when female spawning continued, indicating that spawning was partially synchronized between the sexes. This result suggests the possibility of reproductive success. Long-term spawning in males may be associated with sexual differences in spawning due to tidal fluctuations according to the lunar cycle (Pearse, 1975).
The sex ratio skewed toward females (1.27 females per male) coincides with the situation observed in C. rodgersii (1.6 females per male) in an extended locality in northern New Zealand in the last 50–60 years (Pecorino et al., 2013), indicating that
47
the newly range-extended species exhibit a population structure with an unbalanced sex ratio, possibly due to a founder effect (Fisher, 1930; Hamilton, 1967), which could be confirmed by comparing the genetic diversity of H. crassispina populations in historical and new habitats.
Influence of temperature on gonad and gut size
A gradual increase in the GIs of H. crassispina toward maturation and a defined decrease in spawning was found in both sexes. The GIs reached a peak in May in females, which occurred more rapidly than the August peak observed in males, reflecting the long recovery stage with NPs filling the lumen. The peak values of the GIs on a dry basis were 2.8 (4.9 on a wet basis) in females and 3.2 (6.1 on a wet basis) in males, which were lower than those of H. crassispina in Kodomari, Kyodo (Yatsuya and Nakahara, 2004), and Hirado, Kyushu (Yamasaki and Kiyomoto, 1993). Additionally, the peak GIs in Oga were nearly the same as those of H. crassispina inhabiting barren areas in Hong Kong (Urriago et al., 2016) (Table 7). Numerous studies have reported that high temperatures contribute to increases in the GIs of sea urchins (McBride et al., 1997; Spirlet et al., 2000; Siikavuopio et al., 2006; Bronstein et al., 2016). In this study, the annual sea surface temperatures in Toga Bay ranged from 8– 26ºC, which are markedly lower than temperatures of 15–27ºC in Hirado, Kyushu, and 17–28ºC in Hong Kong (Table 7). Therefore, the low GIs of H. crassispina might be attributable to the lower temperature in Toga Bay than in the other localities, although food availability was not analyzed in this study.
The gut acts as a short-term nutrient storage organ (Klinger et al., 1988; Lares and Pomory, 1998) whose capacity varies seasonally (Lawrence et al., 1966). Water temperature is a principal factor affecting food digestibility because it directly affects food intake and digestive enzyme activity (Klinger et al., 1986; Kofuji et al., 2005; Miegela et al., 2010). Klinger et al. (1986) reported that low temperature decreases the activity of digestive enzymes in sea urchins, resulting in low digestion and absorption.
48
Table 7. Maximum gonad indices (Max GI) of Heliocidaris crassispina and range of annual sea surface temperatures (SST) at different localities. Population Dominant seaweed Latitude Longitude Max. GI (wet) SST (ºC) References
Toga Bay, Oga Sargassum siliquastrum 39°57' 139°42' ≈6 8–26 This study
Kodomari, Kyoto Sargassum spp. 35°32' 135°31' 11.8 n.d. Yatsuya and Nakahara (2004)
Corallina spp. 35°32' 135°31' 9 n.d.
Hirado, Nagasaki n.d. 33°30' 129°43' ≈10 15–27 Yamasaki and Kiyomoto (1993)
Cape d’Aguilar, Hong Kong No erect macroalgae 22°20' 114°25' ≈5 17–28 Urriago et al., (2016)
Nine Pins, Hong Kong 22°26' 114°34' ≈6 17–28
Sheung Sze Wan, Hong Kong 22°31' 114°28' ≈4 17–28