電気学会論文誌●(●●●●●●●部門誌)
IEEJ Transactions on ●●●●●●●●●●●●●●● Vol.●● No.● pp.●-●● DOI: ●.●●/ieejeiss.●●.●
A Phase-plane Based Dynamic Coherency Real-time Identification
Scheme for Controlled Islanding
Songhao Yang
*Non-member,Masahide Hojo
**a)Member,Baohui Zhang
*Non-member(Manuscript received Aug.17, 2018, revised Sep.26, 2018)
Abstract: Controlled islanding often acts as the last resort against a severe blackout. Generator coherency is the primary constraint to determine an effective controlled islanding strategy. This paper proposes a scheme to identify the dynamic coherency of generators for controlled islanding. The generator coherency is identified based on the Phase-plane Trajectory Vectors (PTVs) on the Phase Plane for Generators (PPG). Then a Phase Plane for Buses (PPB) is proposed to assign the non-generator buses to coherent generator groups following the minimum distance principle. The separated islands are formed by disconnecting certain transmission lines according to the identified coherent generators and areas. The case studies in IEEE 39-bus 10-machine power system show that the proposed scheme can not only adapt to different disturbances and changes of system conditions and network topology but also succeed in identifying the generator coherency at different times and developing proper islanding strategy according to current system states.
Keywords: controlled islanding, generator coherency, phase plane, phase-plane trajectory vector (PTV), dynamic coherency identification
1. Introduction
Controlled islanding is often regarded as the last control measure to protect the power system from severe blackouts. It aims to prevent the spread of cascading events by intentionally separating the grid into several self-sustainable islands. Three critical issues need to be addressed regarding the controlled islanding: when to initiate the islanding (the start-up criterion), where to separate the grid (the islanding strategy) and how to maintain the stability of islands after the separation (islands adjustment). To solve the first problem, different out-of-step protection schemes have been proposed in [1-6]. Different start-up criterions, in fact, result in different start-up times of the controlled islanding, which bring great challenges for the islanding strategy development. An effective islanding strategy scheme should be able to cooperate with different start-up criterions and develop proper islanding strategy based on the system state at the start-up time.
Among all constraints in developing the islanding strategy, the generator coherency is the primary one to keep islands sustainable and stable [7-8]. Great efforts have been made to identify the generator coherency of the post-disturbance power system. These works can be summarized into two categories: the model-based methods and the measurement-based methods.
The model-based methods, mainly the slow-coherency methods[9-10], identify the generator coherency by the offline analysis based on the linear dynamic model of the power system at
the operation point. Ignoring the changes in system condition and topology, these model-based methods offer constant results of generator coherency under different disturbances, which is, however, inconsistent with practical cases.
The measurement-based methods identify the generator coherency based on hierarchical clustering method[11], independent component analysis[12-13], spectral clustering method[14-15], wavelet phase difference[16], robust principal component analysis[17], Koopman mode analysis[18], graph theory[19-20] and intelligent method[21-22]. These methods can adapt to various operation conditions, topology changes and different disturbances by using the real-time measurement data because all the influences of these factors are reflected in the transient response of the power system. However, these methods also have the limitations including 1) heavy computation burden, 2) longtime window of data and 3) inability to identify the dynamic coherency. Heavy computation burden is related to the enormous offline training and massive data processing. The longtime window of data is the guarantee of the sufficient analysis of the time-domain or frequency domain characteristics of generators coherency. The last but most important limitation is that these methods cannot identify the changes in generator coherency during the dynamic process. A promising method based on the frequency deviation signal was proposed to track the change of coherency time-evolution in [23]. However, a sufficient time window of measurement data is still required.
In this paper, we propose a dynamic coherency identification scheme for controlled islanding based on the phase plane for generators (PPG) and the phase plane for buses (PPB). The features of the proposed scheme can be summarized as 1) this scheme is self-adapted to different disturbances, topology changes, and various system conditions by using the real-time measurement data; 2) this scheme is simple and efficient because only two moments of data are required to determine the coherent generators a) Correspondence to: Masahide Hojo.
E-mail: [email protected] *
State Key Laboratory of Electrical Insulation and Power Equipment, Xi’an Jiaotong University, Xi’an, 710049, China **
Department of Electrical and Electronic Engineering, Tokushima University, 2-1 Minami-josanjima, Tokushima 770-8506, Japan
Paper
Dynamic Coherency Real-time Identification for Controlled Islanding (Songhao Yang et al.)
2 IEEJ Trans. ●●, Vol.●●, No.●, ●●●
and areas; 3) this scheme can identify the dynamic generator coherency according to the current system state so that it can cooperate with different start-up criterions. This paper is organized as follows. Section 2 gives the details of the phase-plane based dynamic coherency identification scheme and section 3 verifies its effectiveness. The conclusion is given in section 4.
2. Phase-plane based Dynamic Coherency Identification Scheme
The dynamic coherency identification scheme proposed in this paper consists of two parts: the identification of coherent generators and the determination of coherent electrical areas.
2.1 Identification of coherent generators For a
multi-machine power system, the i-th, and j-th generators are coherent in the time period of [t1, t2] if their angle satisfy (1).
12
[ , ]
max i j
t∈t t ∆ − ∆δ δ ≤ ε (1)
where ε is a small constant;∆ and δi ∆δj are the angle increments of the i-th and j-th generators. From (1), it is necessary to observe the power angle of generators for a period of time to identify the coherent generators. However, long-time observation is not allowed in practice because the controlled islanding requires a fast identification of coherent generator groups with the least measurement data. Thus, deeper state information of generators, rather than only the power angle, should be used to fully evaluate the motion status of generators. To this end, the phase trajectory vectors (PTVs) are applied to identify the dynamic coherency of generators in this paper.
For the i-th generator of the power system, its dynamic status at moment t can be represented by the phase point
(
δi( ),t ∆ωi( )t)
on the phase plane where the x-axis is the angleδ and the y-axis is the speed deviation∆ω. Thus, the vector starting from the point(
δi(t− ∆ ∆t), ωi(t− ∆t))
to the point(
δi( ),t ∆ωi( )t)
describes the motion of the i-th generator at time t. These vectors are called the Phase Trajectory Vectors (PTVs), which were first proposed in [24] and applied to identify the critical machines for transient stability assessment. As Fig. 1 shows, one PTV stands for one generator, respectively, and we can obtain N PTVs on the phase plane for anN-machine power system at each moment.
δ ω ∆ 1 1 ( (δ t− ∆ ∆t), ω(t− ∆t)) 2 2 (δ( ),t ∆ω( ))t 2 2 (δ(t− ∆ ∆t), ω(t− ∆t)) 1 1 ( ( ),δ t ∆ω( ))t 3 3 (δ(t− ∆ ∆t), ω(t− ∆t)) 3 3 (δ( ),t ∆ω( ))t PTV1 PTV2 PTV3 1( )t ϕ 2( )t ϕ 3( )t ϕ
Fig. 1 The Phase Trajectory Vectors on the phase plane Two features, the location and motion direction of the PTVs, are extracted to describe the dynamics of generators at time t. The standardized feature matrix is defined as (2).
1 1 1 1 2 2 2 2 s ( ) ( ) ( ) ( ) ( ) ( ) ( ) ( ) ( ) ( ) s s s s s s s s Ns Ns Ns Ns V t t t t t t V t t t t V δ ω ϕ δ ω ϕ δ ω ϕ ∆ ∆ = = ∆ A (2), where V tis( )
is the standardized feature vector of i-th PTV at time
t. In (2), the variables are defined as follows.
( ) ( ) ( ) ( ) , ( ) , ( ) ( ) / ( ) / i i i is is is i i t t t t t t t N t N δ ω ϕ δ ω ϕ δ ω π ∆ = ∆ = = ∆
∑
∑
(3),whereδi( )t and ∆ωi( )t are the angle and speed deviation of the i-th generator at time t, indicating the location of the PTV. ϕi( )t is the angle between the PTV and the positive x-axis at time t, representing the moving direction of the PTV. It is obtained by (4)
( ) arccos( i ) i i p e t p e ϕ = (4), where pi=( ( )δi t −δi(t− ∆ ∆t), ωi( )t − ∆ωi(t− ∆t)),e=(1,0) . The PTVs on the phase plane, in fact, show much more information about the generators dynamics beyond the power angle. The speed deviation, ∆ωi( )t , is the derivative of the power angle with respect to time, indicating the changing trend of power angle. And ϕi( )t predicts the motions of PTVs, indicating the changing trend of generators’ angle and speed. Thus, from the PTVs on the phase plane at time t, we can obtain the current status of generators, and even predict the future dynamics of generators. For coherent generators, the power angle increments should be similar over time. As a result, not only the angle but also the future motion of coherent generators should be similar during the given specific period. In another word, the PTVs should be similar at any time during this period if these generators are coherent. Thus, the PTVs at time t can be applied to identify coherent generators for the near period.
To identify the dynamic coherency with the aid of PTVs, we need to address two problems, that is, how to compare the similarity of PTVs correctly and how to determine the number of coherent groups. The hierarchical clustering method is adopted in this paper due to its high accuracy and no limits on cluster numbers. It consists of the following three steps:
Step 1: feature matrix formation. This step is to extract the
dynamic features of generators at time t into a matrix. The standardized feature matrix As(t) is given in (2).
Step 2: hierarchical cluster tree formation. In this step, the
Euclidean Distance is adopted to measure the distance from generator pair i to j, shown in (5).
2 ( is, js) is js
dist V V = V −V (5)
The cluster tree is formed step by step as follows.
a) Each generator is an independent cluster.
b) The clusters with the minimum distance are clustered into a
new cluster. For example, if the distance from cluster p to q is the minimum, then clusters p and q form a new cluster r.
c) The distances from other clusters to the new cluster is
re-calculated by the nearest neighbor:
( , ) min( ( ri, sj)), (1,... ),r (1,... )s
dist r s = dist x x i∈ n j∈ n (6)
In(6), nr is the number of generators in the new cluster r and xri
the other cluster s and xsj is the j-th generator in cluster s.
d) Return to b) and form a new cluster with the minimum distance
until all generators belong to one cluster.
e) Draw the dendrogram of the cluster tree.
Step 3: cluster number determination. This step is to determine
the number of coherent generator groups based on the cluster tree. A threshold, ds, is required to cut the cluster tree into groups.
Coherent groups are formed when a node and all its sub-nodes have inconsistent values less than the threshold value.
2.2 Association of non-generator buses To determine
the controlled islands, we need to assign the non-generator buses to corresponding coherent generators groups. A straight idea is to compute the electrical distances from non-generator buses to generator groups and assign them to the nearest generator groups. To compute the electrical distance, we need to put all buses in the same state space. The dynamics of generators are well expressed on the conventional phase plane; however, the non-generator buses cannot be represented as vectors on the PPG. To this end, we propose a special “phase plane” for all the buses where the x-axis is the voltage angle θ and the y-axis is the frequency f. These two state variables satisfy (7)[25].
0 1 ( ) ( ) ( ) 2 t t t f t f t θ θ π − − ∆ = ∆ (7),
where f is the system nominal frequency and0 θ is the voltage phase angle of buses. From (7), f is the derivative of θ on the phase plane for the buses (PPB), which is similar to the relation between ∆ω andδ on the phase plane for generators (PPG). In another word, the proposed PPB can also describe the dynamic behaviors of the power system, the same as PPG. Moreover, all buses can be drawn on the PPB, which can be used to determine the association of non-generator buses and coherent generator groups. To simplify the computation, we use the location information of buses on the PPB to determine the association of buses as follows.
step 1. Compute the centers of generator groups (CGGs). For
example, the center phase point,(θC p, ,fC p, ), of coherent generator group p is computed by(8).
, , , i i i p i p C p C p p p f f N N θ θ =
∑
∈ =∑
∈ (8),where θi,fi are the voltage angle and frequency of generator buses that belong to coherent group p, and Np is the number of
generator buses in this group. If there are m groups of coherent generators, we can obtain m CGGs in this step.
step 2. Standardize the state variables. To balance the weight of
variables on PPB, we apply a standardization to all non-generator buses and CGGs as (9) shows.
max max , s s f f f θ θ θ = = (9),
where θmax=max{θ θC,1, C,2,...,θC m, },fmax=max{fC,1,fC,2,...,fC m, } and m is the number of CGGs.
step 3. Compute the distance from non-generator buses to each
CGG. In this paper, the Euclidean distance is used to compare the electrical distance. For the non-generator bus i, the distance to CGG p is obtained by (10).
(
) (
2)
2 , , , s s s s i p i C p i C p d = θ −θ + f −f (10)It is noted that the distance from bus i to different CGGs should be computed, respectively. If there are m CGGs, the distances should be computed as di,1,di,2,...,di m, .
step 4. Assign the non-generator buses to the nearest CGG. The
non-generator bus i is assigned to the group q if it satisfies (11). , min{ ,1, ,2,..., , }
i q i i i m
d = d d d (11)
step 5. Repeat steps 3 and 4 until all non-generator buses have
already been assigned to corresponding coherent generator groups.
CGG 1
CGG 2 di,1 Bus i
Coherent Generators Center of Generator Groups θ
f
di,2
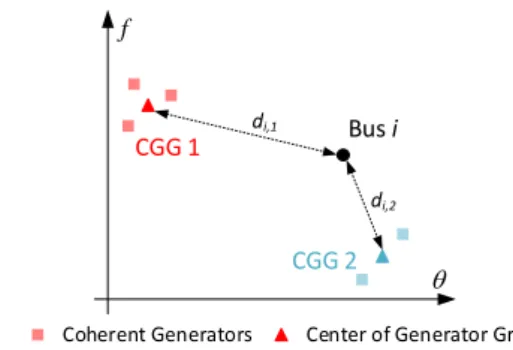
Fig. 2 The association of non-generator bus i and coherent generator groups on the phase plane for the buses (PPB) Fig. 2 explains the association of non-generator buses and coherent generator groups. For the given case in the figure, two groups of coherent generators have been identified by the PTV method. Thus, two CGGs are firstly computed by (8). After the standardization by (9), the distances from non-generator bus i to two CGGs are computed by (10) as di,1 and di,2, respectively. The
bus i is finally assigned to the group 2 because di,2 < di,1. The
assignment of non-generator buses is highly efficient because it only takes little computation, which facilitates the fast determination of controlled islanding strategy. Meanwhile, the principle of “minimum electrical distance” ensures that each island composed of coherent generators and associated non-generator buses is connected in topology, which is the guarantee of an effective controlled islanding strategy.
2.3 Flowchart of the proposed scheme
The flowchart of the proposed dynamic coherency identification scheme for controlled islanding is given in Fig. 3. There’re 5 steps in this scheme.
step 1. Initiate the scheme by the grid operator’s instructions or the preset start-up criterion.
step 2. Collect the data including the state variables for all generators and all buses from PMUs. The required data include the power angle and rotor speed of all generators and the voltage angle and frequency of all buses. If the start-up time is t, the data of t and t+Δt are required.
step 3. Identify the coherent generator groups with the PTV
methods proposed in section 2.1.
step 4. Assign the non-generator buses to the coherent
generator groups with the method proposed in section 2.2.
step 5. Intentionally disconnect certain transmission lines to form the separated islands based on the identified electrical areas.
Dynamic Coherency Real-time Identification for Controlled Islanding (Songhao Yang et al.)
4 IEEJ Trans. ●●, Vol.●●, No.●, ●●●
Start Controlled islanding start-up criterion Collect all required data Identify coherent generator groups Assign non-generator buses Form separated islands end
Fig. 3 Flowchart of the proposed scheme 3. Cases Study
The IEEE 39-bus 10-machine power system is selected to verify the effectiveness of the proposed scheme. The required data includes the power angle and rotor speed of all generators, and the frequency and voltage angle of all buses. These transient responses of the power system are simulated on the PSASP-a platform for power system transient simulation and analysis. In the simulation, the two-axis generator model is adopted, and each generator is equipped with the automatic voltage regulators (AVRs) and Power System Stabilizers (PSSs). The simulated data input the proposed scheme as the real-time measurement data from the PMUs. The sample time interval, Δt, is 0.01s and the value of ds
to cut off the cluster tree is 1.
As it is pointed out in section 2, the proposed scheme aims to determine the controlled islanding strategy after the controlled islanding is initiated. The controlled islanding is initiated by the grid operator’s instruction or preset start-up scheme. In this paper, an angle-threshold based start-up scheme is adopted as follows:
step:1 Collect required generators information from PMUs,
including the power angle and speed deviation of all generators at time t;
step:2 Search for the maximum angle δmax( )t and the
minimum angle δmin( )t at time t;
step:3 Compute the maximum angle difference ∆δmax( )t at time t by ∆δmax( )t =δmax( )t −δmin( )t ;
step:4 Compare ∆δmax( )t with the preset angle
threshold∆δset. If∆δmax( )t > ∆δset, controlled islanding strategy is
then started. Otherwise, return to step 1 and continuously detect the out-of-step of the power system according to the measurement information of the next moment.
To fully examine the effectiveness of the proposed scheme, we use two different angle thresholds to launch the controlled
islanding:
Start-up criterion 1: ∆δset= . π
Start-up criterion 2: ∆δset =2π.
Two cases are simulated for the verification. In each case, the proposed scheme will be tested twice because the scheme is initiated by two different criterions respectively.
3.1 Case 1
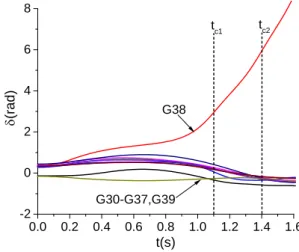
In case 1, a three-phase short-circuit ground fault occurs on line 27-28 at 0s and then the fault line is cleared at 0.2s. Generator angle curves of case 1 are given in Fig. 4, which indicate G38 is out-of-step relative to other generators. The controlled islanding is initiated at tc1 (1.1s) by criterion 1 and at tc2 (1.4s) by criterion 2
respectively, which correspond to scenario 1 and 2.
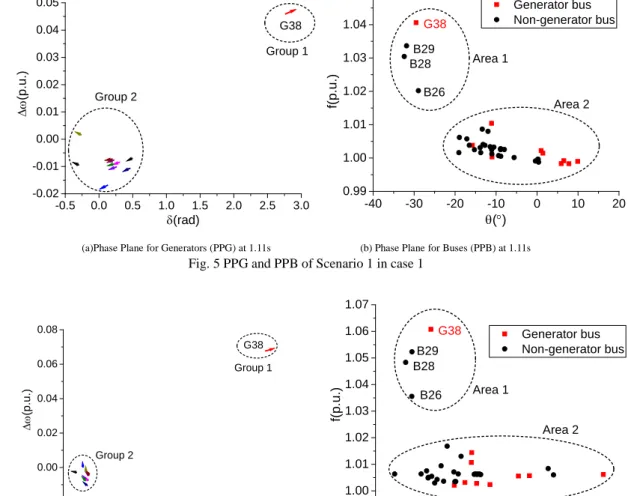
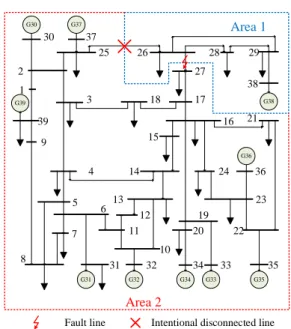
In scenario 1, after the controlled islanding is initiated at 1.1s, the scheme immediately collects the data of generators and buses at time 1.1s and 1.11s. The power angle and speed deviation of generators are used to form the PTVs on the phase plane for generators (PPG). Then the PTV-based method is applied to identify the coherent generator groups. The feature matrix of scenario 1 is given in Table 1, on which generators are identified into two coherent groups: {G38} and {G30-G37, G39}. The coherent generator groups are shown vividly on the PPG in Fig. 5 (a). Afterward, the phase plane for buses (PPB) is built in Fig. 5 (b) using the state variables of all buses at time 1.1s, and all non-generator buses are assigned to the coherent generator groups following the minimum distance principle. The identified coherent generators and areas of scenario 1 are given in Table 2. According to the results, the line 25-26 is disconnected intentionally to form the separated islands, as shown in Fig. 7. Only requiring the data of two sampling moments after start-up, the proposed scheme correctly identifies the coherent generator groups and immediately determines the controlled islanding strategy after the start-up.
For scenario 2, Fig. 6 (a) gives the PTVs on the PPG and Table 2 gives the feature matrix, on which the coherent generators are identified based. Same coherent generator groups are obtained. Then the PPB is built in Fig. 6 (b) to assign the non-generator buses. The final coherent generators and areas of scenario 2 are the same as that of scenario 1. Despite started at different moments in two scenarios, the controlled islanding strategy is same in case 1. 0.0 0.2 0.4 0.6 0.8 1.0 1.2 1.4 1.6 -2 0 2 4 6 8 G30-G37,G39 δ(rad) t(s) G38 tc1 tc2
Vol.●● No.● pp.●-●● DOI: ●.●●/ieejeiss.●●.● -0.5 0.0 0.5 1.0 1.5 2.0 2.5 3.0 -0.02 -0.01 0.00 0.01 0.02 0.03 0.04 0.05 Group 2 ∆ω (p. u. ) δ(rad) G38 Group 1 -40 -30 -20 -10 0 10 20 0.99 1.00 1.01 1.02 1.03 1.04 1.05 B26 B28 B29 Generator bus Non-generator bus f( p .u .) θ(°) G38 Area 1 Area 2
(a)Phase Plane for Generators (PPG) at 1.11s (b) Phase Plane for Buses (PPB) at 1.11s Fig. 5 PPG and PPB of Scenario 1 in case 1
-1 0 1 2 3 4 5 6 -0.02 0.00 0.02 0.04 0.06 0.08 Group 1 ∆ω (p. u. ) δ(rad) G38 Group 2 -30 -25 -20 -15 -10 -5 0 5 10 15 20 1.00 1.01 1.02 1.03 1.04 1.05 1.06 1.07 Area 2 B26 B28 B29 Generator bus Non-generator bus f( p .u .) θ(°) G38 Area 1
(a)Phase Plane for Generators (PPG) at 1.41s (b) Phase Plane for Buses (PPB) at 1.41s Fig. 6 PPG and PPB of Scenario 2 in Case 1
Table 1 Feature matrix As of Two Scenarios in Case 1
Gen. No. Scenario 1 Scenario 2 s δ Δωs φs δs Δωs φs G30 -0.6287 -0.71839 0.997249 -0.69291 -0.2498 0.998023 G31 0.351279 -5.70E-01 0.998446 -0.19353 -0.33822 0.992943 G32 0.400075 -0.60157 0.99765 -0.19738 -0.38508 0.994159 G33 0.460684 -0.8004 0.997245 -0.33258 -0.56191 0.99417 G34 0.854748 -0.84373 0.996915 -0.27795 -0.90054 0.995047 G35 0.444829 -0.70524 0.997247 -0.33686 -0.65121 0.995405 G36 0.562809 -0.66733 0.997089 -0.23784 -0.64502 0.995811 G37 0.181811 -1.33966 0.99578 -0.41996 0.0349 0.112423 G38 5.591963 3.627363 0.003429 7.001701 6.041884 0.001472 G39 -0.5231 1.26E-01 0.99 -0.3093 -0.19145 0.989821
Table 2 Coherent Generators and Areas of Two Scenarios in Case 1
Area Coherent Generators Associated Non-generator buses
1 38 26 28 29
2 30 31 32 33 34 35 36 37 39 1 2 3 4 5 6 7 8 9 10 11 12 13 14 15 16 17 18 19 20 21 22
© 200● The Institute of Electrical Engineers of Japan. 6
電気学会論文誌●(●●●●●●●部門誌)
IEEJ Transactions on ●●●●●●●●●●●●●●● Vol.●● No.● pp.●-●● DOI: ●.●●/ieejeiss.●●.●
G39 30 39 1 2 25 37 29 17 26 9 3 38 16 5 4 18 27 28 36 24 35 22 21 20 34 23 19 33 10 11 13 14 15 8 31 12 6 32 7 G30 G31 G37 G32 G34 G33 G35 G36 G38 Area 1 Area 2
Fault line Intentional disconnected line
Fig. 7 Areas Corresponding to Two Scenarios in Case 1
3.2 Case 2
In case 2, a three-phase short-circuit ground fault occurs on line 16-17 at 0s and then the fault line is cleared at 0.1s. Generator angle curves of case 2 are given in Fig. 8, which indicate the oscillation mode of the system is changing with time. In the early stage, group {G31-G36} is out-of-step relative to the rest generators. However, as time goes on, {G31, G32} departs from the previous group and becomes a new group. The controlled islanding is initiated at tc1 (1.06s) by criterion 1 and at tc2 (1.37s)
by criterion 2 respectively, which correspond to scenario 1 and 2. In scenario 1, the generators are identified into two groups at 1.07s as {G31-G36} and {G30, G37-G39} based on the PTVs on the PPG in Fig. 9 (a). Then the non-generator buses are assigned to corresponding coherent generator groups by the phase points on the PPB in Fig. 9 (b). The results of coherent generators and areas are given in Table 3. According to the results, line 3-4 and line 8-9 are disconnected intentionally to form separated islands, as shown in Fig. 11.
In scenario 2, the controlled islanding strategy is, however, different. According to the PTVs on the PPG in Fig. 10 (a), the
generators are identified into 3 groups: {G30, G37-G39}, {G31, G32} and {G33-G36}. Due to the changes in generator groups, the association of non-generator buses is also different from that in scenario 1. Based on the phase points of all buses on the PPB in Fig. 10 (b), the power system is separated into three areas. The results of coherent generators and areas are given in Table 4. Line 3-4, line 8-9 and line 14-15 are disconnected to form the separated islands, as shown in Fig. 12.
By the comparison of scenario 1 and 2 in case 2, it is demonstrated that the proposed scheme can correctly identify the dynamic coherency of generator groups. Due to the late start-up of controlled islanding in scenario 2, the oscillation is more severe than that in scenario 1, which leads to the change of coherent generators and areas. Based on the real-time measurement data, the proposed scheme tracks the change of generator coherency and develops a controlled islanding strategy that is most suitable for the current situation.
By the comparison of case 1 and 2, it is verified that the proposed scheme is adaptable to different disturbances and topology changes. Due to the difference in disturbances and the topology changes after the relay protection, the system shows different oscillation modes in these two cases. Independent on models and the information of fault and topology, the proposed scheme can develop different controlled islanding strategy for different cases. 0.0 0.3 0.6 0.9 1.2 1.5 1.8 -4 -2 0 2 4 6 8 10 12 G30,G37-G39 G33-G36 tc2 δ(rad) t(s) tc1 G31,G32
Fig. 8 Angle Curves of All Generators in Case 2
-1.0 -0.5 0.0 0.5 1.0 1.5 2.0 2.5 3.0 -0.02 -0.01 0.00 0.01 0.02 0.03 0.04 0.05 G37-G39 G30 G33-G36 Group 2 ∆ω (p. u. ) δ(rad) Group 1 G31,G32 -20 0 20 40 60 80 100 0.99 1.00 1.01 1.02 1.03 1.04 1.05 Area 1 Generator bus Non-generator bus G38 G37 G30 G39 G33-G36 f( p .u .) θ(°) G31,G32 Area 2
(a)Phase Plane for Generators (PPG) at 1.07s (b) Phase Plane for Buses(PPB) at 1.07s Fig. 9 PPG and PPB of Scenario 1 in case 2
-2 -1 0 1 2 3 4 5 -0.04 -0.02 0.00 0.02 0.04 0.06 0.08 Group 3 Group 2 Group 1 G37-G39 G30 G33-G36 ∆ω (p. u. ) δ(rad) G31,G32 -150 -110 -70 -30 10 50 0.98 1.00 1.02 1.04 1.06 1.08 Area 2 Area 3 G38 G39 G30,G37 G32 G31 Generator bus Non-generator bus f(p .u .) θ(°) G33-G36 Area 1
(a) Phase Plane for Generators (PPG) at 1.38s (b) Phase Plane for Buses(PPB) at 1.38s Fig. 10 PPG and PPB of Scenario 2 in case 2
Table 3 Coherent Generators and Areas of Scenario 1 in Case 2
Areas Coherent Generators Associated Non-generator buses
1 30 37 38 39 1 2 3 9 17 18 25 26 27 28 29
2 31 32 33 34 35 36 4 5 6 7 8 10 11 12 13 14 15 16 19 20 21 22 23 24
Table 4 Coherent Generators and Areas of Scenario 2 in Case 2
Areas Coherent Generators Associated Non-generator buses
1 30 37 38 39 1 2 3 9 17 18 25 26 27 28 29 2 33 34 35 36 15 16 19 20 21 22 23 24 3 31 32 4 5 6 7 8 10 11 12 13 14 G39 30 39 1 2 25 37 29 17 26 9 3 38 16 5 4 18 27 28 36 24 35 22 21 20 34 23 19 33 10 11 13 14 15 8 31 12 6 32 7 G30 G31 G37 G32 G34 G33 G35 G36 G38 Area 1 Area 2
Fault line Intentional disconnected line Fig. 11 Areas Corresponding to Scenario 1 in Case 2
G39 30 39 1 2 25 37 29 17 26 9 3 38 16 5 4 18 27 28 36 24 35 22 21 20 34 23 19 33 10 11 13 14 15 8 31 12 6 32 7 G30 G31 G37 G32 G34 G33 G35 G36 G38 Area 1 Area 2 Area 3
Fault line Intentional disconnected line
Fig. 12 Areas Corresponding to Scenario 2 in Case 2 4. Conclusion
In this paper, a dynamic coherency identification scheme is proposed for controlled islanding. Firstly, the generator coherency is identified by a PTV based method. The dynamics of generators are represented by the PTVs on the PPG and the hierarchical clustering method is applied to determine the coherent groups. Then a phase plane composed of bus voltage angle and frequency is built to assign the non-generator buses to the coherent groups.
According to the identified coherent generators and areas, certain transmission lines are disconnected intentionally to form the separated islands. The case studies in the test system show that the proposed scheme can identify the dynamic generator coherency and make proper islanding strategy according to current system states.
The proposed controlled islanding method requires the full-observability of the power system. In other words, the
Dynamic Coherency Real-time Identification for Controlled Islanding (Songhao Yang et al.)
8 IEEJ Trans. ●●, Vol.●●, No.●, ●●●
real-time state information of all generators and buses should be accessed accurately and timely to ensure the reliability of the proposed method. This assumption, however, is difficult to implement in the present power system. Study on the application of the proposed method in scenarios that PMUs information is incomplete or with noises is required in the future.
Besides, how to maintain the stability of the islands after the separation is also a research focus. The proposed scheme ensures the coherency of generators in each island, which is the guarantee of angle stability. However, the problems such as the frequency regulation caused by power imbalance remain unsolved, which will be one of our future work priorities.
References
(1) Mohammad Reza Salimian and Mohammad Reza Aghamohammadi,
"Intelligent Out of Step Predictor for Inter Area Oscillations Using Speed-Acceleration Criterion as a Time Matching for Controlled Islanding," IEEE Transaction on Smart Grid, vol.9, no.4, pp.2488-2497 (2018)
(2) Ghader Isazadeh, Amin Khodabakhshian and Eskandar Gholipour, "New
intelligent controlled islanding scheme in large interconnected power systems," IET Generation, Transmission & Distribution, vol.9, no.16, pp.2686-2696 (2015)
(3) Yinan Cui, Rajesh G. Kavasseri and Sukumar M. Brahma, "Dynamic State
Estimation Assisted Out-of-Step Detection for Generators Using Angular Difference," IEEE Transaction on Power Delivery, vol.32, no.3, pp.1441-1449 (2017)
(4) Evangelos Farantatos, Renke Huang, George J. Cokkinides and A. P.
Meliopoulos, "A Predictive Generator Out-of-Step Protection and Transient Stability Monitoring Scheme Enabled by a Distributed Dynamic State Estimator," IEEE Transaction on Power Delivery, vol.31, no.4, pp.1826-1835, (2016)
(5) B. Shrestha, R. Gokaraju and M. Sachdev, "Out-of-Step Protection Using
State-Plane Trajectories Analysis," IEEE Transaction on Power Delivery, vol.28, no.2, pp.1083-1093 (2013)
(6) Sumit Paudyal, Gokaraju Ramakrishna and Mohindar S. Sachdev,
"Application of Equal Area Criterion Conditions in the Time Domain for Out-of-Step Protection," IEEE Transaction on Power Delivery, vol.25, no.2, pp.600-609 (2010)
(7) Shaoxiang XU and Shihong MIAO, "Three-stage method for intentional
controlled islanding of power systems," Journal of Modern Power Systems and Clean Energy, vol.6, no.4, pp.691-700 (2018)
(8) A. Esmaeilian and M. Kezunovic, "Prevention of Power Grid Blackouts
Using Intentional Islanding Scheme," IEEE transactions on industry applications, vol.53, no.1, pp.622-629 (2017)
(9) Guangyue Xu and Vijay Vittal, "Slow coherency based cutset determination
algorithm for large power systems," IEEE Transactions on Power Systems, vol.25, no.2, pp.877-884 (2010)
(10) Haibo You, Vijay Vittal and Xiaoming Wang, "Slow coherency-based islanding," IEEE Transactions on Power Systems, vol.19, no.1, pp.483-491 (2004)
(11) Carlos Juarez, A. R. Messina, Rafael Castellanos and Gerardo Espinosa-Perez, "Characterization of Multimachine System Behavior Using a Hierarchical Trajectory Cluster Analysis," IEEE Transactions on Power Systems, vol.26, no.3, pp.972-981 (2011)
(12) M. A. M. Ariff and B. C. Pal, "Coherency Identification in Interconnected Power System—An Independent Component Analysis Approach," IEEE Transactions on Power Systems, vol.28, no.2, pp.1747-1755 (2013) (13) Tao Jiang, Hongjie Jia, Haoyu Yuan, Ning Zhou and Fangxing Li,
"Projection Pursuit: A General Methodology of Wide-Area Coherency Detection in Bulk Power Grid," IEEE Transactions on Power Systems, vol.31, no.4, pp.2776-2786 (2016)
(14) Lei Ding, Francisco M. Gonzalez-Longatt, Peter Wall and Vladimir Terzija, "Two-Step Spectral Clustering Controlled Islanding Algorithm," IEEE Transactions on Power Systems, vol.28, no.1, pp.75-84 (2013)
(15) Zhenzhi Lin, Fushuan Wen, Yi Ding and Yusheng Xue, "Data-Driven Coherency Identification for Generators Based on Spectral Clustering," IEEE Transactions on Industrial Informatics, vol.14, no.3, pp.1275-1285 (2018)
(16) S. Avdakovic, E. Becirovic, A. Nuhanovic and M. Kusljugic, "Generator Coherency Using the Wavelet Phase Difference Approach," IEEE Transactions on Power System, vol.29, no.1, pp.271-278 (2014)
(17) Xiangyun Qing, Shaobo Wang, Tinggang Jia and Yugang Niu, "Robust
principal component analysis-based coherency identification of generators with missing PMU measurements," IEEJ Transactions on Electrical and Electronic Engineering, vol.11, no.1, pp.36-42 (2016)
(18) Fredrik Raak, Yoshihiko Susuki and Takashi Hikihara, "Data-Driven Partitioning of Power Networks Via Koopman Mode Analysis," IEEE Transactions on Power Systems, vol.31, no.4, pp.2799-2808 (2016)
(19) Takayuki Ishizaki, Aranya Chakrabortty and Jun-Ichi Imura,
"Graph-Theoretic Analysis of Power Systems," Proceedings of the IEEE, vol.106, no.5, pp.931-952 (2018)
(20) Oscar Gomez and Mario A. Rios, "Real time identification of coherent groups for controlled islanding based on graph theory," IET Generation, Transmission & Distribution, vol.9, no.8, pp.748-758 (2015)
(21) Shahbaz A. Siddiqui, Kusum Verma, K. R. Niazi and Manoj Fozdar, "Real-Time Monitoring of Post-Fault Scenario for Determining Generator Coherency and Transient Stability Through ANN," IEEE Transactions on Industry Applications, vol.54, no.1, pp.685-692 (2018)
(22) R. Agrawal and D. Thukaram, "Support vector clustering-based direct coherency identification of generators in a multi-machine power system," IET Generation, Transmission & Distribution, vol.7, no.12, pp.1357-1366 (2013)
(23) Ahmed M. Khalil and Reza Iravani, "A Dynamic Coherency Identification Method Based on Frequency Deviation Signals," IEEE Transactions on Power System, vol.31, no.3, pp.1779-1787 (2016)
(24) Songhao Yang, Masahide Hojo and Baohui Zhang, "A phase ‐ plane trajectory vector‐based method for real‐time identification of critical machines," IEEJ Transactions on Electrical and Electronic Engineering, vol 13, no.11 (2018)
(25) Ahmed M. Khalil and Reza Iravani, "A Dynamic Coherency Identification Method Based on Frequency Deviation Signals," IEEE Transactions on Power Systems, vol.31, no.3, pp.1779-1787, 2016
Songhao Yang (Non-member) He received the Bachelor's Degree in electrical engineering from Xi’an Jiaotong University in 2012 and is presently pursuing his Ph. D. degree in electrical engineering, Xi’an Jiaotong University. Meanwhile, he is also pursuing his Ph. D. degree in engineering at Tokushima University. His research interests are power system transient stability assessment & control and optimal PMUs placement.
Masahide Hojo (Member) He received the Ph.D. degree in engineering from Osaka University in 1999 and is presently a professor at Tokushima University. His research interests are the advanced power system control by power electronics technologies and analysis of power systems.
Baohui Zhang (Non-member) He received the Ph.D. degree in electrical engineering from Xi’an Jiaotong University in 1988 and is presently a professor at Xi’an Jiaotong University. His research interests are system analysis, control, communication, and protection.