温度勾配をもつ湿った粒子層中の水の循環と蒸発・凝結係数
14
0
0
全文
(2) Journal of Hokkaido University of Education (Section II A) Vol. 25, No. 1 August 1974. iaW^^B^(^2g|5A)"^25^ ^\% TO149^8;3. Water Circulation and Evaporation-Condensation Coefficient in Wetted Granular Beds under a Temperature Gradient. Toshio HASEGAWA* and Nobuhiro SEKI** *Department of Physics, Asahikawa Branch, Hokkaido University of Education ^Department of Mechanical Engineering Second, Faculty of Engineering, Hokkaido University. ^*-M MSZ.**; S^^)@a^'fc^fi^fc^:?JB'+107j<®%^^i. ^imm^mmwm^m. *^mm^^w?r.w 2 ^ Distributions of temperature and moisture content, and heat flux in a steady state at closed wetted granular beds are measured by the experiments of a steady heat flow in vertical direction. A theoretical analysis of the circulation of water under temperature gradients, namely, evaporation, vapor diffusion, condensation and liquid water flow, are made using these experimental data. The results of this analysis agree well with the qualitative facts investigated by many investigators. In connection with these calculations, distributions of both apparent and true evaporation-condensation coef&cient in samples are also obtained. The values of the true one are the orders of 10-9—10-a.. Nomenclature A,; effective specific surface in sample (cm-l) d '• surface mean diameter of glass particles (cm) da '• surface mean diameter of air-filled pores (cm) Daim '• molecular diffusion coefficient of water vapor in air (cm2/s) Din,: isothermal vapor diffusivlty (cm2/s) Dsu: thermal vapor diffusivity (cm2/s°C) E: rate of evaporatlon and condensation (g/cm8s) ga: depolarisation factor of air-filled pore in the direction of one axis (—). h: relative humidity (—) H: enthalpy per unit mass of sample (cal/g) Ha: enthalpy per unit mass of water vapor (cal/g) Hu : enthalpy per unit mass of liquid water (cal/g) /;: apparent evaporation-condensation coefficient (s-l) ka: ratio of average temperature gradient in air-filled pores to corresponding quantity in liquid water (—).
(3) Water Circulation and Evaporation-Condensation CoefiBcient 49. kg : ratio of average temperature gradient in glass particles to corresponding quantity m liquid water (—). L: heat of vaporization (cal/g) M: molecular weight of water vapor (=18) (g/mol) p : partial pressure of water vapor (mmHg) P: total gas pressure (mmHg) q»: water vapor flux (g/cm2s). Qw: liquid water flux (g/cm2s) Q : heat flux (cal/cm2s) <3c'; heat flux due to conduction (cal/cm2s) Qa: heat flux due to water vapor diffusion (cal/cm2s) Qw: heat flux due to liquid water flow (cal/cm2s) R: gas constant per 1 mol (=8.314 xl07) (erg/deg mol). t: time (s) T: absolute temperature (°K). z: depth (cm) Zs '• depth at which water vapor saturates (cm) a: true evaporation-condensation coefficient (—) S : tortuosity factor for diffusion of gases in sample (—) e : porosity in dried state (—) Se: effective porosity (=e—y) (—) Sef : effective porosity at which funicular state begins (—) ^: ratio of average temperature gradient in air-filled pores to overall temperature gradient (—) ff : temperature (°C) <<a : thermal conductivity of air (cal/cm s°C) ^c: pure thermal conductivity of sample (cal/cm s°C) ^g : thermal conductivity of glass particle (cal/cm s°C) ^,u: thermal conductivity of liquid water (cal/cm s°C) v : mass-flow factor (—). p : density of sample (g/cm8) p,o: density of liquid water (g/cm8) a: density of water vapor (g/cm8) o-s: density of saturated water vapor (g/cm8) <p : volumetric moisture content (—) <pk •• volumetric moisture content at which funicular state begins (—) 1. Introduction It has been known that moisture movement in wetted porous materials occurs under the application of a temperature gradient. 0. Krischer and H. Rohnalter0 investigated the mechanism of this moisture movement in connection with the study on the thermal conductivity of wetted porous materials and they explained this movement qualitatively. They indicated the.
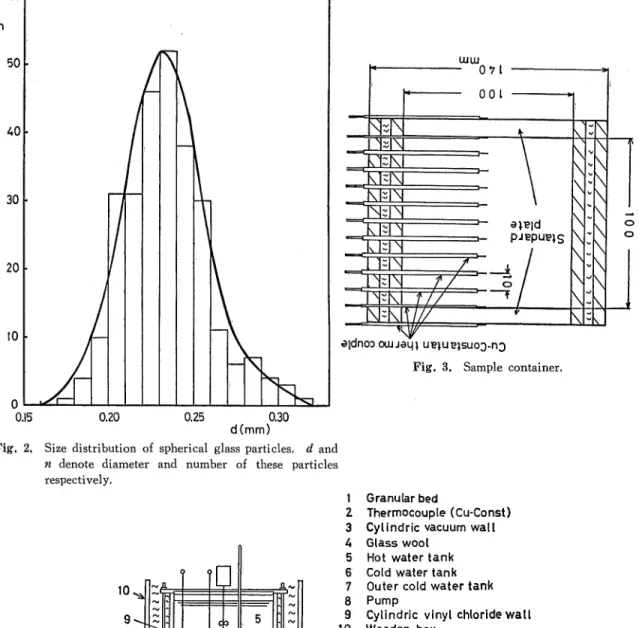
(4) so ' -' 1'''-- >^i\\w-m' -g^ .^>,-;:,»:.. -i.. fac1?jithat in this case evaporation "occursi-in :Ithe "higher tettiperature'part, the resulted water vapor. diffuses through the pores and condensates in the lower temperature part, and when moisture content in lower temperature part increases to a degree, liquid 'Water 'Stetfts':to the higher temperature part by capillarity, and again : Such .process ''reiterates, and '-finally a'dynamic equilibrium state of these opposing fluxes is achieved. . ; > " ' • '. After that, several investigators have made experimental Studies on this problem usins; radioactive tracers21 or NaCl solution85, and confirmed Krischer-Rohnalters deduction qualitatlvely.. However, no quantitative experimental and theoretical analyses 'havri been rdade up to the present. time.. /. Recently we made experiments of a steady heat flow in vertical direction at closed wetted granular bed consisting of spherical glass" particles, and measured distributions of temperature and volumetric moisture content, and heat flux in steady state. The process of water circulation was investigated in detail by the theoretical calculation using the above experimental data. Furthermore, distributions of an apparent evaporation-condensation coefficient and ,a true one. were also calculated. In this paper we describe these results.. 2. Experimental Apparatus and Procedures Spherical glass particles were used as samples. These were washed fully by water and were dried, and then were passed through sieves. The microphotograph of these particles is shown in Fig. 1. The diameter of these particles was about 0.23 mm. The size distribution curve is shown in Fig. 2. It was investigated by the method of microphotography. A sample container is shown in Fig. 3. It has a cylindrical form and double walls of vinyl chloride. Aluminum foil was pasted on both surfaces of the space between these walls, and glass wool was packed in the space. The lid and bottom of the sample container are glass standard plates which are about one cm thick. Thin copper plates were pasted on both surfaces of these standard plates to make the temperature of these surfaces uniform as far as possible. Thirteen Cu-Constantan thermocouples were used, four thermocouples were placed. on the surfaces of the standard plates, nine thermocouples were placed at intervals of 1.0 cm in. Fig. 1. Microphotograph of spherical glass particles (x 40)..
(5) 51. Water Circulation and Evaporation-Condensation Coefficient. U1UJ ~0-7l. OOt. ?N. k 1 ^l\. ^M 1JM.. ^L. "TT. ^i3^K. 0 0. a»B|d pJBpUStS. z:. Q.. TT. .—i.. T77-. N^M^ /// ~^.. \1~1. a|dno3 ouujaq) UBtUB)suo3-n3 Fig. 3. Sample container.. d(mm) Fig. 2. Size distribution of spherical glass particles, d and n denote diameter and number of these particles respectively,. I. 2 3 4 5. 6. 7. 8 9 10. Granular bed Thermocouple (Cu-Const) Cylindric vacuum wall Glass wool Hot water tank Cold water tank Outer cold water tank Pump. Cytindric vinyl chloridewatl. Wooden box. Fig. 4. Schematic diagram of experimental apparatus.. the sample container. The point of each thermocouple is on the center line of the container. An experimental apparatus is shown in Fig. 4. The main body of it has a cylindrical form and is mainly made of vinyl chloride. It consists of a hot water tank, a sample container.
(6) 52. fkww^'m. fs^. and its insulating part, and a cold water tank. The bottom of the hot water tank and the central part in the upper surface of the cold water tank are copper plate. The sample container is thermally insulated by a vacuum insulating cylinder and glass wool. The whole of the main body is 90 cm in height and 32 cm in diameter. It is bolted by upper and lower iron frames to keep the sample container in close contact with the two water tanks. Further, this body is placed in a wooden box whose inside measurement is 54 x 54 x 110 cm, and glass wool is packed closely between them. The waters in the hot water tank and the outer cold water tank are kept at constant temperatures of nearly 50°C and 40°C respectively using a heater with a temperature regulator, and a stirrer. The water at constant temperature is circulated by a centrifugal pump from the outer cold tank to the inner cold tank. Thus the temperatures at the upper and lower surfaces of the sample container are kept constant. The stability of water temperature in the hot and cold water tanks was less than ±0.02 C. The temperature measurements were carried out by using a DC potentiometer (the minimum scale is l;uV). The samples were packed uniformly in the containers using a vibrator. The porosity was 37.2%. After pouring distilled water fully into them and obtaining them at the proper moistuer condition by natural evaporation, they were used for the experiment. The heating time was 3-4 days. Sometimes the temperature distribution was measured in the course of heating. It became steady in about three days. The distribution of the volumetric moisture content was determined by weighing and drying small samples abstracted from nearby the point of each thermocouple immediately after the final measurement of temperature distribution. The heat flux in the samples was obtained from measurements of the heat flux in the two standard plates.. 3. Method of Theoretical Analysis As before, when a temperature gradient exists, the heat flow, vapor and liquid water flows occur in the granular bed. These flows are closely connected to each other. Simultaneous differential equations for the transfer of heat and moisture in granular materials have been derived by J. R. Philip and D. A. de Vries4'55, A. V. Luikov10, and others. One of us" derived also these equations by another method. They intrinsically agree with the equations derived by D. A. de Vries. These equations in vertical direction are expressed as follows.. 3W-_9Q. ~sT~~~Jz 9(e.e<J) _ _ Sq,. ~3T~~~9z. 9{pw<p) ^ Qq« ^ 9t 9z Eq. (1) is the equation of the^ heat transfer, Eqs. (2) and (3) are the equations of the vapor and liquid water movements. The heat flux Q is considered as the sum of heat fluxes due to conduction, flows of vapor and liquid water. Therefore it is given by the following expression.. Q=Qc+Q»+Q»=-^+H^+H^ (4).
(7) Water Circulation and Evaporation-Condensation Coefficient 53. where the following relation between H» and Hw holds.. H^H^+L. (5). The vapor flux q, is given by41. Q.=-D^. (6). As the density of water vapor is connected with the density of the saturated one by the relation a=has, Eq. (6) is expressed as follows.. 90 n Qh. QV= -PwL'eo'g^-PwL'lia-g-^. here. De^eDatmVhc^ / p,« (for y^^). (8). ^=e.(l+^)^,,,^C^y^ (for f^fk) D,,»= Dat,,, vSe^slpw. Datm for diffusion due to a temperature gradient is expressed by £>„(,„=. 4.42. xl0-<7p-. (10). Further, the mass-flow factor v is expressed by. p. v=T^p V^T^P. •. (11). The tortuosity factor 8 can be considered about 0.66 for s,<i 0.5. ^ is expressed by. id6\ (€\. , _ \dzla _ _\dzlg _ _ _!_. e ~ ."ldo\ ^,nld6\ ^n-^7d6\~ 7d0\ 7(w\. dz eea+y^,«+(l-e)^), .^iIL^_JIL s'+'P^a^+(i--^. w\'" ~"w\. \dz/a \dzla. where (-,-} , (-7-) , (-7-) are the temperature gradients averaged over the volumes occupied respectively by air-filled pore, water and solid particles.. /d0\ / ld6\ ,, /dt)\ /id0\. ^. are expressed as follows.. \dz)» 1 1. (13). 7dS\ ~7dS\ /7dff\ -^ \dzfa \dzla/ \dz/,v. (d6\ (dff^ /(d0^. Tzl, \Tzl, / \3zla. (14). ld0\ ld6\ / fdh. \dzl a \dzl w/ \dzl,n. The values of ka, kg will be given by formulas (29) and (30), which are shown later. The rate of evaporation-condensation E is given by85 E=ke^<J,-a)=kSeU,{l-h) (15) Now we shall consider about the case of our experiment. The sample was a closed ( T.'? 'I.
(8) 54 g^iif^-gg {mi. system. Its upper surface was hot and its lower surface was cold. It is considered that a steady state had already been reached at the end of the heating. Besides we assume that the sample was in a fnnicular state from top to bottom. Then, we obtain the following relation. from (2), (3). 9»+^=0. (16). Combining (4), (5) and (16) we obtain. c'a=T(Q+^. W. This is a formula which gives the distribution of vapor flux in the sample. Next, if we shall express the humidity change as Ah, when the depth infinitesimally changes by Jz, the following formula is obtained using Eq. (7).. Ah=<m^= -^+PMdO_ldA^ ^ dz'"~ pmD,,,. As before, it is considered that the upper part is an evaporation region and the lower part is a condensation one in our sample, so Qv is maximum at tlie boundary of these regions. On. the other hand, h equals to 1 at this boundary by the expression (15). Therefore, if we express the depth of this boundary as Zs, h=l. at. 2=2,. (19). So we can obtain the distribution of relative humidity carrying out progressive calculations upward and downward by the repeated use of (18) under initial boundary condition (19). In a steady state, the following relation is derived from Eq. (2).. £=^. (20). Therefore we obtain the following expression from (15), (20). ,= d(!'ldz. c=^^h) The expressions (20) and (21) are the formulas which give the distributions of rate of evaporation-condensation and apparent evaporation-condensation coefficient respectively. On the other hand, according to the kinetic theory of gases, k is expressed by the following formula91. A^. /. RT. k=a^\/^M. ^,,. (22). where the true evaporation-condensation coefficient a expresses the fraction of the number of molecules impinging on a gas-liquicl interface that actually condense, and the effective specific surface in the sample Ae is the total surface available for evaporation or condensation per unit volume in the sample. The air-filled pores in the sample have a complicated form in the lower moisture content, but they approach gradually to a spherical form with increasing moisture content. However, if they are regarded as spherical particles for the sake of convenience, then we have110. Ae=4 6. dn. (23). where the surface mean diameter of air-filled pores da expresses the diameter of a sphere with the same specific surface as the air-filled pores. Now, da is proportional to sle13, hence ( fi4 '].
(9) Water Circulation and Evaporation-Condensation CoefEcient 55. ^=C^l3. (24). where C is a proportional constant. In a dried state (y=0i £e=s)i for the group of spherical glass particles in the sample, A, /e, =6(1— e) fed. Therefore C is expressed as follows from (24).. ;=lrieA --ea73~ ~d. where, if n, particles of diameter d, are present jn the sample, then d=Snids,12nid}. Hence the value of d can be calculated from the curve of size distribution in Fig. 2. In our samples, d= 3.1 x 10⁻² cm, e==0.372. Hence C= 2.35 x 102 cm-' Further -^/T^KM. =8.58 x 102cm/s degl/2. Therefore the formula (22) is expressed as follows. ^=2.02xl05a£71/3r1/2 (see-') (26) So the true evaporation-condensation coefficient is given by ff=4.95xl0-8/<3r-1/2. (27). Finally we must mention about the theoretical formula of pure thermal conductivity which is necessary to calculate the water vapor flux. We derived it from Burger-de Vries' theory10 assuming that for p>0.005 the liquid water is a continuum in which glass particles and air-filled pores are dispersed homogeneously. The formulas are as follows. , V^ + kg(l - e)^ + kaS,.\a _ <P^w + 0.628kg^ 4- (0.372 - f>)k^ " - ~ y + kg(l - S) + k.a6. ~ V + 0.628k.e + (0.372 - y)ka where /!,»= 1.320 x 10⁻³(1 +0.00303(9) (cal/cm s°C). ^ = 2.310 x 10⁻³(1 + 0.00075^) (cal/cm s°C) ^=0.0538 x 10⁻³(1+0.00337^) (cal/cm s°C) The value of /)g was estimated from a comparison of the experimental value with the theoretical one under dried and water-filled conditions. The values of kg and k.a are given by. ks=T+Tl3(^K,^i} (29). ^=ttri^(i^,,^+rRT^2^^ (30) In addition, the value of ga is expressed by. g^^^P (for 0.005 <p^ 0.040) 0.040r '""-"---.-"-"/. ^. ^. ga= 0.333 (for 0.040 <p<^ 0.372) where the region for 0.005 < <p 0.040 is in a pendular state, and the region for 0.040 ^y<. 0.372 is in a funicular state. Before, one of usl2) confirmed experimenlally that the water vapor in the air-filled pores of the sample reaches to a saturated state at y~0.005. Hence a liquid cup will begin to be formed at the contact point of the particles in this moisture content. Therefore it may be considered that a penclular state begins at y~0.005. It will be mentioned later that a funicular state begins at y~0.040. Now the present analysis is carried out by the following process. First, the distributions.
(10) i^m^-m (a^. 56. of temperature and volumetric moisture content, and heat flux in the sample are obtained by the experiment. The distributions of dftjdz and <<c are calculated using these data, and then the vapor flux distribution is calculated using Eq. (17). As is known from (16), the liquid water flux is equal to the vapor flux in magnitude and opposite in direction. The distribution of the rate of evaporation and condensation is calculated from (20) and the distribution of. relative humidity from (18), (19). The value of Den in the expression (18) is given by (8) in which the relative humidity h is contained. At first A-distribution is unknown, so we shall calculate distributions of Deo and h assuming that h is equal to 1 everywhere. A final h-d'istribution is calculated by repeating the process. And then the apparent evaporation-condensation coefBcient k is calculated from (21) and the true evaporation-condensation coefficient a from. (27). 4. Results and Discussion The obtained results from two samples which have different distributions of moisture content are shown in Fig, 5-12. Distributions of temperature and volmetric moisture cotent in samples No. 1 and 2 are shown in Fig. 5 and 6. From these curves of moisture content it appears that a funiculer state begins at y>~0.04. Namely it appears that the region where z ;> 1.5 cm in sample No. 1 and the region where 2 ^s 0.8 cm in sample No. 2 are funicular zones. However the above critical moisture content decreases with the increase of the particle's diameter135, and the sample that we used contains some of the larger particles as is known from the size distribution curve in Fig. 2. Therefore, the funicular zone may begin at a higher depth. To clarify this point it is necessary to carry out a closer measurement about the distribution of moiture content in the neighbourhood of the hot end. As we have carried out. 49. Sample No.1. A-1 0=1.158 <10'3calcm;. y (°/o) 30. 6 7 8 910. 0. Z (cm) Fig. 5, Distribution of temperature and volumetric moisture content (Sample No. I),.
(11) Water Circulation and Evaporation-Condensation Coefficient. 57. Sample No. 2 0=1.227x10³calcm2s~'. -0 1. 3456789 Z (cm). 10. Fig. 6. Distribution of temperature and volumetric moisture content (Sample No. 2).. 01. 23456789 10 Z(cm). Fig. 7. Distribution of water vapor flux.. the theoretical calculation for the distributions of q,, E, h, k and a assuming that the critical moisture content is 4%, the calculated values in the region where <p is smaller than 0.04 will not be exact.. Distributions of the water vapor flux are shown in Fig. 7. The vapor flux is maximum at a depth of 5.4cm in sample No. 1 and a depth of 5.6cm in sample No. 2. Accordingly it is considered that the regions upward of these depths are an evaporation region and the regions.
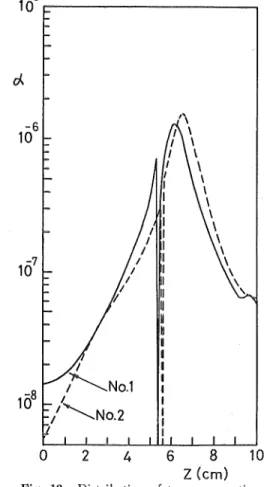
(12) ^iw^-m mi.. 58. (grcm3s1). 0123^5 ^. 7 8 9 10. -1.0. - 2.0 h. Fig, 8. Distribution of rate of evaporation and condensation.. 9 Z(cm). 10. Fig. 9. Distribution of relative humidity.. downward of these depths are a condensation region. This point is clear also from Fig. 8 and 9.. As is known from the above facts the upper end of a funicular zone exists in the uppermost part of the apparent evaporation region in both samples. Hence the circulation of water is sufficiently possible in these samples. So it is considered that these samples were in a steady state, the water was circulating with the heat flow in the part except the neighbourhood of the hot end. This circulation process of the water is shown schematically in Fig. 10. Distributions of the apparent evaporation-condensation coefficient are shown in Fig. 11 and distributions of the true evaporation-condensation coef&cient are shown in Fig. 12. The values of k and a drop down to nearly zero at the boundary of the evaporation and condensation regions and the.
(13) 59. Water Circulation and Evaporation.Condensation Coefficient. Sample No, 11. i. I I. tjt rt t t ft i 1 1111 I + I. •q«,. condensation. -j-eva.poration. I. ±. I I I. Sample 3le No. No. 21. m rt t t tt. I 1 1111 1. aporatior1 J.___ L. •q.. .L. J.. •tv. ^. condensation-L. -L. -I___1____L. 01 23456789 10 Z(cm). Fig. 10. Schematic diagram of circulation of water. Broken lines indicate the depth where <f is equal to ^%,. i65p 10 c d.. 106. /. f. l'\. \ \. \. \. \ \. \. \. /. '/. 107. \<. k\. \\. '// I/. ^. <\. >\.. I/. 108. T^^No.1 -' I. :/ ~l. '0 24 6 810. Z(cm). Fig. 11. Distribution of apparent evaporationcondensation coefficient.. /. ~No.2 1111. I I I. 02 4 6 810 Z (cm). Fig. 12. Distribution of true evaporationcondensation coefficient..
(14) GO. mm^-m. fs^. maximum value of these quantities appears in a lower part than the boundary. It seems that the investigations of these values in porous materials and granular ones are very rare. R. Toei and his co-workers1'0 reported that the value of a was about 10-5~10-G from. experiments and a theoretical analysis in the drying process of wetted sand. The values obtained in the present investigation are generally smaller than these values. This point should be investigated in detail from now.. 5. Conclusion The steady water circulation in a granular bed under a temperature gradient was investigated by the theoretical analysis based upon experimental data. No quantitative experimental investigations of water circulation in a granular bed have been carried out up to the present time. So we cannot judge whether these results are correct or not quantitatively. However these results agree well with the qualtative deductions by many investigators. Distributions of the apparent evaporation-condensation coefficient and the true one were also obtained in connection with the above results. The former's value was about 0.01~10s-l, the latter's value was 10~9—10-8. The value of the apparent evaporation-condensation coefiicient. is necessary to solve the differential equations of the transfer of heat and moisture in granular materials (Eq. (1), (2), (3)). The true evaporation-condensation coefficient is also an important quantity to investigate the evaporation and condensation in granular materials. Hereafter it is necessary that these values should be investigated in more detail.. Acknowledgements One of the authors (T. H.) wishes to express his gratitude for the financial support of Japan Society for the Promotion of Science. The authors are also indebted to Computation Center of Hokkaido University for the use of FACOM 230-60.. References. 1) 0. Krischer and H. Rohnalter : VDI-Forschungsheft 402 (1940) 1. 2) W. A. Hadley and R. Eisenstadt: Trans. Amer. Geophys. Union 36 (1955) 615. 3) R. D. Jackson, D. A. Rose and H. L. Penman : Nature 205 (1965) 314. 4) J. R. Phillip and D. A. de Vnes: Trans. Amer. Geophys. Union 38 (1957) 222. 5) D. A. de Vries : Trans. Amer. Geophys. Union 39 (1958) 909. 6) A. V. Luikov : Heat and Mass Transfer in Capillary-porons Bodies (Pergamon, London, 1966) p. 233. 7) T. Hasegawa : unpublished.. 8) T. Hasegawa : Mem. Hokkaldo Univ. Education 2A 14 (1963) 12 (in Japanese). 9) I. Oshida: fohatsu'Kanso {Evaporation and Drying) (Kawade, 1950) p. 15 (iu Japanese). 10) P. C. Carman : Flow of Gases through Porous Media (Butterworths, London, 1956) p. 17.. 11) W. R. Van Wijk : Physics of Plant Environment (North-Holland, 1963) p. 210, 12) T. Hasegawa : Mem. Hokkaido Univ. Education 2A 20 (1970) 53 (in Japanese). 13) N. Seki, S. Fukusako, M. Tanaka and M. Nakaoka: Abstract of the paper at the 10th Symp. of Heat. Trans., Japan (1973) 389 (in Japanese). 14) R. Toei, S. Hayashi and T. Fujitani: Kagaku Kogaku (Chem. Eng., Japan) 29 (1965) 771 (in Japanese)..
(15)
図


+2
関連したドキュメント
Standard domino tableaux have already been considered by many authors [33], [6], [34], [8], [1], but, to the best of our knowledge, the expression of the
An example of a database state in the lextensive category of finite sets, for the EA sketch of our school data specification is provided by any database which models the
So, the aim of this study is to analyze, numerically, the combined effect of thermal radiation and viscous dissipation on steady MHD flow and heat transfer of an upper-convected
Pour tout type de poly` edre euclidien pair pos- sible, nous construisons (section 5.4) un complexe poly´ edral pair CAT( − 1), dont les cellules maximales sont de ce type, et dont
このエアコンは冷房運転時のドレン(除湿)水を内部で蒸発さ
測定結果より、凝縮器の冷却水に低温のブライン −5℃ を使用し、さらに凝縮温度 を下げて、圧縮比を小さくしていくことで、測定値ハ(凝縮温度 10.6℃ 、圧縮比
Amount of Remuneration, etc. The Company does not pay to Directors who concurrently serve as Executive Officer the remuneration paid to Directors. Therefore, “Number of Persons”
As a result of the Time Transient Response Analysis utilizing the Design Basis Ground Motion (Ss), the shear strain generated in the seismic wall that remained on and below the
