cambridge.org/hyg
Original Paper
Cite this article:Hagiya H et al (2019). Trends in incidence and mortality of tuberculosis in Japan: a population-based study, 1997–2016. Epidemiology and Infection 147, e38, 1–10. https://doi.org/10.1017/S095026881800290X Received: 28 June 2018
Revised: 30 August 2018 Accepted: 26 September 2018 Key words:
Incidence; mortality; trend analysis; tuberculosis
Author for correspondence:
T. Koyama, E-mail:[email protected]
© The Author(s) 2018. This is an Open Access article, distributed under the terms of the Creative Commons Attribution licence (http:// creativecommons.org/licenses/by/4.0/), which permits unrestricted re-use, distribution, and reproduction in any medium, provided the original work is properly cited.
tuberculosis in Japan: a population-based
study, 1997
–2016
H. Hagiya1, T. Koyama2,3, Y. Zamami4,5, Y. Minato6, Y. Tatebe7, N. Mikami8, Y. Teratani2, A. Ohshima2, K. Shinomiya2,9, Y. Kitamura7, T. Sendo7, S. Hinotsu10, K. Tomono1and M. R. Kano2,11,12
1
Division of Infection Control and Prevention, Osaka University Hospital, 2-15 Yamadaoka, Suita, Osaka 5650871, Japan;2Department of Pharmaceutical Biomedicine, Graduate School of Medicine, Dentistry, and Pharmaceutical Sciences, Okayama University, 1-1-1 Tsushima-Naka, Kita-ku, Okayama, 7008530, Japan;3Education and Research Center for Clinical Pharmacy, Graduate School of Medicine, Dentistry, and Pharmaceutical Sciences, Okayama University, 1-1-1 Tsushima-naka, Kita-ku, Okayama 7008530, Japan;4Department of Clinical Pharmacology and Therapeutics, Tokushima University Graduate School of Biomedical Sciences, 3-18-15 Kuramoto, Tokushima, 7708503, Japan;5Department of Pharmacy, Tokushima University Hospital, 2-50-1 Kuramoto, Tokushima, 7708503, Japan;6Department of Microbiology and Immunology, University of Minnesota Medical School, 689 23rd Avenue SE, Minneapolis, Minnesota, 55455, USA;7Department of Pharmacy, Okayama University Hospital, 2-5-1 Shikata-cho, Okayama 7008558, Japan;8Division of Pharmacy, Chiba University Hospital, 1-8-1 Inohana, Chuo-ku, Chiba 2608677, Japan;9Department of Toji Pharmacy, Smile Co., Ltd., 6-1-11 Syoko-center, Nishi-ku, Hiroshima, 7330833, Japan;10Department of Biostatistics and Clinical Epidemiology, Sapporo Medical University, South 1, West 17, Chuo-Ku, Sapporo, Hokkaido 0608556, Japan;11Department of Pharmaceutical Biomedicine, Graduate School of Interdisciplinary Science and Engineering in Health Systems, Okayama University, 1-1-1 Tsushima-Naka, Kita-ku, Okayama, 700-8530, Japan and12Department of Geriatric Medicine, University of Tokyo, 7-3-1 Hongo, Bunkyo-ku, Tokyo 1138655, Japan
Abstract
Japan is still a medium-burden tuberculosis (TB) country. We aimed to examine trends in newly notified active TB incidence and TB-related mortality in the last two decades in Japan. This is a population-based study using Japanese Vital Statistics and Japan Tuberculosis Surveillance from 1997 to 2016. We determined active TB incidence and mor-tality rates (per 100 000 population) by sex, age and disease categories. Joinpoint regression was applied to calculate the annual percentage change (APC) in age-adjusted mortality rates and to identify the years showing significant trend changes. Crude and age-adjusted inci-dence rates reduced from 33.9 to 13.9 and 37.3 to 11.3 per 100 000 population, respectively. Also, crude and age-adjusted mortality rates reduced from 2.2 to 1.5 and 2.8 to 1.0 per 100 000 population, respectively. Average APC in the incidence and mortality rates showed significant decline both in men (−6.2% and −5.4%, respectively) and women (−5.7% and −4.6%, respect-ively). Age-specific analysis demonstrated decreases in incidence and mortality rates for every age category, except for the incidence trend in the younger population. Although trends in active TB incidence and mortality rates in Japan have favourably decreased, the rate of decline is far from achieving TB elimination by 2035.
Introduction
Tuberculosis (TB) continues to be one of the leading infectious causes of death globally. In 2016, the global incidence of all forms of TB was 10.4 million, leading to 1.3 million annual
deaths worldwide [1]. Furthermore, the emergence of multidrug-resistant TB, caused by
vari-ous gene mutations [2], is a growing global public health concern [3]. In the World Health
Organization (WHO)’s End TB Strategy, the WHO proposed the reduction of TB incidence
to <10 cases per 100 000 population by 2035 and less than one case per 100 000 population
by 2050, and eventually for the elimination of the disease [4]. In the era of globalisation,
there is no TB-free region and this contagious disease cannot be eliminated from any region without a global approach. The TB burden is a major public health issue predominantly in low- and middle-income countries. However, it continues to be a persistent problem in high-income countries, among various vulnerable populations in each society.
In high-income countries with low-TB incidence, these goals require additional efforts. First, it is important to recognise common risk factors for TB exposure. Older people are
known to be a common population who develop active TB disease [5,6]. Changes in the
popu-lation structure of industrialised countries, i.e. ageing societies, may accelerate the overall risk
of TB exposure [5–7]. Other specific populations, such as homelessness [8] and immigrants
should note that contacts to these population would pose a risk of TB exposure in advanced countries. Second, it is also essential to improve access to high-quality TB care and address the
under-lying risk factors for TB progression [11]. Medical risk factors,
such as HIV [12], increasing drug resistance [13] and
non-communicable diseases, such as diabetes mellitus [14,15], alcohol
abuse and smoking [16], can allow latent TB infection to progress
to active diseases. Better management of these underlying condi-tions would also lead to suppression of TB disease.
Japan is still a TB middle-burden country, with a notification
rate of 13.9 cases per 100 000 population in 2016 [17]. A previous
study revealed that a high incidence rate among older people is a
possible explanation for the TB prevalence in Japan [5]. TB
inci-dence has been consistently higher among older individuals aged >80 years in Japan, with 49.8 and 78.1 per 100 000 population
among adults aged 80–84 and 85–89 years, respectively [17].
Also, as with European regions, an increase in TB cases among foreigners might have influenced the slowing down of the decline
in the trend of TB in Japan [18]. To achieve the global goals for
TB elimination, prioritisation of key measures and target popula-tions should be based on an epidemiological study in each coun-try and region, guided by effective data analysis. In Japan, trends
in the crude rate of TB incidence have been reported [17];
how-ever, epidemiological trend analysis on nationwide TB incidence and mortality has not been fully evaluated.
In this article, we aimed to evaluate the incidence and mortal-ity trends of TB in Japan during the last two decades. Furthermore, the differences in comparison with other countries, to inform intervention efforts towards meeting the Sustainable
Development Goals to tackle TB by 2035, were discussed [19].
Materials and methods Data source
This was a 20-year retrospective observational study covering data from 1997 to 2016. Data used to determine newly notified active TB incidence were obtained from the Tuberculosis Surveillance
Center in Japan [20]. Japan introduced the first nationwide
com-puterised TB surveillance system in 1987. TB is a notifiable dis-ease, and public health centres are responsible for the collection and entry of the data from notified patients into the system. The data are summarised every month and annually, and are
made publicly available online [20]. Data on the number of
TB-associated deaths by sex, age and TB categories (respiratory TB, nervous system TB and other TB) were obtained from the vital statistics collected by the Japanese Ministry of Health,
Labor, and Welfare [21]. In Japan, TB is defined as a Category
II Infectious Disease by the Act on the Prevention of Infectious Diseases and Medical Care for Patients with Infectious Diseases
(the Infectious Diseases Control Law) [22]. Physicians who
diagnose patients with TB disease are required to report the case to the National Epidemiologic Surveillance of Infectious Disease (NESID). Thus, patients with TB diseases are well diag-nosed and reported throughout the entire country. The surveil-lance system data included information on the patient’s sex, age and diagnosis of TB diseases. Age groups were categorised as:
0–24, 25–44, 45–64 and ⩾65 years. However, data on the
mortal-ity rate among people aged⩽24 years were not included in the
subgroup analysis because of the limited number of deaths in this age group. To improve comparability, we adopted the direct standardisation method, and calculated the age-adjusted rates
(AARs) of incidence and mortality, based on the European
stand-ard population [23] as a standard of industrialised countries,
using 5-year age groups. Ethics approval was waived by the insti-tutional review board in Okayama University Hospital, since the data used in the present study were anonymised and open to the public.
Definitions of TB-related death were based on the International Statistical Classification of Diseases and Related Health Problems coding system (10th edition), according to previous literature
[24–26]. Accordingly, TB diseases were defined as follows:
respira-tory TB (A15 and A16), TB of the nervous system (A17), TB of other organs (A18) and miliary TB (A19).
Statistical analyses and data processing
We calculated crude and AARs of active TB diseases and TB-related death. Age adjustment is one of the key methods to control for different age distributions among populations, or over time. To estimate trends in the AAR, the Joinpoint regression model was applied for sex, age and TB categories using the Joinpoint Regression Program, version 4.5.0.1, June 2017 (Statistical Research and Applications Branch, National Cancer
Institute) [27], which was applied in previous literature [24].
We used Joinpoint regression analysis to identify years when sig-nificant trend changes occurred in the linear slope of the temporal trend. This analysis has two strengths. The analysis identifies the year when significant trend changes occurred and estimates the magnitude of the increase or decrease in each linear slope by cal-culating the annual percentage change (APC). Also, the average annual percentage change (AAPC) in the entire period and the current 5-year period was estimated. Data processing and aggre-gation were performed using Microsoft Access® 2013 (Microsoft Corporation, Redmond, WA, USA).
Results
Level changes in incidence and mortality rate
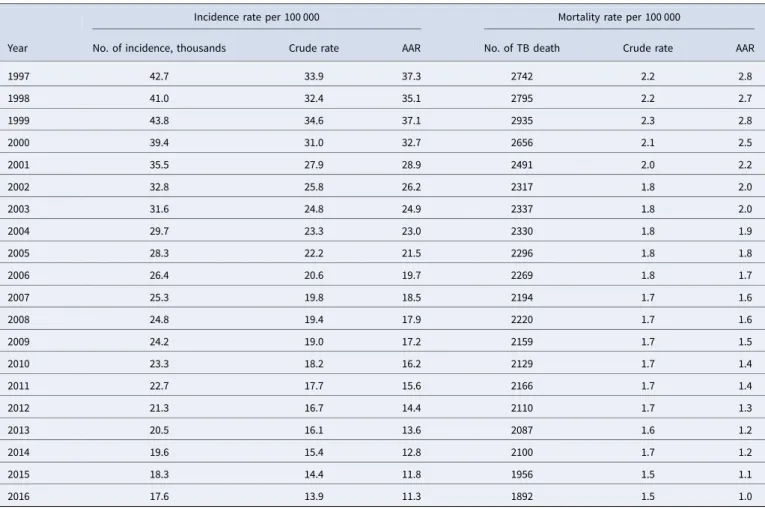
During the study period, the incidence of TB chronologically declined from 1997 (42 715 cases overall; with 27 384 in males and 15 331 in females) to 2016 (17 625 cases overall; with 10
594 in males and 7031 in females) (Table 1 and Fig. 1). The
age-adjusted incidence rate per 100 000 population in males (15.8) was two times higher than that in females (8.0) in 2016. Similarly, the number of TB deaths reduced from 1997 (2742 cases overall; 1955 in males and 787 in females) to 2016 (1892 cases overall; 1133 in males and 759 in females). Between 1997 and 2016, the crude and age-adjusted mortality rates per 100 000 population decreased from 2.2 to 1.5 and 2.8 to 1.0, respect-ively. Between sexes, the age-adjusted mortality rate per 100 000 population among males (1.7) was three times higher than that in females (0.6). Among Japanese, both TB incidence and death involved men more frequently than women in most age groups, including the older population. Although this decreasing trend was preferable, the incidence of TB was far from the End TB goals to achieve by 2035.
Trends in the overall incidence and mortality rates
The trend analysis revealed that the age-adjusted trends in inci-dence and mortality rates have both been decreasing in Japan. Both the incidence and mortality rate decreased significantly
throughout the study period. The incidence rate decreased at
10.8% annually from 1999 to 2002, then 5.8% in 2002–2016.
Overall, the AAPC in incidence rate was−6.0% (95% confidence
interval (95% CI) −6.8 to −5.2) during the entire study period.
Similarly, the age-adjusted mortality rate showed a significant
decline in the trend, with an APC of 9.9% in 1999–2002, 4.5%
in 2002–2014 and 7.8% in 2014–2016. Consequently, the AAPC
in overall mortality rate was −5.3% (95% CI −5.9 to −4.6)
(Table 2). Although significant decreasing trends were observed, a further rapid annual change is required to accomplish the End TB Strategy.
Trends in incidence and mortality rates by sex
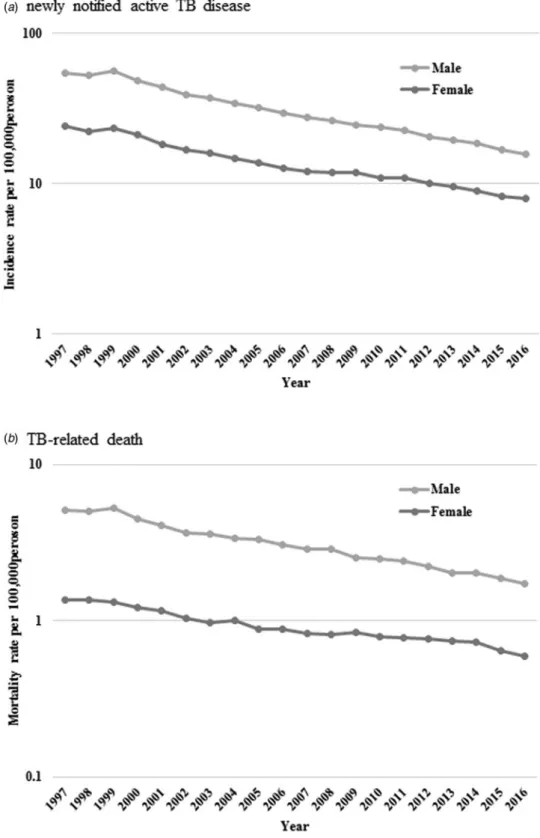
By sex; age-standardised incidence and mortality rate per 100 000
population was determined and the results are shown inFigure 2.
Also, the results of the trend analysis are shown inTable 2. The
Joinpoint regression analysis revealed that both incidence and mortality rates decreased similarly both in males and females. Incidence rates in males showed an increasing trend between 1997 and 1999, but subsequently decreased. The incidence rate in females continuously declined throughout the study period. Consequently, AAPCs of TB incidence for the entire period in
males and females were −6.2% (95% CI −6.9 to −5.5) and
−5.7% (95% CI −6.4 to −5.1), respectively. The mortality trend followed a similar chronological course, beginning its rapid decline from 1999 in males and from 1997 in females. AAPC
during the current 5-year period showed a slower decline in
males (−5.5% (95% CI −6.0 to −5.0)) than females (−6.3%
(95% CI−10.1 to −2.3)). For the entire study period, AAPCs in
males and females were −5.4% (95% CI −6.9 to −3.9) and
−4.6% (95% CI −5.6 to −3.6), respectively.
Trends in incidence and mortality rates by age
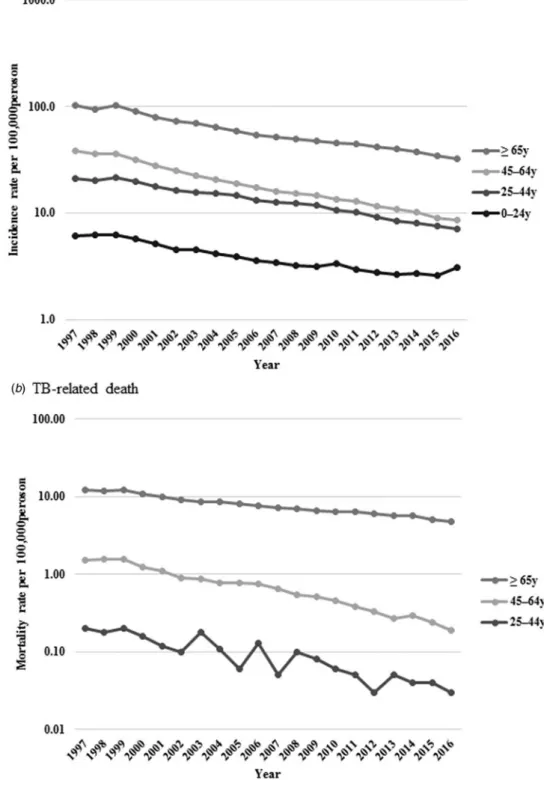
Incidence rates per 100 000 population decreased from 6.1 to 3.1,
21.0 to 7.0, 38.7 to 8.6 and 101.4 to 32.2 in the 0–24, 25–44, 45–64
and ⩾65 years age group, respectively. Also, mortality rates per
100 000 population declined from 0.2 to 0.03 among those aged 25–44 years, 1.5 to 0.2 among 45–64 years and 12.0 to 4.8
among⩾65 years (Fig. 3).
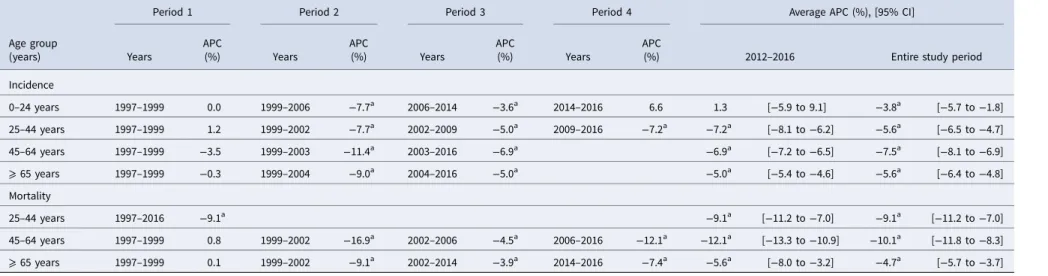
The results of the trend analysis by age group are summarised inTable 3. For the incidence, the Joinpoint regression model did not reveal any remarkable trend in age categories in 1997–1999. Subsequently, there was a change in the trend in 1999, with a decline in the age-adjusted incidence rate towards the end of the study period in all age categories, except the youngest category (0–24 years). The fast-declining trend observed in the youngest
age category at 7.7% in 1999–2006 slowed down to 3.6% in
2006–2014, and then stopped decreasing trend in 2014–2016.
Also, decreasing trends seen in the middle age group (45–64
years) and older persons (⩾65 years) slowed down at the latter part of the study period. As a result, the AAPC for the entire study period decreased in all age categories; however, the Table 1.Newly notified active tuberculosis (TB) incidence and TB-related mortality rates per 100 000 persons during 1997–2016
Year
Incidence rate per 100 000 Mortality rate per 100 000
No. of incidence, thousands Crude rate AAR No. of TB death Crude rate AAR
1997 42.7 33.9 37.3 2742 2.2 2.8 1998 41.0 32.4 35.1 2795 2.2 2.7 1999 43.8 34.6 37.1 2935 2.3 2.8 2000 39.4 31.0 32.7 2656 2.1 2.5 2001 35.5 27.9 28.9 2491 2.0 2.2 2002 32.8 25.8 26.2 2317 1.8 2.0 2003 31.6 24.8 24.9 2337 1.8 2.0 2004 29.7 23.3 23.0 2330 1.8 1.9 2005 28.3 22.2 21.5 2296 1.8 1.8 2006 26.4 20.6 19.7 2269 1.8 1.7 2007 25.3 19.8 18.5 2194 1.7 1.6 2008 24.8 19.4 17.9 2220 1.7 1.6 2009 24.2 19.0 17.2 2159 1.7 1.5 2010 23.3 18.2 16.2 2129 1.7 1.4 2011 22.7 17.7 15.6 2166 1.7 1.4 2012 21.3 16.7 14.4 2110 1.7 1.3 2013 20.5 16.1 13.6 2087 1.6 1.2 2014 19.6 15.4 12.8 2100 1.7 1.2 2015 18.3 14.4 11.8 1956 1.5 1.1 2016 17.6 13.9 11.3 1892 1.5 1.0
declining trend has decelerated in recent years, except for in the
25–44 years category, and has stopped decreasing in the youngest
category.
On the other hand, mortality rates rapidly and continuously dropped in all age groups in an accelerating manner. APC in the
youngest age category (0–24 years) was not applicable due to the
lim-ited number of cases. AAPCs for the entire study period showed a
sig-nificant decrease in every age category: by 9.1% (95% CI−11.2 to
−7.0) in 25–44 years, 10.1% (95% CI −11.8 to −8.3) in the
middle-aged and by 4.7% (95% CI−5.7 to −3.7) in the oldest age
group. Furthermore, AAPCs in the current 5-year period declined
more rapidly both in the middle-aged (by 12.1% (95% CI−13.3 to
−10.9)) and the oldest (by 5.6% (95% CI −8.0 to −3.2)) age groups.
Mortality trend by TB category
Finally, we explored mortality trends by TB categories (Table 4).
TB cases were divided into three categories: respiratory, nervous
system and others. For respiratory TB, there was no significant
change in 1997–1999. However, a decline in trend was observed
since 1999, with an overall AAPC of −5.5% (95% CI −6.2 to
−4.8). Due to few TB cases, APCs for nervous system and the ‘others’ TB categories were determined for the entire study period only; this showed significant declining trends in both categories, −3.0% (95% CI −4.8 to −1.2) and −2.2% (95% CI −2.9 to −1.4), respectively.
Discussion
In the present study, we investigated the newly notified active TB incidence and TB-related mortality rates using the nationwide data. Still moderately endemic, overall TB incidence declined con-tinuously by 6.0% annually during the last two decades, close to the national-level target of 10 per 100 000 population in Japan
[4]. However, this decline in the annual incidence of TB diseases
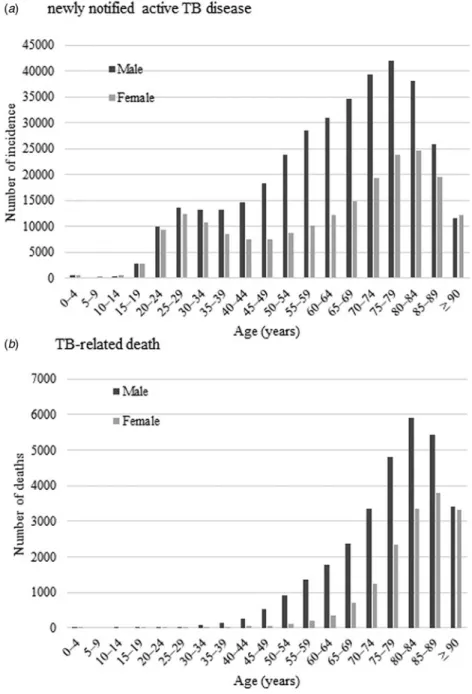
in Japan is far from achieving TB elimination by 2035. Although Fig. 1.Age–sex distribution of newly notified active tuberculosis
incidence (a) and tuberculosis-related deaths (b) during 1997– 2016.
the overall mortality rate decreased by 5.3% annually, it is neces-sary to further accelerate this declining trend to achieve the End TB Strategy. Although a clear explanation cannot be provided, the downward trends in the AARs for both TB incidence and mortality from the early 2000s was also reported in the global
sys-temic analysis [28]. The global study reported an accelerating
decreasing trend in developed countries with high socio-demographic index. Average annualised rate of changes in the age-standardised incidence and mortality rate declined from −1.1% to −3.1% and −1.1% to −7.2%, respectively, between
1990–2005 and 2005–2015 [16]. The decreasing trends in the
incidence rates in Japan were faster than the average reported in developed countries, while the mortality trend remained at similar
levels [16]. Although the global TB incidence rate is declining in
an accelerating manner, there is concern that the declining speed in Japan might be slowing down, especially among the younger population. For global TB elimination, an international study in 33 low-incidence countries presented APC targets for incidence
rates as−18% and −11%, on average, by 2035 and 2050,
respect-ively [11]. Thus, greater efforts are required to reduce the TB
inci-dence in Japan towards the global goal of TB elimination. Compared with men, the Japanese female population had a lower incidence and mortality of TB disease, as was reported
from other countries [16,24]. A similar sex difference, associated
with TB infection, was described in the global analysis, with 64.7% of deaths in HIV-negative individuals occurring in the
male population [28]. Our result of higher TB incidence in the
male population indicated that men are more likely to be exposed to TB than similar age women throughout the age categories. Although a conclusive explanation is difficult, men may be more likely to be exposed to TB unknowingly in society. However, as for the risk of latent TB infection, a previous study demonstrated that women are currently at higher risk than men in Japan: 57.5% of notifications for latent TB infection were
reported from women [29]. Therefore, we speculate that men,
compared with women, have more underlying risk factors for developing TB diseases. Previous literature regarding the charac-teristics of Japanese active TB cases reported that underlying con-ditions or morbidity, such as homelessness, HIV-complicated cases and diabetes mellitus, were more frequently observed in
men [30]. This difference also possibly accounts for higher
mor-tality in men. As mentioned above, however, the incidence and mortality rates in Japanese males are constantly decreasing. Although a causal explanation is difficult, improvements in treat-ment compliance and managetreat-ment of underlying diseases may be plausible explanations for the better prognosis of the disease. In addition, TB contact investigations routinely performed by public health centres as a government support could have contributed to
the decline of TB prevalence in Japan [31].
Our data demonstrated that there was an annual average TB mortality decrease of approximately 10% in Japanese people under 65 years. Active TB incidence and mortality among older people are still high, though it is steadily decreasing, with an
APC of −5.6% and −4.7%, respectively. The older population is
globally at greater risk of TB [5,6], with disease burden increases
in North and Latin American countries [7,32] and China [33]. In
this aged society in Japan, where the proportion of people aged ⩾65 years accounted for 26.7% of the total population in 2015
[34], TB can be a persistent serious public burden over time.
In addition to the incidence, case fatality determines the mor-tality trend of the disease. The relatively slower decrease in the mortality rate of TB in older people can be explained by several
T able 2. Joinpoint analy sis of ne wly notified a ctiv e tuber culosis incidence and tuber culosis-r ela ted mortality ra te per 100 000 persons by se x during 1997 –2016 P eriod 1 P eriod 2 P eriod 3 P eriod 4 A ve rage APC (%), [95% CI] Years APC (%) Years APC (%) Years APC (%) Years APC (%) 2012 –2016 Entir e study period Incidence Total 1997 –1999 − 0.1 1999 –2002 − 10.8 a 2002 –2016 − 5.8 a − 5.8 a [− 6.0 to − 5.5] − 6.0 a [− 6.8 to − 5.2] Male 1997 –1999 1.0 1999 –2002 − 10.8 a 2002 –2016 − 6.2 a − 6.2 a [− 6.4 to − 6.0] − 6.2 a [− 6.9 to − 5.5] F emale 1997 –2005 − 7.2 2005 –2016 − 4.6 a − 4.6 a [− 5.6 to − 3.7] − 5.7 a [− 6.4 to − 5.1] Mortality Total 1997 –1999 0.0 1999 –2002 − 9.9 a 2002 –2014 − 4.5 a 2014 –2016 − 7.8 a − 6.2 a [− 7.8 to − 4.5] − 5.3 a [− 5.9 to − 4.6] Male 1997 –1999 0.9 1999 –2002 − 10.9 a 2002 –2005 − 3.3 a 2005 –2016 − 5.5 a − 5.5 a [− 6.0 to − 5.0] − 5.4 a [− 6.9 to − 3.9] F emale 1997 –2005 − 5.5 a 2005 –2014 − 2.5 a 2002 –2016 − 9.9 a − 6.3 a [− 10.1 to − 2.3] − 4.6 a [− 5.6 to − 3.6] aSignificantly differ ent fr om zer o ( p < 0.05). APC, annual per centage chan ge; CI, confidence interval .
factors. First, underlying chronic diseases in an advanced-age population, including chronic obstructive pulmonary disease, malnutrition and diabetes mellitus, can increase the mortality
rate [7,35]. Second, a delay in diagnosis can contribute to a slower
decrease in TB mortality among older people [36]. Older adults,
particularly those who are physically challenged, are often eco-nomically distressed and socially vulnerable, and tend to be
discouraged from visiting a medical facility [37]. Also, older
peo-ple tend to present atypically or with less prominent manifesta-tions of a disease, which can lead to misdiagnosis or delay in
diagnosis [7,38]. Furthermore, older people diagnosed with TB
may frequently experience adverse effects associated with TB treatment, and they tend to be treated with second- or third-line drugs. Also, in older patients infected with drug-resistant TB, the Fig. 2.Age-standardised newly notified active tuberculosis incidence (a) and tuberculosis-related death (b) rate per 100 000 persons by sex.
treatment outcome would be poor as they are vulnerable to
pro-longed and intensified chemotherapy [39]. As a result of these
factors, older adults are at higher risk of developing incurable
TB disease and consequent unfavourable prognosis [40], leading
to the relatively slower decrease in the mortality rate.
The strength of our study is the nationwide and long-term nature of the data. However, our study had several limitations. First, under-reporting of TB cases should be noted. Diagnostic
accuracy of TB diseases might not be perfect in various clinical settings. However, TB diseases are to be reported by law to the national surveillance system in Japan; thus, the diseases are, in general, carefully diagnosed and followed up by clinicians. Second, due to the absence of clinical data, we could not deter-mine whether TB diseases were directly associated with the prog-nosis of the patients. It is essential to consider HIV co-morbidity, which is often associated with TB mortality. In some European Fig. 3.Age-standardised newly notified active tuberculosis incidence (a) and tuberculosis-related death (b) rate per 100 000 persons by age.
Table 3.Joinpoint analysis of newly notified active tuberculosis incidence and tuberculosis-related mortality rate per 100 000 persons by age during 1997–2016
Age group (years)
Period 1 Period 2 Period 3 Period 4 Average APC (%), [95% CI]
Years APC (%) Years APC (%) Years APC (%) Years APC
(%) 2012–2016 Entire study period
Incidence 0–24 years 1997–1999 0.0 1999–2006 −7.7a 2006–2014 −3.6a 2014–2016 6.6 1.3 [−5.9 to 9.1] −3.8a [−5.7 to −1.8] 25–44 years 1997–1999 1.2 1999–2002 −7.7a 2002–2009 −5.0a 2009–2016 −7.2a −7.2a [−8.1 to −6.2] −5.6a [−6.5 to −4.7] 45–64 years 1997–1999 −3.5 1999–2003 −11.4a 2003–2016 −6.9a −6.9a [−7.2 to −6.5] −7.5a [−8.1 to −6.9] ⩾ 65 years 1997–1999 −0.3 1999–2004 −9.0a 2004–2016 −5.0a −5.0a [−5.4 to −4.6] −5.6a [−6.4 to −4.8] Mortality 25–44 years 1997–2016 −9.1a −9.1a [−11.2 to −7.0] −9.1a [−11.2 to −7.0] 45–64 years 1997–1999 0.8 1999–2002 −16.9a 2002–2006 −4.5a 2006–2016 −12.1a −12.1a [−13.3 to −10.9] −10.1a [−11.8 to −8.3] ⩾ 65 years 1997–1999 0.1 1999–2002 −9.1a 2002–2014 −3.9a 2014–2016 −7.4a −5.6a [−8.0 to −3.2] −4.7a [−5.7 to −3.7]
aSignificantly different from zero ( p < 0.05).
APC, annual percentage change; CI, confidence interval.
Table 4.Joinpoint analysis of tuberculosis-related mortality rate per 100 000 persons by tuberculosis category during 1997–2016
Period 1 Period 2 Period 3 Period 4 Average APC (%), [95% CI]
Years APC (%) Years APC (%) Years APC (%) Years APC (%) 2012–2016 Entire study period
Respiratory TB 1997–1999 0.5 1999–2002 −10.4a 2002–2014 −4.9 2014–2016 −7.6a −6.3a [−8.1 to −4.5] −5.5a [−6.2 to −4.8]
Nervous system TB 1997–2016 −3.0a −3.0a [−4.8 to −1.2] −3.0a [−4.8 to −1.2]
Other TB 1997–2016 −2.2a −2.2a [−2.9 to −1.4] −2.2a [−2.9 to −1.4]
aSignificantly different from zero ( p < 0.05).
APC, annual percentage change; CI, confidence interval.
8 H. Hagiy a et al. . https://doi.org/10.1017/S095026881800290X https://www.cambridge.org/core
. The University of Tokushima
, on
18 Aug 2020 at 06:27:18
countries, emergence and wide-spread HIV infection altered the
rate of decline of TB mortality [41]. Third, our approach to the
age adjustment using the European standard population might have yielded a bias, because the demographic structure, as well as the TB epidemiology of Japan, possibly differ. However, com-pared with the rest of the world, European countries have similar social and population structures (industrialised countries with ageing populations), and thus our age-adjustment method would be comparably suitable. Our principle aim of the study was to evaluate the trend of TB diseases in Japan, and the present method would satisfy this purpose. Finally, long-term case fatality should have been traced to estimate the trend change of TB dis-eases impacts. However, due to a lack of relevant data available, we could not directly evaluate this in this study.
In conclusion, we revealed the long-term trends in TB inci-dence and mortality rates in Japan, which have certainly declined over the past two decades. Mortality, especially among the young to middle-aged population, is favourably decreasing, by approxi-mately 10% annually. On the other hand, the decline in the overall
incidence rate (annual APC,−6.0%) goes below the target goal of
the End TB Strategy, which is a potential reason that Japan is a moderately TB endemic country. Further multisectoral measures based on a long-term epidemiological assessment are necessary. Author ORCIDs. T. Koyama http://orcid.org/0000-0002-7755-1754
Y. Minatohttp://orcid.org/0000-0002-0888-8564
Financial support. This research received no specific grant from any fund-ing agency, commercial, or not-for-profit sectors.
Conflict of interest. None.
Ethics approval. The authors assert that all procedures contributing to this work comply with the ethical standards of the relevant national and institu-tional committees on human experimentation and with the Helsinki Declaration of 1975, as revised in 2008. For this type of study, formal consent was not required.
References
1. World Health Organization. Global tuberculosis report 2017. Available
at http://www.who.int/tb/publications/global_report/en/ (Accessed 21
February 2018).
2. Coll Fet al. (2018) Genome-wide analysis of multi- and extensively drug-resistant Mycobacterium tuberculosis. Nature Genetics 50, 307–316. 3. Dheda Ket al. (2014) Global control of tuberculosis, from extensively
drug-resistant to untreatable tuberculosis. The Lancet Respiratory Medicine 2, 321–338.
4. Uplekar Met al. (2015) WHO’s new End TB Strategy. The Lancet 385, 1799–1801.
5. Schaaf HSet al. (2010) Tuberculosis at extremes of age. Respirology 15, 747–763.
6. Negin J, Abimbola S and Marais BJ (2015) Tuberculosis among older adults– time to take notice. International Journal of Infectious Diseases 32, 135–137.
7. Pratt RHet al. (2011) Tuberculosis in older adults in the United States, 1993–2008. Journal of the American Geriatrics Society 59, 851–857. 8. Martens WH (2001) A review of physical and mental health in homeless
persons. Public Health Reviews 29, 13–33.
9. Dara Met al. (2012) Minimum package for cross-border TB control and care in the WHO European region: a Wolfheze consensus statement. European Respiratory Journal 40, 1081–1090.
10. Greenaway Cet al. (2011) Tuberculosis: evidence review for newly arriv-ing immigrants and refugees. Canadian Medical Association Journal 183, E939–E951.
11. Lönnroth Ket al. (2015) Towards tuberculosis elimination: an action framework for low-incidence countries. European Respiratory Journal 45, 928–952.
12. Raviglione MC, Narain JP and Kochi A (1992) HIV-associated tubercu-losis in developing countries: clinical features, diagnosis, and treatment. Bulletin of the World Health Organization 70, 515–526.
13. Nathanson Eet al. (2010) MDR tuberculosis – critical steps for preven-tion and control. New England Journal of Medicine 363, 1050–1058. 14. Lönnroth K, Roglic G and Harries AD (2014) Improving tuberculosis
pre-vention and care through addressing the global diabetes epidemic: from evi-dence to policy and practice. The Lancet Diabetes & Endocrinology 2, 730–739. 15. van Crevel R, Dockrell HM and TANDEM Consortium (2014) TANDEM: understanding diabetes and tuberculosis. The Lancet Diabetes & Endocrinology 2, 270–272.
16. Kyu HHet al. (2018) The global burden of tuberculosis: results from the Global Burden of Disease Study 2015. The Lancet Infectious Diseases 18, 261–284.
17. Tuberculosis Surveillance Center. Tuberculosis in Japan– annual report 2017. Available athttp://www.jata.or.jp/english/dl/pdf/TB_in_Japan_2017. pdf(Accessed 22 February 2018).
18. Kawatsu Let al. (2016) Profile of tuberculosis among the foreign-born population in Japan, 2007–2014. Western Pacific Surveillance and Response Journal 7, 7–16.
19. Lönnroth K and Raviglione M (2016) The WHO’s new End TB Strategy in the post-2015 era of the Sustainable Development Goals. Transactions of The Royal Society of Tropical Medicine and Hygiene 110, 148–150. 20. The Tuberculosis Surveillance Center. Available athttp://www.jata.or.jp/
rit/ekigaku/en(Accessed 21 February 2018).
21. Ministry of Health, Labour and Welfare Vital Statistics in Japan. Available at http://www.mhlw.go.jp/english/database/db-hw/vs01.html
(Accessed 15 February 2018).
22. Ministry of Justice (2018) Act on the Prevention of Infectious Diseases and Medical Care for Patients with Infectious Diseases. Available at
http://www.japaneselawtranslation.go.jp/law/detail/?id=2830&vm=04&re=02
(Accessed 28 March 2018).
23. Pace M et al. Revision of the European Standard Population: report of Eurostat’s task force: 2013 edition. Available at https://ec.europa.eu/euro-
stat/documents/3859598/5926869/KS-RA-13-028-EN.PDF/e713fa79-1add-44e8-b23d-5e8fa09b3f8f(Accessed 10 August 2018).
24. Llorca Jet al. (2012) Mortality from tuberculosis in Spain, 1971 to 2007: slow decrease in female and in elderly patients. Annals of Epidemiology 22, 474–479.
25. Korenromp ELet al. (2009) The measurement and estimation of tuber-culosis mortality. The International Journal of Tubertuber-culosis and Lung Disease 13, 283–303.
26. Lu THet al. (2005) Tuberculosis mortality trends in Taiwan: a resurgence of non-respiratory tuberculosis. The International Journal of Tuberculosis and Lung Disease 9, 105–110.
27. Kim HJ et al. (2000) Permutation tests for joinpoint regression with applications to cancer rates. Statistics in Medicine 19, 335–351. 28. Murray CJLet al. (2014) Global, regional, and national incidence and
mortality for HIV, tuberculosis, and malaria during 1990–2013: a system-atic analysis for the Global Burden of Disease Study 2013. The Lancet 384, 1005–1070.
29. Kawatsu L, Uchimura K and Ohkado A (2017) Trend and treatment sta-tus of latent tuberculosis infection patients in Japan– analysis of Japan TB Surveillance data. PLoS ONE 12, e0186588.
30. Uchimura K et al. (2013) Characteristics and treatment outcomes of tuberculosis cases by risk groups, Japan, 2007–2010. Western Pacific Surveillance and Response Journal 4, 11–18.
31. Izumi Ket al. (2017) Evaluation of tuberculosis contact investigations in Japan. The International Journal of Tuberculosis and Lung Disease 21, 188–195. 32. Menezes AMBet al. (2007) Tuberculosis and airflow obstruction: evi-dence from the PLATINO study in Latin America. European Respiratory Journal 30, 1180–1185.
33. Abuaku Bet al. (2010) Treatment default and death among tuberculosis patients in Hunan, China. Scandinavian Journal of Infectious Diseases 42, 281–287.
34. Cabinet Office of Japan Annual Report on the Aging Society: 2016 (Summary). Available at
http://www8.cao.go.jp/kourei/english/annualre-port/2016/2016pdf_e.html(Accessed 20 February 2018).
35. Riza ALet al. (2014) Clinical management of concurrent diabetes and tuberculosis and the implications for patient services. The Lancet Diabetes & Endocrinology 2, 740–753.
36. Storla DG, Yimer S and Bjune GA (2008) A systematic review of delay in the diagnosis and treatment of tuberculosis. BMC Public Health 8, 15. 37. Bhushan Bet al. (2012) Manifestations of tuberculosis in elderly versus
young hospitalised patients in Amritsar, India. The International Journal of Tuberculosis and Lung Disease 16, 1210–1213.
38. Pérez-Guzmán Cet al. (1999) Does aging modify pulmonary tubercu-losis? A meta-analytical review. Chest 116, 961–967.
39. Ahuja SDet al. (2012) Multidrug resistant pulmonary tuberculosis treat-ment regimens and patient outcomes: an individual patient data meta-analysis of 9,153 patients. PLoS Medicine 9, e1001300.
40. Velayutham BRVet al. (2014) Profile and response to anti-tuberculosis treatment among elderly tuberculosis patients treated under the TB Control programme in South India. PLoS ONE 9, e88045.
41. Raviglione MC et al. (1993) Secular trends of tuberculosis in Western Europe. Bulletin of the World Health Organization 71, 297–306.