Ⅰ.Introduction
Physical growth of children differs among many countries [1]. Also, regional difference exists within a country or province [2]. Some causes of regional difference are socio-economic or nutritional status [3, 4, 5, 6] and others include genetics [7]. A single growth standard like that of NCHS makes it difficult to evaluate adequate physical growth with regional difference [8].
In Japan, stature is higher in northern/eastern part than
southern/western part within a country. School health statistics of Japan [9] also shows that statue of 17-year-old boys and girls are lowest in Okinawa Prefecture, which is located southern/western end of Japan. In growth assessment in infancy and childhood, there is an argument concerning whether it is adequate or not to assess growth of children in Okinawa Prefecture by National Growth Standard in childhood [10]. Physiques of Japanese children differs among prefectures where they live in and grown up [11]. As is described in Yamadi the regional population in India, widely used growth standard is not always useful in a certain region in the country [7]. So, in Japan national
<Original>
The regional difference in children’s physical growth between Yaeyama
Islands of Okinawa Prefecture and national survey in Japan
Noriko K
ATO1),Hidemi T
AKIMOTO2),Takashi E
TO3)1)Area on Community Health System, National Institute of Public Health 2)
Department of Health Promotion, National Institute of Public Health Cpresent address: Depantment of Nutrition Education National Iustiture of Health and Nutrition
3)Department of Exercise Sports and Health Sciences, The University of Tokyo
(present address: Japan Child and Family Research Institute)
Abstract
Background: In Japan, stature is higher in northern/eastern part than southern/western part within a country. In growth assessment in infancy and childhood, there is an argument concerning whether it is adequate or not to assess growth of children in Okinawa Prefecture by National Growth Standard in childhood. We investigated growth data of the Yaeyama Islands, located 600km south-west of Okinawa Main Island and compared with National Growth Standard.
Methods: Growth data of 593 infants (289 boys and 304 girls) born between September 1995 through December 1996 were gathered through 4, 10, 18 and 39 months health check-ups, and were analyzed in this study by cross-sectional. Mean value of each age group was calculated and compared with that of National Growth Standard of Japan based on survey by the Ministry of Health Labour and Welfare in 2000 (MHLW-2000).
Results: Boys were heavier in weight at 3, 10, 17 and 18 months of age and longer in stature in 3 and 17 months of age with statistical significance (p<0.05). Girls were heavier in weight at 3, 4 and 17 months of age and higher in stature at 17 months and lower in stature in earlier half of 3 years of age with statistical significance (p<0.05).
Conclusion: Our study clarified that physique of children in the Yaeyama Islands is no smaller than national standard under age of 2 years, getting smaller after 3 years of age.
keywords: postnatal growth, children, child health service, population characteristics, reference growth curve
(accepted for publication, 1st October 2012)
Noriko Kato
2-3-6 Minami, Wako-shi, Saitama, 351-0197, Japan. T e l: +81-48-458-6191
Fax: +81-48-469-3716 E-mail: kato@niph.go.jp
standard is not always useful in some region like Okinawa Prefecture. Mean birth weight of Okinawa Prefecture was 3.00kg in the year 2000 compared to 3.03, mean birth weight of all Japan [11]. As shown in Table 1, weight and stature of Okinawa children are significantly smaller than all Japan by Annual Report on School Health Statistics [9]. It suggests small physique of children in Okinawa Prefecture. If the region is far more distant from Japan Mainland compared with Okinawa Mainland, it is assumed that we can find more difference in child physique from national growth standard than children in Okinawa Prefecture, major population of which lives in Okinawa Mainland. So we can make further insight into the regional difference in child growth.
In the present study, we investigated growth data of the Yaeyama Islands, located 600km south west of Okinawa Main Island and compared this with National Growth Standard.
Ⅱ.Materials and Methods
1.Subjects and anthropometry
The present study was conducted in the Yaeyama Islands, which is located 600km south west of Okinawa Main Island. It is inhabited by total of 50,577 people. It covers the area of 592km2.
593 infants born between September 1995 through December 1996 were followed up to 3 years of age with regular check-up protocol in regional maternal and child health service program. The numbers of infants born in the Yaeyama Islands were 614 in 1995 and 672 in 1996 respectively. So, estimated number of babies born in the period corresponding to present study is 977. Therefore present study covers 60.7% of infants born in the area. Regular health checkups of children in the Yaeyama Islands
are carried out in the early infantile period, where babies at 3 or 4 months of age are gathered, and at late infantile period, where babies at 9 or 10 months of age are gathered. For regular health checkups at the age of one year and a half, children at 17 or 18 months of age are gathered. At three-year-old health checkups, children with the age of earlier half of three years are gathered. We divided age groups into every month before 2 years of age and every half a year after 2 years of age, in concordance with national growth survey. Background of cases is shown in Table 2. Background of present study was more alike to Okinawa Prefecture than all Japan.
All measurements were carried out by trained nurses, whose techniques were standardized according to procedure described in the manual of national survey by Ministry of Health and Welfare in 2000 (MHLW-2000) [10]. Body weight was measured to the nearest 10g, and supine length or standing height to the nearest 0.1cm. Body stature was measured in supine position under 2 years of age, and in standing position over 2 years of age.
2.Analysis
Growth data of 593 children were analyzed by cross-sectional. Measurement data of weight and stature were divided into age groups which were used in the calculation of National Growths Standard [10]. Mean value of each age group using means procedure of the SAS software package version 9.2 (SAS Institute, Cary, NC, USA), and was compared with that of National Growth Standard of Japan based on survey by Ministry of Health Labor and Welfare in 2000 (MHLW-2000). For testing statistical significance of mean value, Student's t-tests were carried out.
3.Ethical commitment
The study was performed following the guidelines of Ethical Committee of National Institute of Public Health. All
the data were analyzed anonymously and dealt with using ID numbers. The data were the part of the findings from regular health check-ups by municipal government and the analysis was done under the permission of Child Health Association of Okinawa Prefecture.
Ⅲ.Results
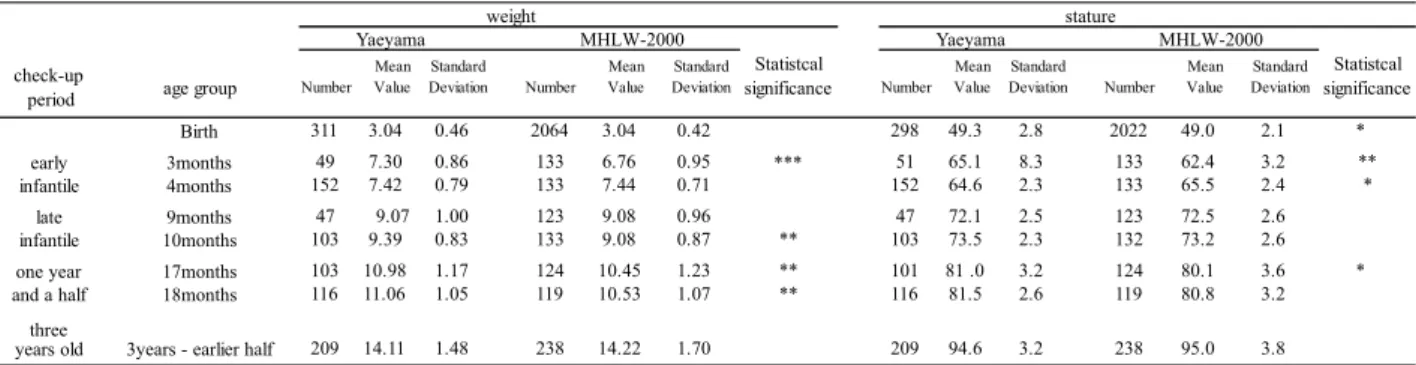
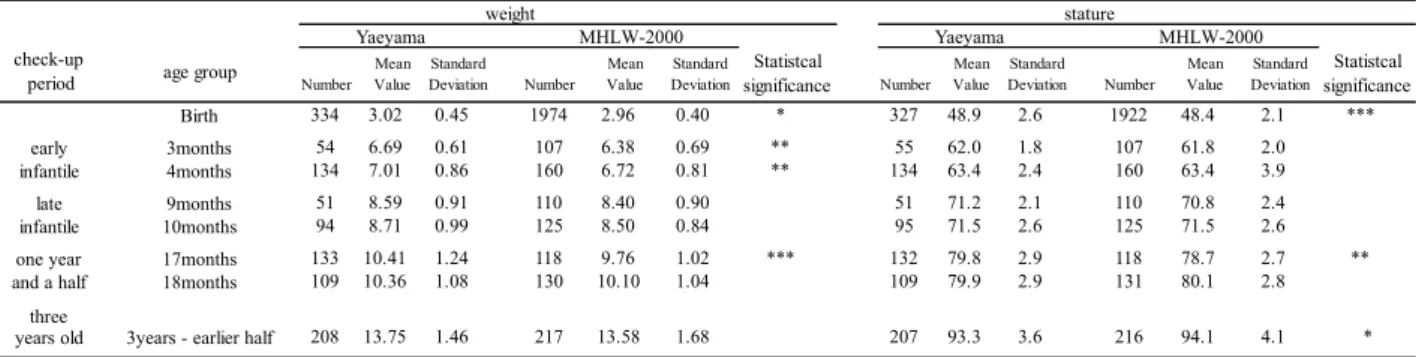
The mean and standard deviation of weight and stature of each age group were shown along with the MHLW 2000 value, in Tables 3 for boys and in Tables 4 for girls.
Table 2 Background of the cases
For male weight, mean values were significantly larger than national growth standards at 3, 10, 17 and 18months of age. They were almost equal at birth. They were smaller than national growth standard without statistical significance at 4 and 10 months of age and at three-year -old health check-ups (Table 3).
For male stature, mean value were significantly larger than national growth standards at birth, at 3 and 17 months of age. They were larger without statistical significance at 4 months of age, and were smaller without statistical significance at 9 months of age and at three-year-old health check-ups (Table 3).
For female weight, mean values were significantly larger than national growth standards at birth, at 3, 4 and 17 months of age and at three-rear-old health checkups. They were larger without statistical significance at 9, 10 and 18 months of age (Table 4).
For female stature, mean values were significantly larger than national growth standards at birth and at 17 months of age. They were larger without statistical significance at 3 and 9 months of age. They were almost equal at 4 and 10 months of age. They were smaller without statistical significance at 18 months of age and significantly smaller at three-year-old health check-ups (Table 4).
Ⅳ.Discussion
Our study clarified that physique of children in Yaeyama Island is no smaller than national standard under age of 2 years. On the othen hend, vital statistics of Japan shows that the mean birth weight of Okinawa Prefecture is 3.00kg, 0.03 kg smaller than the mean of all Japan which is 3.03kg, as generally commented. Present study covered 60.7% of births of corresponding period. So we can stare from the results that children under 2 years of age in the Yaeyama Islands are no smaller than all Japan.
At the age group of earlier half of 3 years, mean weight for boys and mean stature for both boys and girls are smaller.
School Health Statistics of Japan (2000) shows regional difference [12]. As shown previously in Table 1, both boys and girls show smaller mean value in Okinawa Prefecture than all Japan. This suggests that children who are younger than two years of age are no smaller in Yaeyama/Okinawa Prefecture than all Japan, but as the age goes up they get gradually smaller. Although the subjects reached to adolescent age now, we have no data of them. If we had data, it would be easier to discuss characteristics of the in habitants of the Yaeyama Islands.
The mean stature of 4 months old Yaeyama boy (64.5cm) was smaller than that of 3 months old (65.1cm). Children are brought to earlier infantile health checkups on either 3 months of age or 4months of age. So 54 cases measured at 3 months of age and 152 cases measured at 4 months of age are wholly different children so that the smaller mean value at 4 months of age than which at 3 months of age possibly occurs. Similarly, the mean weight of 18 months old Yaeyama girls (10.36kg) was smaller than that of 17 months old (10.41kg). Children are brought to one year and a half health checkups on either 17 months of age or 18 months of age. So 113 cases measured at 17 months of age and 109 cases measured at 18 months of age are wholly different children meaning that the smaller mean value at 18 months of age compared with at 17 months of age possibly occurs. Okinawa Prefecture is far distance from major Islands of Japan, and also Yaeyama Islands are with more distance than Main Island of Okinawa. It is considered that people in Okinawa Islands are genetically isolated from major island of Japan, a part of the reason for regional difference is considered to be genetic one. Shinya [13] points out the necessity of considering genetic differences of school children in Okinawa Prefecture for the assessment of obesity.
However, near half of inhabitants of Yaeyama Island moved from other areas of Japan, so, cases of present study are genetically mixed. Statistics in Ishigaki City [14] show social increase in population. Growth of the Yaeyama Islanders may show different profile from present study. Although considering that, the results of present study figured out the characteristics of the growth of children living in Yaeyama Islands of Okinawa Prefecture.
In Great Britain, physique of children is said to be affected by social factors rather than regional one [15]. Also many reports mention that growth of children differs regionally as well as socio-economically [3,4]. Regional and socio-economical factors can not be discussed separately. Growth of early childhood is effected by intrauterine condition [16], and also birthweight has prolonged effect to 3 years of age and more [17]. Health states monitoring of children are necessary from neonatal period to later ages. Present study is limited because there is a sampling bias which occurred from voluntary attendance to the regular health check-ups. Moreover, only a part of them were followed up to three years of age, making the bias stronger. Parents who bring their children to health checkups and continue visiting until three years of age may be strongly interested in health of their families, which might lead to firm or large physique of their children. Besides the limitation, present study outlined child growth in the Yaeyama Islands, which provides insight into the regional differences in the growth of Japanese children.
In conclusion, children of Yaeyama Islands are no smaller than national standard before the age of 2 years, but they get smaller after 3 years of age. Regional difference in growth of children was identified between the Yaeyama Islands and all Japan. Genetic factors suggested to affect regional difference. As regional difference in the growth in children was identified between the Yaeyama Islands and all Japan, genetic factors should be further studied.
Acknowledgements
We thank Ms. Morita from the National Institute of Public Health for her technical assistance. This research was supported by grant of Research on Children and Families (H10-CF-007) from the Ministry of Health, Labour and Welfare of Japan.
References
[1] Eveleth PB, Tanner JM. Worldwide variation in human growth. 2nd
edition. Combridge; Cambridge University
Press; 1991.
[2] Donma MM, Donma O. Infant feeding and growth: a study on Turkish infants from birth to 6 months. Pediatrics International. 1999;41(5):542-8.
[3] Li Y, Guo G, Shi A, Li Y, Anme T, Ushijima H. Prevalence and correlates of malnutrition among children in rural minority areas of China. Pediatrics International. 1999; 41(5):549-56.
[4] Norgan NG. Changes in patterns of growth and nutritional anthropometry in two rural modernizing Papua New Guinea communities. Ann Hum Biol. 1995; 22(6):491-513.
[5] Gernaat HB, Dechering WH, Voorhoeve HW. Physical growth of children under five years of age in Nchelenge Zambia: results from a district survey. Am J Anthropol. 1996;100(4):473-85.
[6] White E, Wilson A, Greene SA, Berry W, McCowan C, Cairns A, et al. Growth screening and urban deprivation. J Med Screen. 1995;2(3):140-4.
[7] Vasulu TS. Genetic structure of a tribal population: anthropometric differences between regions and settlements among the Yanadi. Ann Hum Biol. 1994; 21(2): 127-44.
[8] Kuczmarski RJ, Ogden CL, Grummer-Strawn LM et al. CDC growth charts: United States. Adv Data. 2000: 8(314):1-27.
[9] Ministry of Education, Culture, Sports, Science and Technology. School Health statistics of Japan. 2000. [10] Ministry of Health, Labour and Welfare: National
Growth Standard in childhood. 2000.
[11] Yokoya M. Graphic variation in the body size of Japanese students and its analysis by mesh climate data. Jpn J Nutrition Dietetics. 2010;68(4):263-9.
[12] Statistics and Information Department, Ministry of Health, Labour and Welfare Vital Statistics of Japan. 2001. Tokyo: Ministry of Health Labour and Welfare; 2003.
[13] Shinya N. Examination of screening method for obese school children and adolescents in Okinawa and its application. Minzoku Eisei. 1988;64(4):217-33.
[14] Ishigaki Municipal Government. Statistics in Ishigaki City 2010.
[15] Mascie-Taylor CG, Boldsen JL. Regional and social analysis of height variation in a contemporary British sample. Ann Hum Biol. 1985;12(4):315-24.
[16] Ohmi H, Hirooka K, Mochizuki Y. Fetal growth and the timing of exposure to maternal smoking. Pediatrics International. 2002;44(1):55-9.
[17] Tanaka T, Matsuzaki A, Kuromaru R et al. Association between birthweight and body mass index at 3 years of age. Pediatrics International. 2001;43(6):641-6.