REVIEW ARTICLE
Effect of resistant starch type 4 from different starch sources on the
physical properties and palatability of bread
Ryoko Shimada
1,2,*, Miki Yoshimura
1,21School of Human Science and Environment, University of Hyogo, 1-1-12 Shinzaike-Honcho, Himeji, Hyogo, Japan 2Research Institute for Food and Nutritional Science, University of Hyogo
Received: 16 September 2020 / Accepted: 3 December 2020 © Japanese Society of Biorheology 2021
Abstract Resistant starch (RS) displays physiological
properties similar to that of dietary fiber. In this study, the physical properties and palatability of bread made with RS type 4 (RS-4, chemically modified starch) were evaluated. Distarch phosphate potato starch, distarch phosphate rice starch, distarch phosphate tapioca starch, phosphated tarch phosphate sweet potato starch, and phosphated dis-tarch phosphate wheat sdis-tarch were the sources. Wheat flour was replaced with 20% (w/w) RS-4, and the bread was thereby considered as RS-4 added bread. Bread without RS-4 was the control bread. RS-4 added loaves of bread had less specific volume than the control bread. The hard-ness of RS-4 added bread samples was also higher than that of the control bread. It was observed using a scanning elec-tron microscope (SEM) that RS-4 was not gelatinized in bread. However, RS-4 added bread samples obtained over-all acceptability comparable to that of the control bread in the sensory evaluation. It was concluded that differences in the sizes of starch particles added to the bread did not affect palatability. The RS-4 bread with potatoes starch appeared to cause the hardness of the crumb during baking; suggest-ing that RS-4 derived from cereals would be more suitable for use in bread.
Keywords resistant starch, chemically modified starch,
bread, sensory evaluation, palatability
1. Introduction
Resistant starch (RS) is now defined as that fraction of dietary starch, which escapes digestion in the small intes-tine [1] and passes to the colon to be fermented by the microbiota [1–3]. RS can be divided into five types [1–3].
RS type-1 (RS-1) is physically inaccessible because of its location in the food, RS type-2 (RS-2) escapes digestion because of its granular structure, RS type-3 (RS-3) is retro-graded starch, RS type-4 (RS-4) is chemically modified starch, and RS type-5 (RS-5) is the amylose-lipid complex. The beneficial physiological effects of RS are similar to that of dietary fiber. RS-4 inhibits the rapid post-meal rise in blood glucose and insulin [4, 5], and the gastrointestinal hormones, PYY, and GLP-1, which are related to feeding suppression and increased insulin secretion [6, 7]. It increases the bile acid-binding capacity and bioavailability of minerals [8]. RS-4 can be prepared from a variety of starches. RS-4 is used in processed foods to improve physi-cal properties. Therefore, RS-4 can be added to processed foods as an ingredient for increasing dietary fiber intake.
The average intake of bread (excluding pastries) for adult males and females was 36.0 g/day in Japan. 36.0 g/day implies that six slices of bread are eaten every two days. The addition of RS-4 to bread can compensate for the lack of dietary fiber intake. There have been reports on bread with added RS-4 [9–14]. However, there are only a few reports on the comparative study of the physical properties and palatability of bread with RS-4 obtained from different starches. In this study, we investigated the effect of adding 20% RS-4, a cross-linked starch of various starches, to the bread by analyzing the physical properties and palatability.
2. Materials and Methods
2.1 Materials
The ingredients used for bread making were flour for bread (protein content of 13 g/100 g, Nisshin Foods Co., Ltd., Tokyo), instant dry yeast (Super Camellia Dry Yeast, Nisshin Foods Co., Ltd., Tokyo), sucrose (Nippon Beet
Sugar Manufacturing Co., Ltd., Tokyo), cooking salt (The Salt Industry Center of Japan, Tokyo), shortening (Nisshin Foods Co., Ltd., Tokyo), and gluten (Matsutani Chemical Industry Co., Ltd., Itami). RS-4, a cross-linked starch phos-phate, was distarch phosphate potato starch (DP-PS; Ingre-dion Japan Co., Ltd.,, Tokyo), distarch phosphate rice starch (DP-RS; Ingredion Japan Co., Ltd.,, Tokyo), distarch phos-phate tapioca starch (DP-TS; Matsutani Chemical Industry Co., Ltd., Itami), phosphated distarch phosphate sweet potato starch (PDP-SS; Matsutani Chemical Industry Co., Ltd., Itami), and phosphated distarch phosphate wheat starch (PDP-WS; Ingredion Japan Co., Ltd.,, Tokyo) (Table 1). These RS-4 are approved as food additives in Japan. 2.2 Bread-making
The method was used as previously reported [7, 9]. The proportions of the bread ingredients are listed in Table 2. The bread was made using the standard course for bread (kneading, fermentation, and baking; the whole process takes about 4 h) using the bread machine (SD-BMT1000, Panasonic Co., Ltd., Tokyo). The 100% flour bread was considered as the control bread. In the modified bread, RS-4 was used as a replacement for 20% of the flour. RS-4 added bread had the same amount (6.5 g) of gluten as the control bread. Bread cooled for 1 h at room temperature after bak-ing were packed into polyethylene bags and stored at 20°C. After storage for 24 h, the bread was measured.
2.3 Measurement of particle size distribution
Particle size distribution was measured on a volume-weighted basis by laser diffraction method (Laser Micro-nizer LMS-3000, Malvern Instruments Ltd., UK). The method was used with a compressed air pressure of 0.1 MPa. The refractive index was selected the default auto-matic calculation; flour (1.80), DP-PS (1.40), DP-RS (1.80), DP-TS (1.42), PDP-SS (1.42), PDP-WS (1.42). The span of the size distribution is given by (d90–d10)/d50. The index for evaluating the width of the particle size distribution is given by d80/d20.
2.4 Scanning electron microscopy of flour and bread The morphology of the starch and bread was imaged
using SEM (JCM-5000, JEOL Co., Ltd., Tokyo). The bread samples were freeze-dried. The starch and bread samples were mounted on an aluminum stub using double-sided carbon adhesive tapes and sputter-coated with gold before imaging. Micrographs were captured at an accelerating voltage of 10 kV. The observation was carried out at a mag-nification of 500× for bread and 1000× for starch.
2.5 Specific volume
The specific volume (cm3/g) was determined by measur-ing the weight of the bread and the volume by the rapeseed displacement method [15] (n = 5).
2.6 Hardness of bread crumb
The hardness of bread was measured using a creep meter (REII-3305B, Yamaden Co., Ltd., Tokyo). The bread was sliced at 20 mm thickness, and a 20 mm × 20 mm square was cut from the center of each slice. The maximum stress as hardness was measured by compressing the crumbs from 20 mm thickness to 70% thickness with a compression rate of 1 mm/s using a column plunger (diameter of 30 mm). Ten samples were measured from each baked bread, and the Table 1 Resistant starch-type 4 (RS-4)
Resistant starch-type 4 Phospate (mg/100 g) Dietary fiber (g/100 g)
Distarch phosphate potato starch (DP-PS) 401 85.6
Distarch phosphate rice starch (DP-RS) 288 81.9
Distarch phosphate tapioca starch (DP-TS) 480 85.4
Phosphated distarch phosphate sweet potato starch (PDP-SS) 470 82.0
Phosphated distarch phosphate wheat starch (PDP-WS) 349 81.3
Table 2 Ingredients of control bread and resistant starch-type 4 (RS-4) added bread
Ingredients Quantity (g)
Control bread RS-4 added bread
Bread flour 250 200 Resistant starch-type 4 (RS-4) 0 50 Dry yeast 2.5 2.5 Water 165 167.5 Suger 15 15 Salt 5 5
Non-fat dry milk 5 5
Gluten 0 6.5
Shortening 12.5 12.5
Resistant starch-type 4 (RS-4): distarch phosphate potato starch (DP-PS), distarch phosphate rice starch (DP-RS), distarch phosphate tapi-oca starch (DP-TS), phosphated distarch phosphate sweet potato starch (PDP-SS) and phosphated distarch phosphate wheat starch (PDP-WS).
baking process was repeated four times (the total number of samples was 40).
2.7 Color characteristics
The colors of the bread crust and crumb were determined using a colorimeter (ND-300A, Nippon Denki Kogyo Co., Ltd., Tokyo). The diameter of the hole in the measuring head of the colorimeter was 10 mm. The color scale was used to measure the L* (black to white), a* (red to green), and b* (yellow to blue) parameters. The total color differ-ence ΔE between the control bread and each RS-4 added sample of bread were calculated according to the formula:
* 2 * 2 * 2E L a b
where ΔL*, Δa*, and Δb* are the brightness, redness, and yellowness intensity difference from the control bread. ΔE was evaluated according to the standards of the National Bureau of Standards (NBS) [16]. The measurement on 10 samples in each phase was repeated twice to obtain a total of 20 samples.
2.8 Sensory evaluation
RS-4 added bread and control bread were served to 16 students (mean age 21.0 ± 0.8 years) from the University of Hyogo. Sensory evaluation was carried out using bread that was stored for one day after baking. They were cut into 6 pieces 20 mm wide by an electric slicer (E16, Ritter Co., Ltd., Germany). The ends of the bread with more crust were not used in the test, only four pieces close to the center were used, and each of the four pieces was cut into four equal parts and used as a sample. Each panel evaluated the same part of the bread in all six types of bread. To avoid order and position effects, the test samples were placed in the same order as the bread to be eaten, depending on the panel. Panels were evaluated the control bread as a criterion (score value was zero).
For discrimination, the color of crust (light (–3) to dark (+3)), the color of crumb (light (–3) to dark (+3)), softness (hard (–3) to soft (+3)), and powdery touch (powdery (–3) to not powdery (+3)) on a seven-point scale was used. In addition, the scale was based on palatability for color, aroma, taste, texture, and overall evaluation of the five items (dislike (–3) to like (+3)).
2.9 Statistical analysis
All data are presented as mean ± SD. Statistical analyses were performed using Excel 2010 software (Microsoft, Seattle, WA, USA) and Statcel 3 (OMS Publishing, Tokoro-zawa, Japan). Data were analyzed using one-way ANOVA, and significant differences among means were determined by the Tukey–Kramer test. Differences were considered
significant at P < 0.05. The coefficient of correlation was used as the Pearson correlation coefficient.
3. Results and Discussion
3.1 Structure of flours
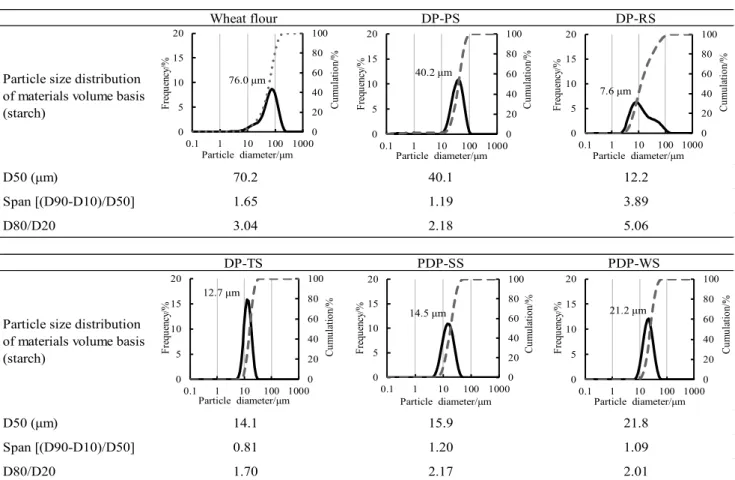
The particle size distribution of the flour is shown in Fig. 1, and the SEM observations of flour and bread are shown in Fig. 2. The average particle size of the control (wheat flour) was the largest at 70.2 μm. The average particle size of RS was the smallest for DP-RS, followed by DP-TS, PDPSS, PDP-WS, and DP-PS. The particle size distribution was the smallest for DP-TS, followed by WS, PDP-SS, DP-PS, and DP-RS. SEM observations indicated that the shape of starch grains in RS was similar to that of the unmodified starch grains before phosphate cross-linking [17].
DP-PS is an oval or spherical simple grain, DP-RS is a polygon, DP-TS is bell-shaped, PDP-SS is a mixture of the small polygon, bell-shaped, and round shape, and PDP-WS has a convex lens shape. SEM observations showed that the particle size variation of DP-RS seemed to be small; however, the size distribution of DP-RS particles was the largest in the sample. This may cause the grains to be attached or not be broken up to single grains for the SEM observation. Except for DP-RS, starch grains were observed to cluster around the average particle size.
3.2 Bread properties
The specific volume of the bread was significantly smaller in RS-4 added bread when compared to control bread (Fig. 3), and the cross-sectional photographs con-firmed that RS-4 added loaves of bread were small (Fig. 4). In this study, RS-4 was used as a cross-linked starch phos-phate. Cross-linked starch is obtained by cross-linking the hydroxyl groups within or between starch molecules, and this inhibits the gelatinization and swelling of starch grains [18]. It has been reported that the specific volume of bread decreased with the addition of cross-linked phosphoric acid starch [9–14]. In this study, SEM observation of RS-4 added bread samples showed that the starch grains of RS-4 did not swell and gelatinize (Fig. 4). It was concluded that the specific volume was smaller than that of the control bread because RS-4 was less likely to swell when baked. It is also considered that the replacement of wheat flour with RS-4 reduced the sugars that the yeast could easily utilize and thereby reduced the expansion due to fermentation.
The hardness of the crumb of bread was significantly harder in RS-4 added samples than in control (Fig. 5(A)). This result suggested that cross-linked phosphoric acid starch did not swell and disintegrate, and the specific vol-ume of the starch was small. Among RS-4 samples, DP-PS
was significantly harder than DP-TS and PDP-WS, and the bread crumbs tended to be harder as the average particle size of RS-4 increased (r = 0.839, P = 0.076). The hardness of the crumb may be influenced by the finer particle size starch that it gets into the gap between the bread cavities, however, the details are unclear and the cause for that requires further investigation. In Control bread, DP-RS, and PDP-WS bread, the hardness of crumb did not change with each baking (Fig. 5(B)), however, in the bread with RS-4 derived from potatoes starch (DP-PS, DP-TS, and PDP-SS), it changed significantly. This is due to the high phosphorus content of RS-4 derived from potatoes and the difference in starch granules between cereals and potatoes. The X-ray diffraction patterns of rice and wheat starch are A-type (crystal form in which starch is densely packed), whereas of potato starch is B-type (crystal form in which voids are filled), and that of sweet potato and tapioca starch are C type (A:B = 80:20, A:B = 90:10, respectively) [19]. A type has lower water sorption capacity than the B type and is said to be less likely to swell even when heated [20]. The phosphorus concentration of the modified starch prepara-tion used in this study was unknown, but the phosphorus content was higher in potatoes starch (DP-TS, DP-PS, PDP-SS) than that of cereals starch (DP-RS, PDP-WS) (Table 1). Therefore, A-type (cereals starch), which has a lower water
absorption capacity, may have had a lower phosphorus con-tent. It is also inferred that the degree of cross-linking and the physical properties differ depending on the phosphorus content in starch. Yasuda et al. [21] reported that the phos-phorus content and physical properties of phosphoric acid-cross linked potato starch were different when the particle size was screened into large, medium, and small particles. The potatoes, especially DP-PS and PDP-SS, contained large and small starch granules. There were no significant correlations between bread hardness variation (SD) and phosphorus content in starch, D50, span, D80/D20. It was inferred that there was a combined effect in the starch crys-tal structure, phosphorus content, and particle size influ-enced the variation in hardness of the crumb of the potato-derived RS-4 added bread.
3.3 Measurement of the surface color
Table 3 displays the color characteristics of the bread crusts and crumbs. In crust color, L* and b* were higher in DP-RS, PDPSS, and PDP-WS bread than in control. ΔE of DP-RS, PDP-SS, and PDP-WS bread were in the “appreci-able (ΔE 3.0 to 6.0)” range. DP-PS and DP-TS bread were in the “noticeable (ΔE 1.5 to 3.0)” range. In crumb color, L* of DP-RS bread was higher than that of the control,
Wheat flour DP-PS DP-RS
Particle size distribution of materials volume basis (starch)
D50 (μm) 70.2 40.1 12.2
Span [(D90-D10)/D50] 1.65 1.19 3.89
D80/D20 3.04 2.18 5.06
DP-TS PDP-SS PDP-WS
Particle size distribution of materials volume basis (starch) D50 (μm) 14.1 15.9 21.8 Span [(D90-D10)/D50] 0.81 1.20 1.09 D80/D20 1.70 2.17 2.01 0 20 40 60 80 100 0 5 10 15 20 0.1 1 10 100 1000 Cu m ul ati on /% Fre qu en cy /% Particle diameter/μm 76.0 μm 0 20 40 60 80 100 0 5 10 15 20 0.1 1 10 100 1000 Cu m ul ati on /% Fre qu en cy /% Particle diameter/μm 40.2 μm 0 20 40 60 80 100 0 5 10 15 20 0.1 1 10 100 1000 Cu m ul ati on /% Fre qu en cy /% Particle diameter/μm 7.6 μm 0 20 40 60 80 100 0 5 10 15 20 0.1 1 10 100 1000 Cu m ul ati on /% Fre qu en cy /% Particle diameter/μm 12.7 μm 0 20 40 60 80 100 0 5 10 15 20 0.1 1 10 100 1000 Cu m ul ati on /% Fre qu en cy /% Particle diameter/μm 14.5 μm 0 20 40 60 80 100 0 5 10 15 20 0.1 1 10 100 1000 Cu m ul ati on /% Fre qu en cy /% Particle diameter/μm 21.2 μm
Fig. 1 Particle size distribution of wheat flour and resistant starch-type 4 (RS-4). DP-PS: distarch phosphate potato starch, DP-RS: distarch phos-phate rice starch, DP-TS: distarch phosphos-phate tapioca starch, PDP-SS: phosphos-phated distarch phosphos-phate sweet potato starch, PDP-WS: phosphos-phated distarch phosphate wheat starch.
DP-PS, and DP-TS bread. ΔE of DP-PS and DP-TS bread were “slight (ΔE 0.5 to 1.5)” range, ΔE of SS, PDP-WS bread were “noticeable” range and ΔE of DP-RS bread were “appreciable” range. Differences in crust color have also been observed in previous reports [9]. The browning reactions of the crust are non-enzymatic caramelization and amino-carbonyl reactions, both of which involve sugars [22]. The substitution of 20% of the wheat flour with RS-4 might have resulted in a difference in the crust color after calcination due to the reduced amount of available sugars. 3.4 Sensory evaluation
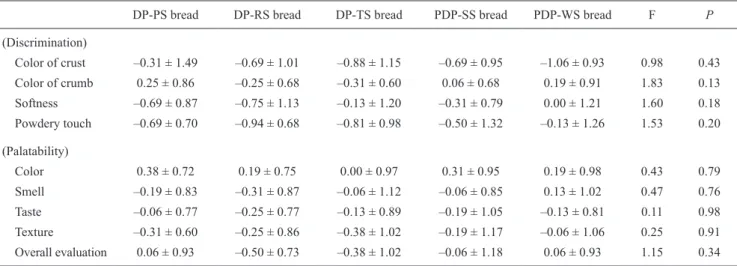
The results of the sensory evaluation are shown in Table 4. RS-4 added bread samples did not differ in terms of dis-crimination and palatability. It was suggested that differ-ences in the size of starch particles did not affect the
(A)
wheat flour DP-PS DP-RS
DP-TS PDP-SS PDP-WS (B)
Control bread DP-PS bread DP-RS bread
DP-TS bread PDP-SS bread PDP-WS bread
Fig. 2 Scanning electron micrographs of wheat flour, RS-4 and breads. (A) SEM of starch (10 kV, ×1000), (B) SEM of dried bread (10 kV, ×500). DP-PS: distarch phosphate potato starch, DP-RS: distarch phosphate rice starch, DP-TS: distarch phosphate tapioca starch, PDP-SS: phos-phated distarch phosphate sweet potato starch, PDP-WS: phosphos-phated distarch phosphate wheat starch.
0.0 1.0 2.0 3.0 4.0 5.0 6.0 Control
bread DP-PSbread DP-RSbread DP-TSbread PDP-SSbread PDP-WSbread
Sp eci fic lo af v ol um e (cm 3/g ) a b b b b b
Fig. 3 Specific loaf volume of control bread and resistant starch-type 4 (RS-4) added bread. Significant differences (P < 0.05) are indicated by different letters. Mean values ± SD (n = 5). DP-PS: distarch phos-phate potato starch, DP-RS: distarch phosphos-phate rice starch, DP-TS: distarch phosphate tapioca starch, PDP-SS: phosphated distarch phos-phate sweet potato starch, PDP-WS: phosphos-phated distarch phosphos-phate wheat starch.
appearance and palatability of the bread. The color of the crust was “appreciable (ΔE 3.0 to 6.0)” for DP-RS, PDP-SS, and PDP-WS bread and “noticeable (ΔE 1.5 to 3.0)” for DP-PS and DP-TS bread; however, could not be distin-guished between these RS-4 bread in sensory evaluation. DP-RS and DP-TS bread were rated negative for crumb color. Although the results of color measurements and sen-sory evaluations were not consistent, the human sensen-sory evaluation suggested that the color differences due to differ-ences in RS-4 had little effect. RS-4 added bread samples were significantly harder than the control bread, and DP-PS bread was significantly harder than DP-TS and PDP-WS bread in the hardness measurements; however, no differ-ences were found between the different RS-4 bread in human sensory evaluation. It has been reported that cross-linked phosphoric acid starch results in a powdery touch because of the control of the gelatinization and swelling of starch grains [10]. There was no significant difference
between RS-4 added bread samples. Although it was assumed that DP-RS would be difficult to feel powdery because of its small average particle size, the PDP-WS bread was rated as the most powdery to touch. This is because the number of starch particles per gram was high due to the small average particle size, and more residual starch grains were observed than in the other breads. Since DP-PS and PDP-SS had higher phosphorus content and die-tary fiber than other starches, the crystalline structure of DP-PS and PDP-SS may be larger than that of other starches. DP-PS and PDP-SS bread felt more powdery to touch when mixed with bread.
In terms of palatability, bread color was rated + (like) except for the DP-TS, which tended to be preferred over the control bread’s baking color. The results were comparable to those of the control bread in terms of aroma, taste, and texture. In the overall evaluation, the PDP-WS and DP-PS bread were +0.06, PDP-SS bread was –0.06, DP-TS bread
Control bread DP-PS bread DP-RS bread DP-TS bread PDP-SS bread PDP-WS bread
Fig. 4 Appearance of control bread and resistant starch-type 4 (RS-4) added bread. DP-PS: distarch phosphate potato starch, DP-RS: distarch phosphate rice starch, DP-TS: distarch phosphate tapioca starch, PDP-SS: phosphated distarch phosphate sweet potato starch, PDP-WS: phos-phated distarch phosphate wheat starch.
0.0 0.2 0.4 0.6 0.8 1.0 1.2 1.4 1.6 Control
bread DP-PSbread DP-RSbread DP-TSbread PDP-SSbread PDP-WSbread
H ar dn ess (× 10 4, N /m 2) n.s. n.s. n.s. a bc c ab ab ab a a a ab b b C ■average (n=40) ■first time (n=10) ■second time (n=10) ■third time (n=10) ■fourth time (n=10) A AB B AB B
Fig. 5 Hardness of control bread and resistant starch-type 4 (RS-4) added bread. Significant differences (P < 0.05) are indicated by different let-ters. Mean values ± SD. DP-PS: distarch phosphate potato starch, DP-RS: distarch phosphate rice starch, DP-TS: distarch phosphate tapioca starch, PDP-SS: phosphated distarch phosphate sweet potato starch, PDP-WS: phosphated distarch phosphate wheat starch.
was –0.38, and DP-RS bread was –0.50. In DP-RS bread, the hard and powdery texture was hypothesized to be the reason why people did not like it. However, in palatability, there was no significant difference between RS-4 added bread samples, as they were close to the control bread. There might be no problems in the daily ingestion of any of the RS-4 added bread.
4. Conclusions
To increase dietary fiber intake, loaves of bread were baked with 20% cross-linked starch (RS-4) added to differ-ent starch ingredidiffer-ents. The starch grains showed controlled gelatinization and swelling, the specific volume was smaller, and the crumb was harder than that of bread with-out RS-4. The hardness of the crumb increased with the average particle size of RS-4. The sensory evaluation did not show any difference in the firmness or palatability of the bread, suggesting that the addition of any starch-derived Table 3 Color of control bread and resistant starch-type 4 (RS-4) added bread
L* a* b* ΔE Crust Control bread 53.71 ± 5.18b 13.97 ± 3.25 31.44 ± 2.36b — DP-PS bread 55.84 ± 3.69ab 13.23 ± 3.85 32.12 ± 2.28ab 2.35 DP-RS bread 57.70 ± 4.49a 13.79 ± 3.24 32.88 ± 2.09a 4.25 DP-TS bread 56.00 ± 3.94ab 13.85 ± 2.97 32.17 ± 2.25ab 2.41 PDP-SS bread 57.95 ± 4.05a 12.24 ± 4.18 32.97 ± 1.82a 4.82 PDP-WS bread 57.31 ± 3.91a 13.49 ± 2.79 32.93 ± 1.54a 3.92 Crumb Control bread 65.56 ± 3.32b –2.61 ± 1.12 5.56 ± 0.88 — DP-PS bread 66.15 ± 3.26b –2.76 ± 1.22 6.08 ± 1.38 0.80 DP-RS bread 69.22 ± 2.25a –2.89 ± 1.06 5.79 ± 1.07 3.68 DP-TS bread 65.95 ± 6.80b –2.87 ± 1.22 5.98 ± 1.02 0.63 PDP-SS bread 67.05 ± 2.60ab –2.85 ± 1.25 6.18 ± 1.22 1.63 PDP-WS bread 67.40 ± 2.63ab –3.13 ± 1.10 5.97 ± 0.81 1.96
Significant differences (P < 0.05) are indicated by different letters. Mean values ± SD (n = 20). DP-PS, distarch phosphate potato starch; DP-RS, distarch phosphate rice starch; DP-TS, distarch phosphate tapioca starch; PDP-SS, phosphated distarch phosphate sweet potato starch; PDP-WS, phosphated distarch phosphate wheat starch.
Table 4 Sensory evaluation of control bread and resistant starch-type 4 (RS-4) added bread
DP-PS bread DP-RS bread DP-TS bread PDP-SS bread PDP-WS bread F P
(Discrimination) Color of crust –0.31 ± 1.49 –0.69 ± 1.01 –0.88 ± 1.15 –0.69 ± 0.95 –1.06 ± 0.93 0.98 0.43 Color of crumb 0.25 ± 0.86 –0.25 ± 0.68 –0.31 ± 0.60 0.06 ± 0.68 0.19 ± 0.91 1.83 0.13 Softness –0.69 ± 0.87 –0.75 ± 1.13 –0.13 ± 1.20 –0.31 ± 0.79 0.00 ± 1.21 1.60 0.18 Powdery touch –0.69 ± 0.70 –0.94 ± 0.68 –0.81 ± 0.98 –0.50 ± 1.32 –0.13 ± 1.26 1.53 0.20 (Palatability) Color 0.38 ± 0.72 0.19 ± 0.75 0.00 ± 0.97 0.31 ± 0.95 0.19 ± 0.98 0.43 0.79 Smell –0.19 ± 0.83 –0.31 ± 0.87 –0.06 ± 1.12 –0.06 ± 0.85 0.13 ± 1.02 0.47 0.76 Taste –0.06 ± 0.77 –0.25 ± 0.77 –0.13 ± 0.89 –0.19 ± 1.05 –0.13 ± 0.81 0.11 0.98 Texture –0.31 ± 0.60 –0.25 ± 0.86 –0.38 ± 1.02 –0.19 ± 1.17 –0.06 ± 1.06 0.25 0.91 Overall evaluation 0.06 ± 0.93 –0.50 ± 0.73 –0.38 ± 1.02 –0.06 ± 1.18 0.06 ± 0.93 1.15 0.34 Mean values ± SD (n = 16). Evaluated the control bread as a criterion (score value was zero). DP-PS, distarch phosphate potato starch; DP-RS, distarch phosphate rice starch; DP-TS, distarch phosphate tapioca starch; PDP-SS, phosphated distarch phosphate sweet potato starch; PDP-WS, phosphated distarch phosphate wheat starch.
RS-4 to the bread would not cause problems in the daily ingestion. The addition of RS-4 from potatoes starch resulted in the hardness of the crumb during baking there-fore, it was suggested that RS-4 derived from cereals would be more suitable for use in the bread.
Acknowledgements The authors would like to thank Ms. Kyoko Nishimura from the University of Hyogo for the experimental work. This study was approved by the Ethics Committee of the University of Hyogo (Approval No. 209).
References
1. Sajilata MG, Singhal RS, Kulkarni PR. Resistant starch—a review. Comprehensive Reviews in Food Science and Food Safety. 2006; 5: 1–17.
2. Lockyer S, Nugent AP. Health effects of resistant starch. Nutrition Bulletin. 2017; 42: 10–41.
3. Yong CS, Clodualdo CM. Resistant Starch: Sources, Applications and Health Benefits. WILEY Blackwell; 2013.
4. Tachibe M, Oga H, Nishibata T, Ebihara K. Resistant starch type 4, cross-linked phosphate starch and hydroxypropyl distarch phosphate attenuate rapid glycemic response in men. Jpn Pharma-col Thre. 2010; 38: 731–6.
5. Al-Tamimi EK, Seib PA, Snyder BS, Haub MD. Consumption of cross-linked resistant starch (RS4XL) on glucose and insulin responses in humans. J Nutr Metab. 2010. doi: 10.1155/2010/ 651063
6. Shimada R, Yoshimura M, Murakami K, Ebihara K. Plasma con-centrations of GLP-1 and PYY in rats fed dietary fiber depend on the fermentability of dietary fiber and respond to an altered diet. Int J Clin Nutr Diet. 2015; 1: 102. doi.org/10.15344/ijcnd/2015/ 103.
7. Shimada R, Tachibe M, Ebihara K. Type 4 resistant starch (RS-4) enriched breads increase portal vein plasma GLP-1 and PYY con-centrations in rats. Jpn Pharmacol Ther. 2016; 44: 1005–11. 8. Aribas M, Kahraman K, Koksel H. Effects of resistant starch type
4 supplementation of bread on in vitro glycemic index value, bile acid-binding capacity, and mineral bioavailability. Cereal Chem. 2020; 97: 163–71.
9. Shimada R, Ebihara K, Yoshimura M. Effect of resistant starch type 4 (RS-4) enriched breads on their physical characteristics and taste palatabilities. Journal of Home Economics of Japan. 2018; 69: 667–75. (in Japanese)
10. Miyazaki M, Van Hung P, Maeda T, Morita N. Recent advances in application of modified starches for breadmaking. Trends Food Sci Technol. 2006; 17: 591–9.
11. Miyazaki M, Maeda T, Morita N. Starch retorogradation and firm-ing of bread containfirm-ing hydroxypropylated, acetylated, and phos-phorylated cross-linked tapioca starches for wheat flour. Cereal Chem. 2005; 82: 639–44.
12. Goesaert H, Leman P, Delcour JA. Model approach to starch functionality in bread making. J Agric Food Chem. 2008; 56: 6423–31.
13. Miller RA, Elyse B. Effect of RS4 resistant starch on dietary fiber content of white pan bread. Cereal Chem. 2017; 94: 185–9. 14. Yeo LL, Seib PA. White pan bread and sugar-snap cookies
con-taining wheat starch phosphate, a cross-linked resistant starch. Cereal Chem. 2009; 86: 210–20.
15. Griswolf RN. The experimental study of foods. Boston: Houthoun Miffin; 1962. p. 525.
16. Judd DB, Wyszecki G. Color in Business, Science and Industry, 3rd Edition. John Wiley & Sons; 1975.
17. Takahashi R, Takahashi K. Production method and utilization characteristics of starch. revision and enlargement Knowledge of Starch Products. Tokyo: Saiwaishobo; 2016. p. 15–37. (in Japa-nese)
18. Waliszewski KN, Aparicio MA, Bello LA, Monroy JA. Changes of banana starch by chemical and physical modification. Carbo-hyd Polym. 2003; 52: 237–42.
19. Hizukuri S, Nikuni J. Study of starch by X-ray diffractometer (2). Japan Society for Bioscience, Biotechnology, and Agrochemistry. 1957; 31: 525–7. (in Japanese)
20. Takahashi R, Takahashi K. “The Science of Starch” revision and enlargement knowledge of Starch Products. Tokyo: Saiwaishobo; 2016. p. 38–111. (in Japanese)
21. Yasuda K, Hironaka K, Koaze H, Yamamoto K. Physicochemical properties of cross-linked fractionated potato starches. Journal of Applied Glycoscience. 2011; 1: 327–35. (in Japanese)
22. Seguchi M, Matsumoto H. Browning reaction in crust. The sci-ence of bread making I: The scisci-ence of the bread making process. Tokyo: Korin; 1997. p. 207–20. (in Japanese)