近畿大学学術情報リポジトリ
59
0
0
全文
(2) 3.2 Materials 3.2.1. and methods. 3.2.2. Diet. preparation. Fish, experimental. 3.2.2.1. Trial 1. 3.2.2.2. Trial 2. 3.2.3. Chemical. analysis. 3.2.4. Statistical. analysis. 3.3. and sampling. Results. 3.3.1. Trial. 1. 3.3.2. Trial. 2. 3.4. Discussion. Chapater 4.1. 4 Dietary. Vitamin. C Requirements. for Juvenile. Pacific. Bluefin. Tuna. Introduction. 4.2 Materials. and methods. 4.2.1. Diet. 4.2.2. Fish, experimental. 4.2.3. Chemical. analysis. 4.2.4. Statistical. analysis. 4.3. preparation design. and sampling. Results 4.3.1. Growth. performance. 4.3.2. Carcass. proximate. 4.3.3. Digestive. 4.3.4. Liver and brain. 4.4. composition. and nutrient. retention. efficiency. organ indices AsA contents. Discussion. Chapter. 5, Partial. or Full. Pacific 5.1. Bluefin. Replacement. of Salmon. Tuna. Egg. Oil with. Fish. Oil and. Soybean. Oil for Juvenile 104. Introduction. 5.2 Materials. 5.3. design. 104 and methods. 104. preparation. 105. 5.2.1. Diet. 5.2.2. Fatty acid and lipid class analysis. 106. 5.2.3. Fish, experimental. 107. design. and sampling. 5.2.3.1. Trial. 1. 107. 5.2.3.2. Trial 2. 107. 5.2.4. Chemical. analysis. 108. 5.2.5. Statistical. analysis. 108. Results 5.3.1. Growth. 108 performa. nce. 108.
(3) B.K.. 5.4. 5.3.2. Proximate. composition,. 5.3.3. Carcass. and liver. 5.3.4. Carcass. lipid class. Discussion. SUMMARY. ACKNOWLEDGEMENTS. REFERENCES. Biswas. :. Formulated diet for juvenile bluefin tuna. glycogen. and biological. fatty acid composition composition. assessment. of digestive. organs.
(4) idX-7MAN. 12. (2 0 1 0 ). CHAPTER. General. Introduction. 1.1 General. 1. and Review. of Literature. Introduction. Pacific bluefin tuna, Thunnus orientalis (Temminck and Schlegel 1844) belongs to scombridae family is some of the biggest and fastest growing fish in the Pacific evolution. It possesses streamlined body to reduce water resistance and conserve energy for trans Pacific migrations. Retractable fins also allow them a free flow of water when navigational changes do not require their use. Most fish are cold-blooded. However; some tuna and the mackerel sharks can maintain their body temperature higher than the ambient temperature. The Pacific bluefin tuna (PBT) is one of highly valued and delicious fish including other tuna species in the world (Tieina et al. 2004). The demand for PBT is increasing all over the world, and Japan represents the largest consumption. Due to meet up the increased consumer demand, world aquaculture production of Atlantic bluefin tuna (ABT, Thunnus thynnus), southern bluefin tuna (SBT, Thunnus maccoyii) and PBT has sharply been increased in a short period (Nakahara 2004) by advanced cage culture technology for ABT in Mediterranean countries, SBT in Australia and PBT in Japan and Mexico. The cage culture of these tunas depends entirely on wild caught juveniles and declared as the fastest growing forms in the world (FAO 2007). Doumenge (2001) has reported that in the future 80% of tuna will come from aquaculture; however, the natural resources of these tunas are not readily available, and supply of juveniles is steadily declining for last few decades and putting threat to the natural stocks day by day (Kurnai 1997, 1998; Sawada and Kumai 2000a; Suzuki 2005). So, it becomes important to develop technology for the production of larvae and juveniles in a sustainable manner. Research on PBT under captivity was initiated in 1970 at Kinki University and the first spontaneous spawning was recorded in 1979; however, it took around 32 years for the successful completion of the life cycle of hatchery reared PBT in the captivity (Sawada et al. 2005). The recent success of breeding and rearing of PBT under captivity in Japan has added to the importance of this species for investigating the growth and development of larvae and juveniles (Miyashita et al. 2001). Production of marine fish larvae and juvenile including PBT in commercial hatcheries still depends on the supply of live prey, such as rotifers, Brachionus plicatilis and Artemia nauplii, Artemia franciscana, yolk sac larvae and minced fish meat of sand lance (SL), Ammodytes pesonatus. However, those practices are difficult, expensive, laborious, time consuming, difficult to maintain efficiency when necessary and often nutritional incompetent (Miyashita 2002; Sawada et al. 2005; Seoka et al. 2008). Therefore, studies have recently been conducted for PBT larvae and juveniles to determine suitable nutrient sources and their digestibility (Biswas et al. 2006a; Takii et al. 2007a, b; Seoka et al. 2007a, b, 2008; Ji et al. 2008). However, a nutritionally balanced formulated diet, is yet to be established. To formulate a nutritionally balanced diet, it is outmost important to figure out suitable macro and micro nutrients which are easily available in the market, enriched with necessary ingredients required for the specific species , easily digestible and cost of those ingredients are reasonable. —74—.
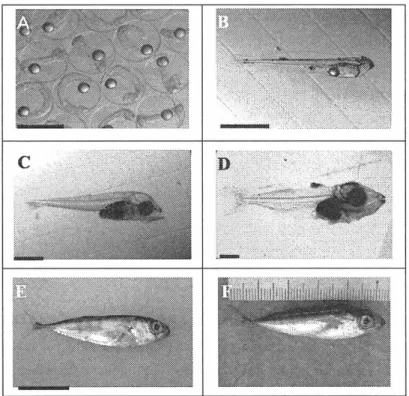
(5) B.K. Biswas : Formulated diet for juvenile bluefin tuna. Therefore,. the present. study. including. comparison. of formulated. nutrients expensive. ingredients. aimed. to find. out the suitable. diet with. hatchery. dietary. practiced. levels feed. of the macro. and partial. and micro. replacement. of. as follows-. 1. dietary. protein. 2. dietary. carbohydrate. sand lance 3. dietary. 4. replacement. and lipid level level. and. compatibility. of formulated. diet. with. traditionally. used. raw. in hatchery. vitamin. C level. of lipid source. with other cheap. 1.2 Review. and commercially. available. sources. of Literature. 1.2.1 Taxonomy The PBT belongs to Scombridae family. The other relatives of this family are yellowfin and albacore tuna, mackerel and bonito. They are powerful swimmers , built for endurance and speed. The family consists of about 55 species in 15 genera and two subfamilies . All species are Scombridae, except butterfly kingfish, Gasterochisma melampus which is the sole member of subfamily Gasterochismatinae . The scientific classification is given bellowKingdom: Animalia Phylum: Chordata Class: Actinopterygii Order: Perciformes Family: Scombridae Genus: Thunnus Species: Thunnus orientalis Binomial name: Thunnus orientalis (Temminck and Schlegel 1844) . 1.2.2 Morphology Typical feature of morphological development of larvae has been shown in Fig . 1.1 accordingly. Morphologically, their body size is large and they have fusiformed body shaped, unique fin shape and scales because of their high speed cruising. The development of swimming organs change in and body shape occur during long period of this growth. In addition , growths are much more rapid than other species and continue to make them larger than other fish. For example , the body size at 30 days after hatching (DAH) of PBT is more than twice than red seabream, Pagrus major and the white trevally, Psuedocaranx dentex reared in the same temperature range. This species regarded as one of the biggest teleost in the Pacific ocean within Scombridae family. The adult PBT has been reported to grow upto maximum length of over 3 m and weight of 550 kg (Foreman and Ishizuka 1990). One more important characters of PBT larvae and juveniles which have big eyes and larger mouth to predate larger sized organisms is clearly shown in the Fig. 1.1.. —75—.
(6) Fig. 1.1. PBT larval and juvenile typical feature of morphological development. Scale bars: A: egg = 1.0 mm; B-C = 1.0 mm; D = 2.0 mm; E = 10.0 mm A: Fertilized egg, ca. 1.0 mm diameter; B: 1 DAH larvae, oil globule, pigment on the base of fin, 3.2 mm TL; C: 9 DAH larvae, 5.5 mm TL, rudiments of the hypural plate and anal fin base, teeth developing in both jaw, big eyes and mouth; D: 17 DAH larvae,17.0 mm TL, complete rays and spines in all fins except the pectorals, fusiform body , E: 25 DAH juvenile, ca. 30.0 mm TL, well developed forked caudal fin F. 33 DAH juvenile, 54.0 mm TL, scale formation in progress, distinct stripe on the body. 1.2.3 Larval and juvenile rearing practice in hatchery Fertilized eggs of PBT were transported by an airlift from the Fisheries Laboratory, Kinki University, Amami-Ohshima,. Kagoshima to the Fish Nursery Center, Kinki University, Uragami,. Wakayama. The eggs were disinfected with diluted 03 solution prior to introducing into larval rearing tank. Hatching percentage and newly hatched larval health was checked. At 2 DAH, rotifer was introduced as first feeding. Fresh water chlorella, Nanochloropsis sp. was added two times a day to maintain enough food for rotifer. From 10 DAH, Anemia nauplii were fed together with rotifer mainly to suppress the size variation of PBT larvae (Miyashita 2002). Newly hatched larvae of Japanese stripped knifejaw, Oplegnathus lasciatus (Temminck and Schlegel) was introduced from 14 to 25 DAH. However, from 22 DAH, we started adjusting the juvenile using a commercial artificial feed usually used for other marine fish in the hatchery (Fig. 1.2). In contrast, the feeding time of rotifer, Anemia and fish larvae is extended in hatchery by observing the larval size variation. In addition, minced SL, locally called -Ikanago" usually used at the same time of our introduction of artificial diet in hatchery and continued until transferred to net —76—.
(7) B.K. Biswas : Formulated diet for juvenile bluefin. cage. This practice Everyday. frequent. has been elaborately observation. described by Miyashita. et al. (2000) and Sawada. was done to see their morphological. ensure their better feeding regime. The temperature. tuna. and digestive. et al. (2005).. organ development. and DO of the rearing tank were maintained. to. at ca. 27°C. and 8.0 mg//, respectively.. Days after hatching (DAH) Fig. 1.2.. Larval and juvenile rearing practice in hatchery.. 1.2.4 Mortality and causes The important obstacles have been reported for mass production of larvae and juvenile due to their inherent mortality. These are categorized into three different stages of larvae and juvenile, e.g. (1) during the first 10 DAH, (2) 14-30 DAH and (3) 30-60 DAH (Miyashita 2002; Sawada et al. 2002). Unsuitable environmental conditions, mismatch of the live feed size (Sawada et al. 2000b), and insufficient nutritional content of the feed are possible factors leading to high mortality during the first period. Larvae from 1 to 4 DAH have very limited swimming ability and so they are transported to the water surface by the current generated by aeration, and adhered to the water surface which causes mortality. Larval sedimentation due to cease of swimming during the night time from 5-10 DAH, causes injuries by the contact with the tank bottom results higher mortality. Also some environmental factors, such as current field, specific gravity of sea water and viscosity, and biological factors, such as body density of larvae (Takashi et al. 2006); swim bladder inflation and swimming ability, have been noted for increased mortality. The next critical period of mortality starts from ca. 14 DAH, at the flexion stage. At this time, PBT initiate cannibalism as in other Scombridae, and their attacks against brother and sisters result in high mortality (Shoji et al. 1997; Shoji and Tanaka 2001). Just before the critical period of cannibalism, foraging organs, such as jaw teeth and other digestive organs develop (Miyashita et al. 1998). After 30 DAH, trauma due to collisions with the wall or net mesh causes a heavy mortality. The —77—.
(8) 12. PY. (2 0 1 0). fish have been reported to respond excessively and panicked to external stimuli such as light intensity, large noise and vibration,. resulting mass mortalities. due to collision with tank walls or net pens (Miyashita. et al.. 2000; Masuma et al. 2003).. 1.2.5 Progress of seedling production It has been very clear that seedling production is entirely depends on the reduction of critical period of larval and juvenile mortality. So far research has been conducted, a few technological approaches are now adopted for example, the use of surface oil film depresses early mortality due to the adhesion of larvae to water surface during first 10 DAH (Miyashita 2002). Vertical downward gravitational sinking velocity of larvae has been reduced by a turbulent flow of aeration in the rearing tank (Kimura et al. 2004). Nursery culture under continuous light is another approach being used to reduce mortality (Ishibashi et al. 2008). Better survival at the beginning of grow-out culture has been reported by enlarging net cage size when juveniles are transferred from the hatchery tanks (Sawada et al. 2005)..
(9) B.K. Biswas : Formulated diet for juvenile bluefin tuna. CHAPTER 2 Dietary Protein and Lipid Requirements. for Juvenile Pacific Bluefin Tuna, Thunnus orientalis. 2.1 Introduction The PBT has recently been regarded as one of the most valuablefish in the world market. The demand for high quality tuna meat is increasing steadily day by day in Japan where it is highly favored as -sashimi and sushi-. Aquaculture production of PBT has increased sharply throughout the world (Nakahara 2004) using suitable cage culture in Japan, Australia, Europe and Mexico. Cage culture of this species has developed entirely on wild caught tuna juveniles; however, the natural resource of tuna is not readily available and the supply of juveniles is declining steadily (Kumai 1998; Sawada and Kumai 2000a). So, it becomes important to develop technology for the production of larvae and juvenile in a sustainable manner. The recent success of breeding and rearing of PBT under captivity in Japan has added to the importance of this species for investigating the growth and development of larvae and juvenile (Miyashita et al. 2001). In recent years, a few studies have been conducted on different biological traits of PBT. However, there is a lack of suitable formulated diet for larvae and juvenile of this species. Production of marine fish larvae and juvenile including PBT in commercial hatcheries still depends on the supply of live prey, such as rotifers and Artemia nauplii, yolk sac larvae and minced SL. However, those practices are difficult, expensive, laborious, time consuming, difficult to maintain efficiency when necessary and often nutritional incomplete (Miyashita 2002; Sawada et al. 2005; Seoka et al. 2008). Therefore, studies have recently been conducted for PBT larvae and juvenile to determine suitable nutrient sources and their digestibility (Takii et al. 2007a, b; Biswas et al. 2006a; Seoka et al. 2007a, b, 2008; Ji et al. 2008). However, a nutritionally balanced formulated diet is yet to be established. Protein requirements vary among species, for example, carnivorous juvenile fish need more dietary protein such as 45% for Atlantic salmon, Salmon salar (Lall and Bishop 1977), 55% for yellowtail, Seriola quinqueradiata. (Takeda et al. 1975), red sea bream, Pagrus major (Yone 1976) and malabar. grouper, Epinephelus malabaricus (Tuan and Williams 2007), and 50% for puffer fish, Takilitgu rubripes (Kanazawa et al. 1980), compared to some other cultured species such as 32-36% for channel catfish, Ictalurus punctatus (Garling and Wilson 1976) and 30% for Nile tilapia, Tilipia nilotica (Wang et al. 1985) for growth and maintenance. Dietary lipid requirements also vary among species on the basis of their feeding habit, stage of life, habitat and so on. Optimum lipid levels have been reported to be 12% for malabar grouper (Tuan and Williams 2007) and 19% for bagrid catfish, Pseudobagrus litivich-aco (Kim and Lee 2005). However, there is no information on the protein and lipid requirements of juvenile PBT. Therefore, the present study was conducted to determine the optimum dietary protein and lipid levels for developing a formulated diet for this species. 2.2 Materials and methods 2.2.1 Diet preparation —79—.
(10) 1 2 -`6-. k*OFE. (2 0 1 0 ). Dietary formula and proximate composition of five isocaloric test diets (D1-D5) are shown in Table 2.1. Raw SL, which is commonly fed to PBT juveniles in Japan, was used as a control. Defatted enzyme treated fish meal (EFM, Profish S.A, Santiago, Chile) and salmon egg oil (Nishin Marine Tech. Co. Ltd, Yokohama, Japan) were used as the main protein and lipid sources, respectively.. Table. 2.1.. Ingredients. and. proximate. compostion. of experimental. diets Diet. Enzyme. treated. Salmon. egg oil'. fish meal'. (1- Starch Vitamin. Dl. D2. D3. D4. D5. 80. 74. 68. 62. 56. 0. 4. 8. 12. 16. 3. 3. 3. 3. 3. 5. 5. 5. 5. 5. 5. 5. 5. 5. 5. 2. 2. 2. 2. mixture3. Mineral. mixture3. Soybean. lecithin. Taurine Feeding. st imul ants4. 2. 2. 2. 2. 2. 0.5. 0.5. 0.5. 0.5. 0.5. -. 2. 4. 6. 8. 2.4. 2.4. 2.4. 2.4. 2.4. 0.1. 0.1. 0.1. 0.1. 0.1. Cellulose Wheat. gluten. APM5 Proximate. analysis. (%, dry matter. SL Sand. Lance. basis). Crude protein. 72.8. 66.8. 61.9. 57.2. 53.3. 73.4. Crude. lipid. 9.2. 14.8. 17.9. 21.9. 27.0. 6.3. Crude. ash. 9.2. 8.8. 8.4. 7.9. 7.8. 14.6. 5.9. 5.7. 5.8. 5.7. 5.8. 21.3. 22.0. 22.0. 22.5. 23.2. Sugar Gross. energy. (kJ/g). Profish S.A, Santiago, Chile, defatted with n-Hexane. 2 Sujiko oily , Nisshin Mar inetech Co. Ltd, Yokohama, Japan. 3 Halver's vitamin and mineral mixtures , (Hal ver, 1957). 4 The mixture of glutamic acid 8 .5 mg, L-histi dine HC I 1-1,0 232. 2Na 200.9 mg. 5 L-Ascorbyl-2-monophosphate. magnesium. 8 mg. and. 20.9. inosiner5'-monophosphate. salt .. After mixing all feed stuffs, 15% tap water was added and moist pellets were prepared using a laboratory pellet machine. Appropriate pellet sizes were adjusted using sieves and stored in a freezer at -20°C until used . The control diet, SL with 73.4% crude protein, 6.3% crude lipid, 14.6% ash and little or no carbohydrate was chopped into small pieces and kept frozen at -20°C until used. The Fatty acid profiles of test diets are shown in Table 2.2.. 2.2.2. Fish,. experimental Juvenile. PBT. Wakayama,. Japan.. into twelve. 15 m3 eight. was designed. design. and sampling. were. obtained. On 25 DAH,. in duplicate. angular. from. individuals tanks. the. Fish. Nursery. with an initial body. at a stocking. density. for each of six treatments.. Initial -80-. weight. Center,. Kinki. University,. Uragami,. of 0.26 g were randomly. distributed. of 200 individuals fish were also. per tank.. sampled. The feeding. and kept frozen. trial at -20.
(11) B.K. Biswas : Formulated diet for juvenile bluefin tuna. and -80°C until analysis. Test diets and SL were fed to fish 6 times daily (05:30, 08:00, 11:00, 14:00, 1600 and 18:00) to apparent satiety for 10 days. The flow-rate of filtered seawater in each tank was adjusted at 30 //min. Table 2.2. Fatty acid composition (%) experimental diets Diet D1. D2. D3. D4. D5. SL. 14:0. 3.9. 3.4. 3.2. 3.2. 2.9. 3.0. 15:0. 0.5. 0.5. 0.6. 0.5. 0.6. 0.7. 16:0. 1 8.3. 15.7. 14.9. 14.0. 13.8. 28.6. 16:1. 4.1. 4.3. 4.3. 4.2. 4.5. 6.4. 17:0. 0.5. 0.5. 0.5. 0.4. 0.4. 0.9. 17:1. 0.5. 0.5. 0.6. 0.6. 0.6. 0.6. 18:0. 5.6. 4.9. 4.6. 4.5. 4.3. 7.7. 18:1n-9. 1 1.3. 11.8. 1 1.9. 12.7. 12.9. 9.5. 18:1n-7. 2.9. 2.7. 2.7. 2.7. 2.7. 3.3. 18:2n-6. 13.0. 9.6. 7.8. 6.7. 6.0. 0.8. 1.5. 1.4. 1.3. 1.3. 1.3. 0.5. 0.8. 1.5. 1.8. 2.0. 2.2. 2.3. 18:3n-3 20:1 20:4n-6. 1.5. 1.4. 1.3. 1.3. 1.3. 0.7. 20:5n-3. 7.3. 10.3. 11.1. 12.6. 13.3. 4.5. 22:5n-6. 2.4. 3.0. 3.2. 3.5. 3.7. 0.9. 22:6n-3. 1 8.2. 19.5. 19.2. 19.4. 18.9. 9.0. 22:6n-3/20:5n-3. 2.5. 1.9. 1.7. 1.5. 1.4. 2.0. En-31. 2 7.0. 31.2. 3 1.6. 33.3. 33.5. 14.0. En-62. 16.9. 14.0. 12.3. 11.5. 11.0. 2.4. 2.6. 2.9. 3.0. 5.8. n-3/n-6. 1.6. Values. represent. En-3: 2 En -6:. 1 8:3n-3,. averages 20:5n-3,. 18:2n-6. ,20:4n-6,. Fig. 2.1. Experimental. were. stored. sampl. es from. each. test diet.. 22:6n-3. 22:5n-6.. eight angular tanks (15 m3).. At the end of the feeding fish per tank. 2.2 of triplicate. at -20°C. trial,. final sampling. for carcass. composition -81-. was. done. analysis. for obtaining. growth. performance.. and the rest of the fish were. stored. Ten at.
(12) 31-1)(1KWW. 12 -=-1. (2 0 1 0 ). -80°C for other analyses . Weight gain (%), specific growth rate (SGR), feed efficiency (FE), condition factor (CF), protein retention efficiency (PRE) and energy retention efficiency (ERE) were calculated by the following formula. Weight gain (%) = 100 x (average weight gain / average initial body weight), where average weight gain = {(final total weight + sampled fish weight) —initial total weight} / average of initial and final number of fish. SGR (%) = 100 x (1nWAnW1) / time (days), where W1 and W2 denote the initial and final weight (g), respectively. FE (%) = 100 x [wet weight gain (g) /dry feed intake (g)]. CF = 100 x (W / L3), where W and L denote wet body weight (g) and fork length (cm), respectively. PRE (%) = 100 x [(final whole body protein - initial whole body protein) / total protein intake]. ERE (%) = 100. GE0W0] / (GEF x total feed intake)], where GE0 and GE1 denote the. initial and final whole body energy concentration of fish, respectively. W0 and W 1 denote the initial and final fish weights (g), respectively. GEF is the gross energy intake. The test diets, initial and final whole body samples were freeze-dried for 24 h prior to energy determination. The freeze-dried samples were then mortared and analyzed directly using an automated oxygen bomb calorimeter (IKA`R-WERKE, Staufen, Germany). On the final day of the trial, 5 fish from each tank were dissected and weighed for viscerosomatic index (VSI), hepatosomatic index (HSI), stomasomatic index (SSI) and intestosomatic index (ISI) by the following formula. VSI (%) = 100 X [wet weight of visceral organs and associated fat tissue (g) / wet body weight (g)] HSI (%) = 100 x [wet weight of liver (g) / wet body weight (g)] SSI (%) = 100 x [wet weight of stomach (g) / wet body weight (g)] ISI (%) = 100 x [wet weight of intestine including pyloric cecae (g) / wet body weight (g)] 2.2.3 Chemical analysis Proximate composition of test diets and carcass were analyzed by the standard methods (AOAC 1995). Dietary carbohydrate was measured by the phenol-sulfuric acid method (Hodge and Hofreiter 1962). Vitamin C (AsA) was analyzed by a high-performance liquid chromatography (HPLC) method with precolumn derivatization using 2, 4-dinitrophenylhydrazine (DNPH) according to Kodaka et al. (1985). Hepatic aspartate aminotransferase (GOT) and alanine aminotransferase (GPT) activities were analyzed using supernatant after centrifugation of hepatic homogenate with de-ionized water by commercially available kits (Wako Pure Chemical Ind. Ltd., Osaka, Japan). Lipid for fatty acid analysis was extracted according to Folch et al. (1957). The fatty acid methyl esters were formed by using methanolic 2 M NaOH solution and methanolic 2 M HC1 solution according to Yoshinaka and Satoh (1989) and analyzed with a gas chromatograph (G-3000; Hitachi, Tokyo, Japan) —82—.
(13) B.K. Biswas : Formulated diet for juvenile bluefin tuna. equipped with an Ultra Alloy R capillary column (30 m x 0.25 mm ID; Frontier Laboratories, Fukushima, Japan) and a flame ionization detector. Tricosanoic acid methyl ester (Sigma-Aldrich, USA) was used as an internal standard. The column oven temperature was increased from 180 to 240°C at a rate of 4°C/min and then the temperature was maintained at 240°C for 20 min. The carrier gas was nitrogen, and source and column head pressure at 5 and 1 kgf/cm2, respectively. The final temperatures for the injector and detector were 260 and 290°C, respectively. Peak quantification was performed with an integrator (D-2500; Hitachi, Japan). 2.2.4 Statistical analysis All statistical analyses were carried out using the Statistical Package for the Social Sciences (SPSS) program for Windows (v. 12.0, Chicago, IL, USA). Data were expressed as the means±SE of two replicates. When significant differences were found, the means within each treatment and among treatments were compared using Tukey's test of multiple comparison with a 95% level of significance.. 2.3 Results. 2.3.1 Growth performance Growth performance of juvenile PBT fed the experimental diets is presented in Table 2.3. In all treatments, the highest mortality was recorded a few days after starting the feeding trial (Fig. 2.1). The final body weight, weight gain and SGR were significantly higher in fish fed the D3 diet than those fed the D1 diet. Feed intake was significantly higher in fish fed the SL diet than those fed the other diets but significantly lower FE was observed in the SL and DI fed groups than that of other groups. Highest condition factor was observed in the D1 fed group followed by D2, D5, SL, D3 and D4 diets. However, there was no significant difference in survival among the dietary treatments.. Table 2.3. Growth performance. ofjuveni le PBT fed the experimental. diets D iet. Initial. Initial body weight (g) fork length (cm) Final body weight (g) fork length (cm) Weight gain (%) SGR (%) Feed consumed (g) FE (%). D1. D2. D5. SL. 0.26 2.93 2.2± 0.06. 2.6 A. lab. 2.9±0.0a. 2.7+0.1. 5.6,-0.0b. 6.1 ± 0.1ab. 6.5±0.1a. 6.5±0.2a. 608.9-T.1 5.6b. 787.1± 43.81. 840.7± 33.2a. 24.1 -10.0b 257.8-t 18.2h. 25.9±0.6ab 290.6. 97.8-=-3.5h. CF. 1.3. Survival rate (%). 6 1.0± 1.4. 0.0a. Values in a row with different letters are significantly Values are means. D4. D3. 21.61'. 26.81 0.1a. 826.3. 25.9a. 26.1 ±0.4ab. 297.6-1-21.0b. 297.0±7.8b. 116.2.2.7a. 121.2±0.7a. 19.6±1.. 1.2i0.0abl. .0±0.0bc. 67.010.7. 67.07-'4.2. different (P<0.05).. SE of 2 groups of fish with 200 fish per group.. -83-. al). 1.01'0.1c 67.5,0.7. 2.5+0.0ab. 2.40.3ab. 6.1.L0.1ab. 6.1±0.3ab. 732.1"12.8ab 25.1. lab. 277.9118.6h la. 114.91 3.0a 1.1±0.1bc 69.8±3.9. 758.5 i_70.3ab 24.9 a 1.4a1) 451.4. 1 1.7a. 72.0:10.0c 1.1±0.0be 67.5± 1 1.3.
(14) '. 1. 2. 71<F. 3. 1 2 '4. 4. 5. (2 0 1 0). 6. 7. 8. 9. 10. Rearing period (day) Fig. 2.1. Changes in survival rate of juveniles PBT fed the different test diets . Data are expressed as the mean of duplicate tanks, and values indicate mean±SE . 2.3.2 Carcass proximate composition and retention efficiencies Carcass proximate composition and nutrient retention efficiencies are given in Table 2 .4. Significantly higher moisture content was found in the SL fed group (P<0 .05). Carcass composition was highly reflected by the dietary treatments. Significantly higher protein content was found in fish fed the D1 and D4 diets as compared with the SL fed group . Highest carcass lipid content coincided with highest dietary lipid in the D5 fed group. Ash content was significantly lower in D4, D5 and SL fed groups as compared with other dietary groups, decreased with decreasing in dietary EFM level . AsA content in the SL fed group was significantly lower than other groups . Highest energy content was observed in the D5 fed. Table 2.4. Proximate composition, nuti rent and energy retention efficiencies in juvenile PBT fed experimental diets Diet Initial. Dl. Moisture (%). 82.7,0.1. 78.6-t0.2h. 78.1±0.4ah. 77.5: 0.4"h. Crude protein (%). 12.5,0.3. 15.3,0.4". 14.8z0.. 15.0, 0.4jh. 1.1. 1.6,0.2". 2.3±0.1h. 3.3,0.2. 3.6,0.1b. 3.5,0.2h. 3.4t0.2h. Crude lipid (%) Crude ash (%) Vitamin C (AsA, p g/g) Energy (kJ/g). 211.7 till 19.3 t- 0.3. 184 .0 t-9.8' 19 .7 , 0.6k. D2. 156.0,11.7'h 19.2 t 0.61". D3. D4. 148.3,8.3b 20.5. 0.4ah. 77.24).6" 15.2±0.2" 2.6-i-0.2h 3.0,0.1" 137.6r:2.61' 19.6 1=0.21'. D5. SL. 78.3±0.4"b 79.8 , 0.8" 14.6, 0.2dh 14.0,0.9h 3.0 :0.2" 1.3±0.2'd 2.9-70.1a 2.9 :0.1' 155.4:9.e 19.1, 2.9c 21.5 1.1" 18.5 : 1.3". Retention efficeiency (%) PRE ERE. 21.4+0.8'. 26.3± 0.6h. 30.4,0.2". 22.8,1.1hc. 26.5+1.7a. Values in a row with different letters are significantly di fferent (P <0 .05). Values are means±SE of 2 groups of fish with triplicate sampes from each group.. -84-. 32.5 !0.3' 24.7-t0.8". 32.1 :0.9a 24.2:0.9a. 14.0t 0.0d 13.2 f0.0d.
(15) group followed. by the D3 fed group. PRE was significantly. thatthan that of other groups. ERE was significantly. higher in D3, D4 and D5 fed groups than. higher in D3, D4 and D5 than that of other dietary. groups (P<0.05).. 2.3.3 Digestive organs and hepatic GOT and GPT activities VSI and HSI. increased with increasing lipid content in the dietary treatments as shown in Table 2.5. The VSI and HSI value were significantly higher in the D5 fed group than those of the SL fed group. The significantly reduced SSI in the D5 fed group appeared to relate to the decreasing dietary protein level but without a remarkable difference. The ISI was significantly higher in test diet groups than in the SL fed group (P<0.05). Hepatic GOT and GPT activities increased with increasing dietary protein level and were higher in fish fed the D1 and SL diets but did not differ significantly within D2-D5 fed groups.. Table 2.5. Biological measurements of the digestive organs and hepatic GOT and GPT activities in juvenile PBT fed experimental diets Diet DI. D2. VSI. 9 .1±1.0db. 9.1±0.5ab. 9.8±0.9ab. 9.7±0.8ab. 10.1±0.9a. 8.9±0.7". HSI. 2.2±0.5c1. 2.5±0.5c1. 3.0±0.5abc. 3.1±0.3ab. 3.3±0.4a. 2.6±0.4bed. SSI. 1.0±0.2a. 1.0±0.2a. 1.0±0.2'. 0.9±0.23h. 0.8±0.1". 1.0±0.2'. 2.9±0.4a. 2.9±0.5a. 3.0±0.5. 3.0±0.43. 3.4±0.6'. 2.2±0.2". 71.9±19.4a". 50.2±6.7". 54.3±8.0ah. 48.3±13.7". 87.3±25.7n. 13.1±4.9"`. 6.9±2.9c. 6.5±3.6c. 5.0±1.9c. 24.4±7.2a. Biological. D3. D4. D5. SL. analysis. IS I GOT and GPT activities GOT (IU/100g. BW). GPT (IU/100g. BW). in liver 75.6±21.5ab 19.1±3 .9a h. Values in a row with different letters are significantly different (P <0.05). Values are means±SE of 2 groups offish with 5 fish per group.. 2.3.4 Carcass fatty acid composition Fatty acid composition of juvenile tuna carcass is presented in Table 2.6. Fatty acid compositions were well reflected by that of the dietary lipid. Saturated fatty acids such as 16:0 and 18:0 were significantly higher in the SL fed group than other dietary groups. The 18:1n-9 content was significantly higher in the D3 fed group but similar among D2, D4 and D5 fed groups. The 18:2n-6 content was significantly higher in the D1 fed group and tended to decrease with decreasing dietary lipid content. Carcass 20:5n-3 (EPA) level in D4 and D5 fed groups were higher than other dietary treatments. Carcass 22:5n-6 (DPA) level in D3 and D4 fed groups were significantly higher than that of the SL fed group. At the end of the trial, carcass 22:6n-3 (DHA) level of all dietary groups increased considerably as compared with that at the start, but there were no significant differences among the treatments. The ratio of DHA/EPA and 1n-6 HUFA decreased with increasing in dietary lipid level but En-3 HUFA and n-3/n-6 ratio were reversely increased.. —85—.
(16) Table 2.6. Fatty acid composition (%) in lipid of juvenile PBT fed experimental diets Diet. 14:0. Initial. D1. D2. D3. D4. D5. SL. ND. 0.8. 0.3. 0.1. 0.8. 0.9. 0.2. 15:0. 0.3. 0.4. 0.4. 0.4. 0.4. 0.5. 0.4. 16:0. 2 8.0. ?1 .8". 19.9bc. 1 7.9c. 18.5 c. 19.1c. 27.0a. 16:1. 3.1. 2.9. 3.1. 3.5. 2.9. 3.6. 3.6. 17:0. 0.5. 0.7a. 0.7a. 0.6ab. 0.5b. 0.56. 0.8a. 17:1. 0.4. 0.46. 0.5a6. 0.5a. 0.5ab. 0.5 ab. 0.5 a6. 18:0. 11.5. 9.9a. 8.2". 7.5"c. 7.0`. 7.1c. 1 0.4a. 18:1n-9. 12.5. 11.66c. 12 .2ab. 13.1a. 18:1n-7. 3.8. 3.3a. 3.1ab. 3.1ab. 2.7`. 2.9c. 3.5a. 18:2n-6. 3.0. 7.7a. 6.16. 5.4`. 4.3". 4.2d. 0.7`. 18:3n-3. 0.7a. 0.8a. 0.7a. 0.7a. 0.4`. 1 2.3 ab. 12.3 ab. 1 0.9c. 0.6. 0.66. 20:1. 0.6. 0.5c. 0.96. 1.3a. 1.2a. 1.4a. 0.96. 20:4n-6. 2.5. 2.1a. 1.8ab. 1 .7". 1.9ab. 1.76. 1.76. 20:5n-3. 3.6. 5.8`. 7.5bc. 8.8ab. 9.6". 9.8a. 7.6bc. 22:5n-6. 1.8. 2.61'. 2.9th. 3.3a. 2.9ab. 1.4`. 22:6n-3. 17.0. 22.6. 23.4. 23.4. 23.8. 2 3.0. 21.9. 2.7"c. 2.5cd. 2.3d. 2.9bc. 22:6n-3/20:5n-3 I En-62 n-3/n-6. Values. 4.7. 3.9a. 21.2. 29.06. 31.6ab. 3 2.9ab. 3 4.1a. 33.5ab. 29.91'. 7.3. 12.4a. 10.86. 1 0.4c. 9.3d. 8.8d. 3.8'. 2.9. 2.3d. 2.9". 3.2c. 3.76. 3.8". 7.9a. in a row with different. Values represent. 3.1a. averages. 18:3n-3,20:5n-3, 2 En -6: 1 8:2n-6 ,2 0:4n-6,. letters. of triplicate. are significantly samples. different. (Tukey's. test, P<0.05).. from each diet.. 22:6n-3. 2 2:5n-6.. 2.4 Discussion. In this experiment, diet D3 with 61.9% crude protein and 17.9% crude fat produced maximum growth, which was about 11 times higher than the initial body weight. Carnivorous fishes such as yellowtail (Takeda et al. 1975); red sea bream (Yone 1976; Wilson 1989a); malabar grouper (Chen and Tsai 1994); Asian sea bass, Lates calcarifer (Boonyaratpalin 1997); Atlantic salmon (Lall and Bishop 1977) and cobia, Rachycentron canadttm (Chou et al. 2001) require 40-55% dietary protein. The higher protein requirement of PBT juveniles compared to other carnivorous fish may be attributed to its remarkably rapid growth . In the current study, our results revealed that 17.9% dietary lipid was the optimum level as further increase of dietary lipid decreased final body weight. Several marine species have reported optimum results with upto 20% dietary lipid, such as red sea bream (Yone et al. 1971); rainbow trout, Salmo gaidneri (Lee and Putman 1973; Takeuchi et al. 1978) and turbot, Scophthalmus Maximus (Adron et al. 1976) similar to PBT juveniles. The SGR of fish fed the D3 diet was remarkably higher than those reported by Takii et al. (20076). This may be attributed to the difference in fish meal used. Takii et al (2007b) used EFM but the -86-.
(17) present study used defatted EFM. The digestibility of nutrients and energy may have been higher in the current study due to defatting of the fish meal. Feed intake was significantly higher for the SL diet; however, the test diet groups (D1-D5) did not show any difference among them, irrespective of the difference in dietary protein and lipid contents. A plausible cause for this could be that the raw SL diet had higher digestibility than the fish meal produced by heat processing (Takii et al. 2007a). In the present study, feed efficiency increased with dietary lipid content upto 17.9% for the D3 diet and then slightly decreased. However, D1 and SL dietary groups with higher crude protein content showed the lowest FE, which is consistent with result of Takii et al. (2007b). Survival of juvenile PBT did not differ among the dietary treatments but was lower than other cultured species (Kim and Lee 2005; Biswas et al. 2006b, 2008). This is attributed to their stress response to external stimuli, inevitable trauma caused by collision against the tank walls and biting on caudal peduncles, resulting in imbalanced morphological development (Miyashita et al. 2000; Miyashita 2002). However, the highest mortality was recorded just after 2-4 days of the onset of feeding. The plausible cause could be due to transport stress and skin wounds, although care was paid to avoid their injury during handling. A similar low survival of juvenile PBT has also been reported by Kaji et al. (1996) and Seoka et al. (2007b); however, other reasons may have been involved. PRE was significantly higher in D3, D4 and D5 fed groups, the fish with increased lipid content supported a protein sparing effect but it was more prominent in fish fed the D3 diet resulting in the highest ERE. These results give a clear indication of the optimum dietary protein and lipid ratio in the D3 fed group because beyond these level growth was reduced. The AsA content was significantly lower in the SL fed group due to the lower amount of AsA in SL. The higher VSI and HSI in the D5 fed group might be due to their higher lipid retention as previously observed by Takii et al. (2007b). The higher SSI in test diet fed groups than the SL fed group might give an indication of digestive organ adaptation for less digestible fish meal that has previously been reported for PBT and some other fish species (Shimeno et al. 1993; Takii et al. 2007a, b; Ji et al. 2008). Hepatic GOT and GPT activities of the dietary groups were directly related to dietary protein level and were low in D3-D5 dietary groups. These results also support that the D3 diet had the most suitable protein and lipid ratio for juvenile PBT. However, the activity of hepatic GOT and GPT varies in many fish species (Moon and Foster 1995). Several studies have been conducted on lipid requirements of fish (Watanabe and Kiron 1994; Sargent et al. 1999a; Tuan and Williams 2007). For marine fish species, essential fatty acid requirements are chiefly met by dietary n-3 HUFA, EPA and DHA (Sargent et al. 1999a). Studies have indicated that both n-3 and n-6 fatty acids are necessary for larvae and brood stock (Takeuchi et al. 1980; Bessonart et al. 1999; Bell and Sargent 2003a; Furuita et al. 2003, 2007), while the requirement of most juveniles are satisfied by n-3 fatty acids. For PBT juveniles, dietary n-3 fatty acids increased carcass n-3 fatty acid contents, especially DHA. It has been reported that PBT and yellowfin tuna selectively accumulate and retain DHA in their tissues (Ishihara and Saito 1996; Saito et al. 1996) which is consistent with our present findings. Seoka et al. (2008) have suggested the importance of DHA/EPA ratio for the growth performance of marine fish larvae and juveniles. The ratio above 1.0 is appropriate for normal growth which is consistent with the present study. A high DHA/EPA ratio has been reported in marine fish eggs, larvae and —87—.
(18) wild copepods that have been considered as the natural food for marine fish larvae and juveniles (Tocher and Sargent 1984; Drillet et al. 2006). Bell at al. (2003b) reported that these live feeds had a DHA/EPA ratio of 2 or more, which was very close to our test diets. The higher level of DHA and n-3/n-6 ratio suggested that PBT juveniles may have higher requirement for n-3 fatty acids, notably DHA which has been observed in wild SBT muscle lipid (Nichols et al. 1998). From the present study, it has been shown that defatted EFM and salmon egg oil may be suitable as protein and lipid sources, respectively, for PBT diet formulation to support good growth. These results suggest that the proportion of 61.9% crude protein and 17.9% crude lipid could be successfully used to formulate diets for juvenile PBT to ensure good growth, and contribute to the mass production and sustainability of this valuable species..
(19) B.K.. Biswas : Formulated diet for juvenile bluefin. CHAPTER. Dietary. Sugar. Requirements Traditionally. for Juvenile used. PBT. Raw. Sand. 3. and the Compatibility Lance,. tuna. Ammodytes. of Formulated. Diet with. personatus. 3.1 Introduction. A series of research have also been going on in the Fisheries Laboratories, Kinki University to establish an artificial formulated diet for juvenile PBT. In chapter 2, we have estimated the suitable protein and lipid levels of 62 and 18%, respectively for juvenile PBT. However, the optimum dietary level of sugar is yet to be identified. Carbohydrate is well known as one of the important nutrients and least expensive ingredients for human and domestic animals, but relatively low utility has been demonstrated elsewhere for fish (NRC 1993; Wilson 1994; Dudley-Cash 1997). However, several studies suggested that dietary carbohydrate provide a protein sparing effect in many fishes (Shimeno et al. 1995; Wilson 1994; Degani and Viola 1997; Shiau 1997; Peragon et al. 1999; Lee et al. 2003a). On the other hand, there is species specificity in carbohydrate utilization and metabolism in fish (Stone 2003; Wilson 1994; Krogdahl et al. 2005). Many reports (Lim 1991; Wilson 1994; Catacutan and Coloso 1997; Allan and Rowland 2002; Hardy and Barrows 2002) have recommended dietary carbohydrate levels for carnivorous and omnivorous species up to 20 and 40%, respectively, which are higher as compared with carnivorous salmonids and marine fish. Mourente and Tocher (2002) mentioned that ABT from Mediterranean were unlikely to utilize dietary carbohydrate due to low carbohydrate digestive enzyme activities in their gut. However, de la Parra et al. (2007) reported very high a-amylase and glycosidase activities in the caecal mass and proximal intestine in PBT. However, there is no information regarding the utilization capacity and suitable dietary level of carbohydrate in PBT. Hence, the present study was aimed to investigate a suitable dietary sugar level required for juvenile PBT and to verify the compatibility of formulated diet to raw SL.. 3.2 Materials. and methods. 3.2.1 Diet preparation Dietary formula and proximate compositions are given in Table 3.1. Four diets namely D3, D6-D8 were composed of 3, 8, 13, 18% a—starch (Japan Cornstarch Corp. Aichi, Japan) with declining levels of a mixture, 17 parts of EFM and 2 parts of salmon egg oil. After well mixing all dietary ingredients, 15% tap water was added and moist pellets were prepared using a laboratory pellet machine. Appropriate size of the pellet was adjusted using sieves and was fed as the fish grew. As a reference feed, we separately prepared SL which was chopped into appropriate sizes and stored in a freezer at -20°C until use like other diets. Fatty acid composition of test diets is presented in Table 3.2.. —89—.
(20) k71(iF4U. Table. 3.1.. Ingredient. and proximate. ( 2 0 1 0). 1 2 -. compositon. of experimental. diets. Diet. Enzyme. treated. Salmon. fish meal. egg oil 2. a- Starch Vitamin. mixture. 3. Mineral. mixture. 3. Soybean. lecithin. Taurine. D3. D6. D7. D8. SL. 68.0. 63.8. 59.6. 55.3. Sand lance. 8.0. 7.5. 7.0. 6.5. 3.0. 8.0. 13.0. 18.0. 5.0. 5.0. 5.0. 5.0. 5.0. 5.0. 5.0. 5.0. 2.0. 1.9. 1.8. 1.6. 2.0. 2.0. 2.0. 2.0. 0.5. 0.5. 0.5. 0.5. Cellulose. 4.0. 3.9. 3.9. 4.0. Wheat. 2.4. 2.3. 2.1. 2.0. 0.1. 0.1. 0.1. 0.1. Feeding. stimulants. 4. gluten. APM 5. Proximate analysis (% of dry matter basis) Crude protein. 63.5. 60.1. 55.9. 50.6. 72.8. Crude I ipid. 17.0. 15.8. 14.7. 13.7. 8.1. Crude Ash. 8.6. 8.6. 8.3. 8.2. 14.8. Sugar. 7.0. 12.8. 18.5. 24.8. 0.1. 21.1. 21.7. 21.0. 20.4. 20.50. Energy (kJ/g). Vitamin C (AsA, ,u g) 410.9 429.2 419.0 409.2 'Profish S .A, Santiago, Chile, defatted with n-Hexane. 2Sujiko oil® , Nisshin Marinetech Co. Ltd, Yokohama, Japan. 3Halver (1957) . 4The mixture of glutamic acid 8 .5, L-histidine HCI H,0 232.8 and insonine monophosphate 2Na 200.9 mg. 5L-Ascorbyl-2-monophosphate magnesium salt .. 3.2.2. Fish,. experimental. design. 42.2. -5 -. and sampling. 3.2.2.1 Trial 1 Juvenile PBT used for this trial was obtained from the Fish Nursery Center, Kinki University, Uragami. One hundred fifty juveniles, an initial mean body weight of 1.6 g and 36 DAH, were distributed into each of twelve 15 m3 eight angular experimental concrete tanks. Juveniles were stocked into each of triplicate tanks for each treatment. Diets and SL were fed 6 times daily (05:30, 8:00, 11:00, 14:00, 1600 and 18:00) until apparent satiety for 8 days. The tank was illuminated 24 h with a fluorescent light. The flow rate of filtered seawater into each tank was adjusted at 30 //min. Water temperature and DO were maintained ca. 26.8°C and 7.7 mg//, respectively. The tank bottom was siphoned twice a day, and dead fish were collected and weighed. Fish were sampled at the start and end of this trial to assay dietary and carcass proximate composition, gross energy and AsA contents, and liver and muscle glycogen, and kept in a freezer under -20 and -80°C . Growth performance, biological and hematological parameters and fatty acid composition were also investigated at the end of the trial. Growth performance was estimated with SGR, FE, CF, daily -90-.
(21) Biswas : Formulated diet for juvenile bluefin tuna. B.K.. feeding rate (%), PRE, lipid retention efficiency (LRE) and ERE using the following formula as cited in the chapter 2. Daily feeding rate (%) = (Total feed intake/days) x 100/ [{(initial no of fish + final no of fish)/2} {(Initial mean body weight + final mean body weight)/2}] LRE (%) = 100 X [(final carcass lipid - initial carcass lipid) / total lipid intake]. The diets, initial and final carcass were lyophilized prior to gross energy determination with an automated oxygen bomb calorimeter (1KA' -WERKE, Staufen, Germany). At the end of the trial, fish were also sampled from each tank to measure relative organ weight to body weight; VSI and HST using the formula as cited in the chapter 2.. Table 3.2.. Fatty acid composition. (%) in lipid of experimental. diets. Diet D3. D6. D7. D8. SL. 14:0. 3.1. 3.3. 3.4. 3.3. 0.04. 15:0. 0.5. 0.5. 0.5. 0.5. 0.8. 16:0. 14.5. 14.4. 14.4. 14.3. 31.4. 16:1. 4.3. 4.4. 4.6. 4.5. 7.4. 17:0. 0.5. 0.5. 0.5. 0.4. 0.9. 17:1. 0.6. 0.6. 0.6. 0.6. 0.6. 18:0. 4.7. 4.5. 4.5. 4.5. 7.9. 18:1n-9. 12.2. 12.3. 12.4. 12.4. 10.4. 18:1n-7. 2.7. 2.6. 2.6. 2.7. 3.4. 18:2n-6. 7.9. 7.5. 7.5. 7.7. 0.8. 18:3n-3. 1.3. 1.3. 1.3. 1.3. 0.5. 1.8. 1.8. 1.8. 1.8. 2.3. 20:1 20:4n-6. 1.4. 1.5. 1.4. 1.4. 0.6. 20:5n-3. 11.9. 12.4. 12.1. 12.0. 3.6. 22:5n-6. 3.4. 3.3. 3.4. 3.5. 0.9. 22:6n-3. 19.4. 18.5. 18.7. 18.6. 7.5. 22:6n-3/20:5n-3. 1.6. 1.5. 1.5. 1.6. 2.0. 18:1n-9/22:6n-3. 0.6. 0.7. 0.7. 0.7. 1.4. En-31. 32.6. 32.2. 32.1. 31.9. 11.6. En-6-. 12.7. 12.3. 12.3. 12.6. 2.3. 2.5. 5.2. n-3/n-6. Values represents. 2.6. averages. En-3: 18:3n-3, 20:5n-3, 2 :11 -6 : 18:2n-6 , 20:4n-6,. 2.6. of triplicate. 2.6. samples. from each test diet.. 22:6n-3. 22:5n-6.. 3.2.2.2 Trial 2 One hundred sixty five juveniles, an initial mean body weight of 9.7 g and 45 DAH, were obtained from the Fish Nursery Center like trial 1, were stocked into each of two 40 m3 circular tank. There was no replication in this trial. D6 and chopped SL as a reference were fed 4 times daily (06:00, 10:00, 14:00 and 18:00) till apparent satiation for 11 days. Water temperature and DO were maintained ca. 26.6°C -91-.
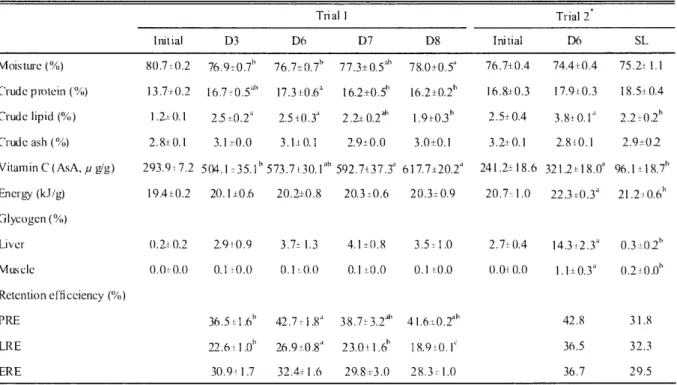
(22) 1117:7MAN. and 6.6 mg//, respectively.. 1 2 P5. Other rearing, samplings. trial 1 as described above. Blood was obtained hematocrit. value (Ht) and hemoglobin. 3.2.3 Chemical. and measuring. from caudal artery with a heparinized. concentration. composition. (Hb).. water and determined. spectrometrically. 1958). Vitamin C (AsA) was analyzed. with precolumn. derivatization. was. measured. et al. (2006). Finally, the glycogen was diluted. according. to the Anthrone-sulfuric. by high-performance. using 2, 4-dinitrophenylhydrazine using. crude ash. using the formula as cited in the chapter 2. Liver and muscle. were extracted by ethanol described by Nakamura. into de-ionized. Hemoglobin. syringe for assaying. of test diets and carcass, crude protein, crude lipid, moisture,. and dietary sugar content were measured. (Horikoshi. protocols in this trial were the same of. analysis. Proximate. glycogen. (2 0 1 0). commercial. kit (Wako. acid method. liquid chromatography. according. Pure Chemicals. to Kodaka Co.. method. et al. (1985).. Ltd., Osaka,. Japan).. Hematocrit was measured using the method described by Brown (1980). Lipid for fatty acid and fatty acid methyl esters were extracted. and analyzed,. respectively. using. the method as cited in the chapter 2.. 3.2.4. Statistical Data. However,. analysis obtained. from. the trial. 1 were. the data from the trail 2 was analyzed. analyzed. by a one-way. using students. ANOVA. as cited. in the chapter. 2.. t-test.. 3.3 Results. 3.3.1 Trial 1 Significantly higher final mean body weight was found in D3 and D6 groups (Table 3.3) than D7 and D8 groups. Weight gain and FE were higher in diet 2 group without significant differences among the treatments. However, SGR was significantly higher in D3 and D6 groups than other dietary groups. Carcass proximate composition, organ glycogen contents and retention efficiencies are presented in Table 3.4. Carcass moisture significantly increased in D8 group, but D6 group showed significantly higher crude protein and lipid. Carcass AsA content was significantly higher in D8 group than other diet groups. There were no significant variations in carcass crude ash and energy contents among the treatments. Liver glycogen had a gradually increasing trend with rising in dietary sugar level; however, muscle didn't show any difference among the dietary treatments. Although D6 group showed significantly higher PRE and LRE, there was no significant variation in ERE among the treatments. There was also no significant difference in both VSI and HSI among the treatments (Table 3.5). Carcass fatty acid compositions of juveniles fed diets are presented in Table 3.6. Dietary fatty acid composition has well reflected in carcass fatty acid composition. No remarkable and meaningful differences in carcass fatty acid composition were obtained among the dietary treatments.. 3.3.2. Trial 2 Growth. performance. such. as SGR,. daily. feeding —92—. rate,. FE and CF, final carcass. moisture,. protein.
(23) : Formulated diet for juvenile bluefin tuna. B.K. Biswas. and ash contents, Table group. 3.4.. LRE and hematology. However,. were. higher. carcass than. lipid, those. Table 3.3. Growth performance. were similar. AsA and of. SL. between. energy. group.. D6 and SL groups,. contents,. In. PRE. carcass. fatty. of juvenile PBT fed the experimental Trial. and ERE acid. as shown. and VSI,. composition,. in Table 3.3 and. HSI. and ISI of D6. D6. group. diets. I. Trial. Diet. Initial. Initial body weight (g). D3. D8. D7. 9.03. 7.8±0.0a 8.7±0.1. 8.8,0.3. Weight gain (%). 288.8 ±7.7. SGR (%). 426.1±26.3. Daily feeding rate (%) FE (%) CF Survival rate (%). 7.2±0.1h. 6. 7± 0.2c. 45.74,9.3. 46.6,10.7. 8.5±0.1. 8.4±0.1. 14.511.0. 14.611.0. 340.6. 362.0. 290.18,27.9. 260.5±20.0. 19.3±0.1a. 18.5,0.2b. 19.3,0.2a. Feed consumed (g). SL. 9.67. 7.8,0.1a. fork length (cm). D6. Initial. 5.16. Final body weight (g). 2*. Diet. D6. 1.65. fork length (cm). showed. 401.3±30.3. 252.6,11.2. 14.3. 14.1. 3237.7. 4311.2. 17.5-4.0.4c. 397.6±8.5. 427.5 ±20.0. 9.88±-0.2ab. 10.44,0.3'. 9.89±0.5ab. 9.41±0.4h. 7.8. 9.3. 127.4±5.5. 135.2±7.4. 122.7±11.4. 119.5±0.2. 139.5. 117.6. 1.2,0.1. 1.2,0.0. 1.2±0.0. 1.1±0.1. 1.5. 1.5. 51.3±4.1. 51.7/5.1. 50.9±5.4. 60.2±2.5. 66.1. 81.8. Values in a row with different letters are significantly. different (P<0.05).. Values are means±SE of 3 groups of fish with 150 fish per group in trial I and 165 individuals. in each of 2 group in trial 2. Stastical analysis was not performed due to no replication.. Table 3.4. Proximate composition, nuti rent and energy retention efficiency in juvenile PBT fed experimental diets Thal Initial. D3. Moisture (%)). 80.7. Crude protein (%). 13.7i 0.2. 0.2. D6. 76.9-± 0.7" 16.7,0.16. I. Trial D7. D8. Initial. 2. D6. 77.3±0.5`th. 78.0±0.51. 76.7+0.4. 74.4+0.4. 75.2:11.1. 17.3±0.6". 16.2±0.51). 16.2±0.2b. 16.8± 0.3. 17.9±0.3. 18.5±0.4. 76.7±0.7". Crude lipid (%). 1.2,70.1. 2.51:0.2". 2.5+0.3'. 2.2±0.2ab. 1.9±0.3". 2.5± 0.4. 3.810.1". Crude ash (%). 2.8±0.1. 3.1=-0.0. 3.1±0.1. 2.9±0.0. 3.0±0.1. 3.2:0.1. 2.8-10.1. Vitamin C (AsA, ,u gig) Energy (kJ/g). 293.9:. 7.2. 19.4x0.2. 504.1,. 35.111 573.7. 20.1±0.6. SL. ±30.1. 20.2±0.8. 592.7+37.3" 20.3 ±0.6. 617.7±20.2". 241.2±18.6. 20.3±0.9. 20.71:1.0. 321.2±18.0 22.3 ±0.3". 2.9±0.2 96.171_18.7 21.2:10.6'. Glycogen (%) Liver. 0.2± 0.2. Muscle. 0.0± 0.0. 2.9 f 0.9. 3.7,. 1.3. 0.11.0.0. 4.1±0.8. 3.5:1.0. 2.7± 0.4. 0.1±0.0. 0.1+0.0. 0.0-10.0. 0.3±02 1.1+0.3'1. 0.2±0.0. 42.8. 31.8. 36.5. 32.3. 36.7. 29.5. Retention efti ceiency (`VO) PRE. 36.5L1.6`'. 42.711.8". LRE. 22.6 L1.01'. 26.9±0.8". 23.0. ERE. 30.91. 32.4,1.6. 29.8±3.0. 1.7. 38.7=1.2ah. 41.6i0.211' 18.9. Values in a row with di fferent letters are significantly different (P <0.05). Values are means SE of 3 groups of fish with 2 fish per group in trial 1 and single tank with 3 fish per group in trial 2. Sudents t- test was performed. -93-.
(24) )K*if. 1 2 -`4. N. (2 0 1 0). significantly higher contents of 18:2n-6, 18:3n-3, EPA, DPA, DHA, 1n-3 and 1,n-6 but lowered. 16:0,. 18:0, 18:1n-7 and n-3/n-6 ratio than SL group (Table 3.6).. Table. 3.5.. Biological. an. d hematological measurements in juvenile fed experimental diets Trial D3. 1. D6. Trial D7. D8. 2. D6. SL. VSI. 10.1±0.3. 10.4±1.0. 9.8±0.8. 10.6±1.3. 9.5±1.1. 7 8±0.7". HSI. 2.7±0.3. 3.0±0.5. 2.7±0.6. 2.6±0.4. 2.6±0.4. 1 8±0.3". Hematocrit (%). 54.3±4.6. 52.8±2.0. Hemoglobin (g/dl ). 9.3±0.6. 9.1±1.2. Hematological analysis. Values in a row with different Values are means±SE. Table. letters am significantly. different. (P <0.05).. of 3 groups of fish with 3 fish per group in trial 1 and. 3.6.. 10 fis h per group. Fatty acid composition (%) of juvenile PBT fed experimental Trial Initial. 1. Trial. in trial. diets 2. D3. D6. D7. D8. Initial. D6. SL. 2.4. 1.9. 2.7. 2.6. 2.9. 14:0. ND. 1.9. 2.6. 15:0. 0.4. 0.5. 0.5. 0.6. 0.5. 0.6. 0.5. 0.6. 16:0. 20.6. 17.2. 16.8. 19.4. 17.3. 20.4. 15.8". 28.5a. 16:1. 2.9. 3.5b. 4.4a. 4.1ab. 3.5b. 4.8. 4.5b. 6.0a. 17:0. 0.5. 0.5. 0.6. 0.6. 0.6. 0.9. 0.6". 0.8a. 17:1. 0.4. 0.5. 0.6. 0.6. 0.5. 0.6. 0.6. 0.7. 18:0. 8.7. 6.6ab. 6.3b. 7.5a. 7.0a". 7.7. 5.9b. 9.9a. 18:1n-9. 11.5. 12.2. 13.7. 13.9. 12.5. 14.8. 14.3. 15.7. 18:1n-7. 3.2. 2.8. 3.0. 3.2. 2.8. 3.3. 2.9b. 4.3a. 18:2n-6. 3.6. 5.36. 6.0a. 5.6ab. 5.5b. 5.9. 6.0a. 1.1'. 18:3n-3. 0.4. 0.8. 0.9. 0.8. 0.8. 0.8. 1.0a. 0.4b. 20:1. 1.0. 1.3. 1.5. 1.5. 1.3. 1.6. 1.6b. 1.9a. 20:4n-6. 2.1. 1.9a. 1.5b. 1.7ab. 1.8a. 1.4. 20:5n-3. 6.4. 9.6a. 9.4'. 7.7b. 22:5n-6. 2.8. 3.3. 3.3. 2.9. 22:6n-3. 28.6. 23.9a. 20.5ab. 18.9". 22:6n-3/20:5n-3. 4.5. 2.5a. 2.2b. 2.5a. 'n-31. 35.4. 34.3a. 30.8ab. 27.4b. En-6-. 8.5. 10.5. 10.8. 10.2. n-3/n-6. 4.2. 3.3a. Values in a row with different Values represent. averages. ND= Not detected. I En -3: 18:3n-3 ,20:5n-3, 2E n-6: 18:2n-6,20:4n-6,. 2.9bc. 2.7C. 1.8. 0.8. 9.1'. 7.0. 9.7a. 3.8b. 3.2. 2.7. 3.4a. 0.6". 23.5a. 16.6. 19.7a. 8.0". 2.6a. 2.4. 2.(). 2.1. 24.4. 30.4a. 1.2.211. 10.5. 10.0. 11.1a. 2.5b. 3.2"'. 2.5. 2.6". 4.8a. 33.4'. letters are significantly. of triplicate. samples. 22:6n-3. 22:5n-6.. -94-. different. from each diet.. (P <0.05).. 2.. 16:1,.
(25) B.K.. Biswas. : Formulated diet for juvenil e. bluefin. tuna. 3.4 Discussion. Differences in source and construction of sugar and potency of glucose metabolism have been reported to have profound effects on a suitable dietary carbohydrate level in fish (NRC 1993; Wilson 1994). In the present study, juvenile PBT showed higher growth performance, and nutrient and energy retentions when fed D6 including 12.8% sugar, but further increase in sugar could not improve growth performance. Higher carcass protein and lipid contents were also observed in D6 group, resulting from increasing utility of ingested sugar as energy source preferentially in place of dietary protein and lipid. These results strongly indicate that dietary sugar as well as protein and lipid levels for juvenile PBT are ca. 13, 60 and 16% under the conditions of trials 1 and 2. The suitable dietary sugar level of juvenile PBT is similar to yellowtail (Shimeno et al. 1979), but lowers than red sea bream, tiger puffer and salmonids (Furuichi and Yone 1982; Takii et al. 1997). Carnivorous fish ordinarily indicate low dietary sugar utility than omnivorous and herbivorous fish as well as land mammal (Shimeno et al. 1979; Furuichi and Yone 1982). From the present study, it was observed that juvenile PBT can effectively utilize dietary sugar at a relatively low level and grow faster than those fed with diets lacking sugar as in other fish (Hilton and Atkinson, 1982; Bergot and Breque 1983; Kaushik et al. 1989; Degani et al. 1986; Hemre et al. 1995; Stephan et al. 1996; Hemre and Hansen 1998; Erfanullah 1998), under adequate dietary protein levels (Degani et al. 1986). In the present study, dietary protein and lipid proportion was fixed to 17:2 for complementarily replacing to a-starch inclusion. Different proportions of dietary protein and lipid will bring to different suitable dietary sugar levels for juvenile PBT, while D6 group in trial 2 showed comparable growth performance to SL group. The SL is generally given to juvenile PBT and broadly recognized as one of preferable raw feeds in culture sites of Japan. These results indicated that the dietary protein, lipid and sugar levels of 60, 16 and 13%, respectively,. are recommended. and a reliable. dietary. composition. for juvenile. PBT.. Significantly higher PRE and LRE of juvenile PBT fed D6 suggest that dietary sugar could spare dietary protein and lipid in some extents when their dietary levels became sub optimal (Degani and Dosoretz 1998; Hemre and Storebakken 2000). This observation has become more prominent in trial 2, indicating a possibility of increasing sugar utility with growth. Some studies have shown that dietary sugar lead to increase in PRE by making more non-protein digestible energy and by decreasing the nitrogenous metabolic losses (Cowey et al. 1975; Kaushik and Oliva-Teles 1985; Lee et al. 2003a; Peres and Oliva-Teles 2002) and cost of fish feed (Shiau and Peng 1993). High survival in rearing trial of juvenile PBT was inevitable in the case using tanks with large capacities, such as 15 and 40 m3, in the present study. Juvenile PBT fed D8 indicated a slightly higher survival than other diets besides their lower growth performance in trial 1. While, survival of juveniles fed SL was higher than those fed D6, irrespective of similar growth performance in trial 2. Miyashita et al. (2000) suggested that mortality in juvenile stage of PBT was due to collision with tank wall owing to the stimulation of flash light and sound. And this collision was occurred in larger juveniles more than smaller juveniles. Therefore, the difference of survival in trial 1 might be attributed to the reason reported by Miyashita et al. (2000), but not clear in trial 2. It is reasonable to consider that some vitamins controlling nervous system of juvenile PBT or unknown nutrients existed in SL are deficient in diets D3 and D6-D8. In the near future, research should be conducted on vitamin requirements in juvenile PBT. —95—.
(26) )KyKfQ. 12 F-4. Rearing. period. (2 0 1 0). (day). Fig. 3.1. Changes in survival rate of juvenile PBT fed with different test diets. Carcass AsA level of juvenile PBT fed D3 with high lipid level was lower than those fed D7 and D8 in trial 1. Likewise, the AsA level of juvenile PBT fed SL was lower than that fed D6 in trial 2. The APM used in the present study could be found to function as an AsA source for PBT, similar to other fish species (Lin and Shiau 2004). The reason of lower carcass AsA level in juvenile PBT fed diet 3 in trial 1, in spite of the same dietary APM level, is not yet known. This may be attributed to increasing in AsA consumption for the synthesis of L-carnitine, which transports long chain fatty acid from cytoplasm to mitochondoria prior to 13-oxidation. The difference of carcass AsA in trial 2 was thought to be due to different dietary AsA levels between SL and D6. The trial 2 showed that juvenile. PBT fed SL selectively. stored more saturated and. mono-unsaturated fatty acids like 16:0, 18:0, 16:1 and 18:1n-7 than juvenile fed D6 which is consistent with wild caught PBT (Ishihara and Saito 1996). Whereas, D6 significantly accumulated poly-unsaturated fatty acids like LA, LNA, EPA, DPA and DHA, which are highly desirable for juvenile PBT as well as other marine fish (Ishihara and Saito 1996; Sargent et al. 1999a; Nichols et al. 1998). The ratio of n-3/n-6 was highest for SL, this could be due to their nature of origin or other reasons still unknown. The results may suggest that dietary protein and lipid could be partially replaced by sugar without reducing growth performance or carcass quality. Here, the sugar upto 12.8% not only improved physical properties of pellets but also improved growth and feed utilization without negative effects on the metabolism of juvenile PBT. Moreover, this level of sugar proved protein-sparing effect in some extent giving an indication of higher inclusion of dietary sugar for larger sized PBT in future. Finally, the obtained results revealed that diet containing 60% protein, 16% lipid and 13% sugar was suitable for optimal growth and efficient utilization of sugar and compatible with traditionally practiced raw SL in the present study. —96—.
(27) B.K. Biswas. : Formulated diet for juvenile bluefin tuna. CHAPTER. Dietary. Vitamin. C Requirements. 4. for Juvenile. Pacific. Bluefin. Tuna. 4.1 Introduction. In chapters 2 and 3, we have determined suitable levels of protein, lipid and sugar for juvenile PBT in which EFM, salmon egg oil and a-starch, respectively were the main sources of macronutrients. However, there is no information on specific micronutrients, especially vitamins for this valuable species. Vitamin C (ascorbic acid, AsA) has been proved to have numerous important biological functions and reported as one of the most important vitamins needs to be supplemented in the fish diet. Most of the animals can synthesize AsA from D-glucose, but many fish cannot due to lack of enzyme L-gulonolactone oxidase, which is necessary to convert L-gulonic acid to AsA (Wilson 1973a; Dabrowski 1990). Several studies have shown that AsA is an obligatory micronutrient required to maintain the physiological process of certain animals including fishes (Tolbert 1979). It is a very effective antioxidant, essential for collagen synthesis, helps to maintain various enzymes in their reduced form and also participate in the connective tissue and bone matrix formation (Wilson and Poe 1973b). AsA is very unstable in feeds, therefore more stable and bioavailable forms of AsA have currently been developed. Phosphate derivatives of AsA have shown potential antiscorbutic activity in several fishes including channel catfish (El Naggar and Lovell 1991 a,11), rainbow trout (Cho and Cowey 1993; Dabrowski et al. 1996), yellowtail (Kanazawa et al. 1992), tilapia (Shiau and Hsu 1995), Japanese flounder, Paralichthys olivaceus (Teshima et al. 1993) and marine shrimp, Penaeus monodon (Shiau and Hsu 1994). AsA also has been proved to be an important nutrient correlating with fish immunity (Roberts et al. 1995; Ai et al. 2004; Lin and Shiau 2005) probably of its antioxidant activity on phagocytic cells (NRC 1993). Hence, the present study was aimed to investigate the suitable dietary AsA C level required for juvenile PBT.. 4.2 Materials. and methods. 4.2.1 Diet preparation Ingredients. and. proximate. L-Ascorbyl-2-monophosphate. composition. of the. test. diets. are. given. in. Table 4.1.. magnesium, (APM, 46.46% AsA activity, Showa Denko K. K., Tokyo,. Japan) as a stable AsA derivative was used to prepare five experimental diets at 0, 400, 800, 1200 and 1600 mg/kg. Then the diets were designated as APM0, APM400,APM800,APMpoo and APM loon,respectively. The APM0 recognized as negative control diet and raw SL, which is usually fed to juvenile PBT in Japan, was used as the reference feed. Defatted EFM (Profish S.A, Santiago, Chile), salmon egg oil (Nishin Marine Tech Co. Ltd, Yokohama, Japan) and a—starch (Japan Cornstarch Corporation, Aichi, Hekinan, Japan) were used as the main protein, lipid and sugar source, respectively. Diets were prepared and stored as mentioned in chapter 2. Approximately 80% of APM was recovered in each test diet.. 4.2.2. Fish,. experimental. design. and sampling —97—.
(28) k 4(iff. (2 0 1 0). 12. Fertilized eggs of PBT in sea water-filled Amami artificial. Branch,. National. Center. seedling production. polythene bags were transported. for Stock Enhancement,. of the Fish Nursery. Fisheries. Research. Center, Kinki University,. by an airlift from the. Agency,. Uragami,. Kagoshima. Wakayama.. to. Larval. rearing was conducted. within the nursery center. Juvenile PBT of 25 DAH with initial mean body weight of. 0.27 g were randomly. distributed. into 15 1113eight angular. experiment. tanks at a stocking density of 300. individuals per tank. The feed was given to duplicate group for each of six treatments.. Initial fish were also. sampled randomly and kept frozen at -20 and -80°C until analysis. The test diets and SL were fed 6 times daily (05:30, 08:00, 11:00, 14:00, 16:00 and 18:00 h) to apparent satiety for 14 days. The filtered seawater was introduced were maintained. at 30 //min in each tank during the whole experiment.. The temperature. ca. 26.5°C and 7.5 mg//, respectively.. On the final day of the feeding trial, sampling was also done for obtaining For proximate. and DO of the tanks. growth performance.. analysis, 10 fish per tank were stored at -20°C; however, for AsA and other analyses the fish. were stored at -80°C. SGR, FE, CF, PRE, ERE, VSI, HSI, SSI and ISI was measured. using the formula as. cited in the chapters 2 and 3.. Table. 4.1. Ingredients. and proximate. composition. of expaimental. diets. Diet APM(). AP M 400. APM800. APM 1,00. APM 1600. Enzyme treated fish meal. 63.8. 63.8. 63.8. 63.8. 63.8. Salmon egg oil2. 7.54. 7.54. 7.54. 7.54. 7.54. 8. 8. 8. 8. 8. Vitamin mixture3. 5. 5. 5. 5. 5. Mineral mixture4 Soybean lecithin. 5. 5. 5. 5. 5. 1.89. 1.89. 1.89. 1.89. 1.89. 0.5. 0.5. 0.5. Starch. Taurine. 2 0.5. 0.5. lance. 2. Feeding stimulants' Cellulose. 3.97. 3.93. 3.89. 2.26. 2.26. 2.26. 3.85 "") .-)6. 3.81. Wheat gluten. 0. 400. 800. 1 200. 1600. APM6 Proximate. SL Sand. 2.26. ana lysis (%, on dry basis). Crude protein. 59.3. 59.3. 59.0. 59.1. 59.2. 76.3. Crude 1ipid. 16.7. 16.7. 16.3. 16.6. 16.8. 10.2. Ash. 7.5. 7.6. 7.6. 7.5. 7.8. 12.8. Crude sugar. 11.7. 11.9. 11.8. 11.9. 11.8. Energy (kJ/g). 22.7. 22.6. 22.7. 22.9. 22.8. 20.4. 136.0. 295.0. 454.0. 601.0. 86.5. Vitamin C (AsA, it g/g). Profish S.A, Santiago, Chile, defatted with n-Hexane. 2S ujiko Nisshin Marinetech Co. Ltd, Yokohama, Japan. 3 Halver (1957) , without AsA. 4 Halver ( 1957) . 5 The mixture of glutamic acid 8.5 mg, L-histidineHCl I-1,0 232. 8 mg and inosine-5 monophosphate 6. 2Na 200.9 mg.. L-Ascorbyl-2-monophosphate. magnesium. (-) not detected.. -98-. (mg/kg).. -.
(29) B.K. Biswas : Formulated diet for juvenile bluefin tuna. 4.2.3 Chemical analysis Test diets and carcass proximate composition were analyzed as cited in chapter 2. AsA was analyzed using a HPLC, (LaChrome, Hitachi, Tokyo, Japan) according to Kodaka et al. (1985) with little modification. in brief, samples were homogenized with 5% metaphosphoric acid and centrifuged at 3000 rpm at 4°C for 10 min. The supernatant was derivatized with 2, 4-dinitrophenylhydrazine (DNPH) and 2-6 dicholorophenol-indophenol, and then incubated at 50°C for 90 min. The reaction mixture was cooled; ethyl acetate was added and shaken for 60 min. Later on, the samples were centrifuged at 3000 rpm for 15 min. One ml of the supernatant was further centrifuged at 13.4 x 1000 rpm for 15 min (Mini Spin, Eppendorf AG, Hamburg, Germany) and 20 ,u/ supernatant was injected into HPLC with a partisil column (silica 5 p.m, 4.6 >' 200 mm, GL Sciences, Tokyo, Japan). Mobile phase with ethyl acetate: hexane: acetic acid (5: 4: 1) was applied at the flow rate of 1 ml/min, and absorbance was monitored as AsA peak at 495 nm. The dietary APM level was determined by HPLC using a reversed phase column (Wakosil 5 C18, 6 x 150 mm, Wako Pure Chemical, Osaka, Japan). Mobile phase was 0.1 M KR,Paisolution. at pH 2, and flow. rate was adjusted to 0.5 m//min. Diets were homogenized with 5% metaphosphoric acid and centrifuged at 3000 rpm for 10 min at 4°C. The resultant supernatant was then filtered with Sep-pak cartridge with 0.45 pm pore size (Toyo, Tokyo, Japan). Then 20 pi of filtrate was injected into the HPLC system and absorbance was monitored as AsA peak at 245 nm.. 4.2.4. Statistical. analysis. Data were analyzed. by using the same method. as cited in chapter. 2.. 4.3 Results. 4.3.1 Growth performance The growth performance of juvenile PBT fed the experimental diets presented in Table 4.2. Significantly lower final body weight of fish fed APM0 was recorded; however, there were no significant differences among other diets. Weight gain (%) was significantly higher in fish fed the APM, oodiet than that of other dietary treatments except APM400 (P<0.05). SGR and total feed consumption was also significantly lower for the fish fed APM0 diet than other dietary treatments. FE of fish fed APM0 and SL was significantly lower than any other diets. Fish fed APM0 began to show AsA deficiency signs, such as retarded growth, dark pigmentation, anorexia, loss of equilibrium, pale liver, appetite loss, bottom dwelling and high mortality, after 5 days of the feeding trial and this treatment was terminated on day 12 when the mortality reached around 80%. However, fish fed with APM400,APM400, APMPoo, APM 1600 and SL didn-t show any significant differences in survival (Fig. 4.1). 4.3.2 Carcass proximate composition and nutrient retention efficiency Carcass proximate composition, nutrient and energy retention efficiencies are presented in Table 4.3. Significantly higher moisture content was found in the fish fed APM0 diet followed by SL. However, significantly higher crude protein content was found in fish fed APMsoo and APM Poo, and the lowest was —99—.
(30) 71<fif. observed. 1 2. in fish fed APM0 and SL. Significantly. APMpoo diets. PRE was significantly ERE was significantly. (2 0 1 0 ). higher. crude lipid was found in fish fed APM400 and. higher in APM800 and APMpoo fed fish than that of other groups.. higher in APM800, APMpoo and APMi000 dietary groups than that of APM0 and SL. group (P<0.05).. Table 4.2. Growth performances of juvenile PBT fed the experimental diets with different levels of APM supplementation Diet APM0. Initial. Initial body wt (g). 0.27. Initial body length (cm). 2.69. Final body wt (g). 1 .(1:0. 16. Final body length (cm). 5.4±0.0b. Weight gain (%). APM,„. 6. 8t0.2a 8.4+0.0a 1896.0+50.5b. 628.2±10.6d. SGR (%). 266.8-1-1.1b. FE (%). 1 1 7.6±-1 . 1 b. CF. 142.7.2.8a 1.1.0.0. 1.2±0.0. APM ~701. 6,5.0.2a. 6.9±0.2a. 6.6.f0.5a. 8.3± 0. 1a. 8.4+0.1a. 8.3i: 0.1 ah. 1986.9+29.4a. 17 82.5 ±45.5bc. 1793.8.11.013c. 23.0±0.2a 840.5.27.6a. 16.1±0.3h. Feed consumed (g). APM800. APM,6,),„. 3. 4. 5. 6. Rearing Fig. 4.1.. 8.5±0.2a 1 706.4±6 1 .6c. 22.7±0.3a. 23. 1±0.2a. 22.8 ±0.5a. 23.3+0.4a. 870.3±84.8a. 768.3+82.5a. 849.2±6.2a. 147.6±3.5`. 143.8.2, 1.0a. 1 18.8±3.4b. 1.2±0.0. 1.2±.0.1. 1 .1 ±0.0. 143.5. 1.6a. 1.2±0.0. Values are means±SE of 2 groups of fish with 300 fish per group.. 2. 7. 1 ±0.4a. 797.5±26.5a. Values in a raw with different letters are significantly different (P<0.05).. 1. SL. 7. 8. period. 9. 10. -9--A-. AP MO APM400 APM800. X -X -0-. APM1200 APM 1600 SL. 11 12 13. 14. (day). Changes in survival rate of juvenile PBT fed the different test diets.. - 100 -.
(31) B.K. Biswas : Formulated diet for juvenile bluefin tuna. Table 43. Proximate composition, nutrient and energy retention efficiencies in juvenile PBTfed experimental diets Diet APM,. ,0,1. APM,,,,,. SL. Initial. APM„. APM,„„. APM,„„. Moisture (%). 83.2. 82.5±0.3d. 77.7±0.7c. 78.1+0.3'. 78.2±0.41. 78.1±0.2c. 79.2±0.8h. Crude protein (%). 12.4. 12.7±0.4d. 15.8+0.31'. 16.7+0.2". 16.5±0.311. 16.0±0.2he. 1 5.5±0.7c. Crude lipid (%). 1.7. 1.6±0.1c. 2.2+0.1'. 1.7+0.1 be. 2.3+0.1'. 1.9±0.2h. 1.6+0.11'. 2.9±0.1. 2.9+0.1. 2.9+0.1. 2.8+0.1. 2 1 .3+0.0. 21.5+0.0. 21.4+0.0. 33.6+0.3'. 31.1+0.8h. 13.2±0.0°. 23.2+0.8'. 22.7±0.9a. 12.1±0.3'. Crude ash (%). 2.6. 2.9+0.1. 2.9+0.1. Energy (kJ/g). 20.5. 17.8+0.1. 22.1+0.1. 21.5+0.0. Retention efficiency. (%). PRE. 19.6+0.6`. 3 0.5±0.6h. 35.1+0.. ERE. 18.3±0.7h. 21.3+1.1A. 24.9±1.7`1. Values in a raw with different. letters are significantly. 1a. different (P <0.05).. Values are means+SE of 2 groups of fish with triplicate samples from each group.. 4.3.3 Digestive organ indices Although VSI was significantly higher in the fish fed APM0 and APM, oodiets than that of SL, there was no major variation in HSI, ISI and SSI among the treatments (Table 4.4).. Table 4.4. Biological measurements of digestive organs in j uvnile PBT fed experimental diets Diet AP M0. AP M400. APMS 00. APM 9.2+1.13 1.9+0.4. 1.8+0.4. 2.1+0.6. 3.2+0.7. 2. 1 ±0. 6. 1.0+0.1. 0.9±0.3. 9.1±1.7ab. HSI. 2.2±0.6. 2.0±0.4. 2.4+0.6. 1.2+0.2. 3.0+0.4. SSI. 0.9+0.6. 0.9+0.2. 1.0+0.2. SL. 3.1+0.3. 8 .2±0.5ah. 2.6+0.9. 600. 7.0±0.6h. 9.2±1.1a. ISI. APM,. 8.7±1.0ah. VSI. 3.1+0.6. 00. Values in a raw with different letters are significantly different (P <0.05). Values arc means±SE of 2 groups of fish with 5 fish per group.. 4.3.4 Liver and brain AsA contents Liver and brain AsA content increased with the increasing dietary APM supplementation. Significantly higher AsA content for both liver and brain was found in fish fed APMpoo and APM 1600than those from other dietary groups (Fig. 4.2). Interestingly, total AsA was undetectable in liver of fish fed APM0 diet while the liver AsA levels in fish fed the other diets generally reflected dietary supplementation (Fig 4.2). SL contained comparatively very lower amount of AsA; however, the values observed in liver and brain of this group were in between APM400and APM800.. 4.4 Discussion. The higher growth performance, nutrient retention efficiencies, and liver and brain AsA contents in fish fed APM poo diet suggests that the suitable level of AsA for juvenile PBT juvenile is ca. 454.0 mg/kg diet (1200 mg APM). Although the AsA requirements vary considerably among species and even within the same species under different culture conditions, this present study indicated comparatively higher AsA —101—.
図
+7

関連したドキュメント
Synthesis of immediate early (IE) proteins was analysed by SDS- PAGE according to the method described by Blanton & Tevethia (1981). HEL cells grown in 25 cm 2 culture flasks
Met expression in A2058 melanoma cells was relatively heterogeneous, and a re- analysis of Met-low and Met-high cells after cell sorting indicated that Met-low and Met-high
東京大学 大学院情報理工学系研究科 数理情報学専攻. [email protected]
情報理工学研究科 情報・通信工学専攻. 2012/7/12
Provided that the reduction of the time interval leads to incomparableness of normalized bubble-size distributions and does not change the comparable distributions in terms of
Kindly inform your waiter if you are allergic to certain foods or are observing dietary restrictions.
We have studied the effects of different treatment regimens on both the tumour growth and the immune response within the simple ODE model that describes tumour-immune dynamics
Using right instead of left singular vectors for these examples leads to the same number of blocks in the first example, although of different size and, hence, with a different
