Effects of Planting Hole and Soybean Canopy on Soil
Temperature Beneath Film Mulch
Teerasak PONGSA-ANUTIN, Nobuyuki OKUDA and Haruo SUZUKI
Abstract
This experiment examined how the planting hole diameter of films used in film mulch cultivation affects the soil temperature, in relationship to soybean. The experiment was conducted from March to June 2007. In zones without vegetation, the albedo and surface temperature of film mulch changed in proportion to the planting hole diameter. In zones with vegetation, no obvious correlation was observed. In vegetation-free zones, the daily maximum and mini-mum soil temperatures were lower when the planting holes were larger. In vegetation zones, no distinct relationship was found. In all zones, the daily range ratio of soil temperature related to the planting hole diameter and the daily range ratio were also affected by the ground coverage rate. Both with and without vegetation, the daily range ratio of soil temperature was smallest in zones with 16 cm diameter planting holes.
Key words : Mulch, Planting hole, Soybean, Soil temperature.
1.Introduction
The variations of soil temperature beneath the film mulch were effected by many factors, for example the percentage of the mulch cover, the planting hole size, and etc(1). An effect of
the planting hole size on soil temperature without plant condi-tions has already been reported by Suzuki et al.(2). They
sum-marized that the relationships between the planting hole size and a daily range of soil temperature were varied depending on seasons. However, these relationships under the plant con-ditions have not been known much in details. From previous paper(3) that using Japanese radish as the test plant, the ratio
of daily range of soil temperature was the lowest in the plots with planting holes, 10 cm in diameter.
As reported by Duangpeang et al.(4), the soil temperature
were depended on the plant canopy type. They concluded that the soil temperature in the plots with a large plant coverage was lower than those under the smaller ones although they had the same LAI. Thus, plant canopy type was important fac-tor. In this experiment, soybean was used as the test crop. The objective of this experiment is to clarify the effect of soybean canopy and the diameter of the planting hole on soil temperature.
2.Materials and Methods
2.1 Experimental plots
This experiment was carried out from March 26 to June 25 in 2007. Four ridges were made in a field stretching from east to west and each ridge was 14.0 m long, 1.0 m wide, and 20 cm high. Each ridge was divided into two parts; one with plants and another one without plants. Each divided ridge was further divided into plots depending on size of the planting holes in the film mulches. Thirteen experimental plots were established in total. Black polyethylene film (0.02 mm) was used as the mulch material, and soybean (Glycine max L., cv. Kurodaizu) was used as the test crop. The experimental de-tails were shown in Table 1.
2.2 Measurements
During the experimental periods, solar radiation, albedo, heat balance, soil temperature, and soil moisture were mea-sured. Solarimeters (Iio, S-SR2) and albedometers (Eiko, MR-21) measured the solar radiation and albedo. The net radiation in the heat balance was measured using net radiation meters (Eiko, CN-40) placed in the center of each experi-mental plot at 50 cm above the ground. Soil heat flux was measured using heat flux plates (Eiko, CN-8), which were laid below the soil surface, covered with about 2 mm of soil, in the center of each experimental plot. Sensible and latent
heat fluxes were not separated. The total of the sensible and latent heat fluxes was calculated as the remainder in the heat balance.
Soil temperature sensors were made using type-T thermo-couples. In each plot, ten sensors were laid underground at 10 cm depth at intervals of 30 cm in the direction of the ridges. The soil temperature at 10 cm depth is used as the representa-tive soil temperature in experiments on mulches. These mea-sured values were recorded twice a day at 6:00 and 15:00. For soil moisture, soil moisture tension was measured, us-ing tensiometers (Daiki, DIK-8343) laid underground at 10 cm depth. Although tensiometers and soil temperature sen-sors were both laid at the same depth, they were kept at least 10 cm away from each other. The tension was measured at 6:00 and 15:00. Soil water content was also measured. Ap-proximately 15 g of soil was taken from two places per plot, at 10 cm depth. Water content was determined using the oven-drying method.
As for other meteorological factors, data observed at the observation field adjoining the experimental field was used.
3.Results and Discussion
3.1 Radiation in each plot
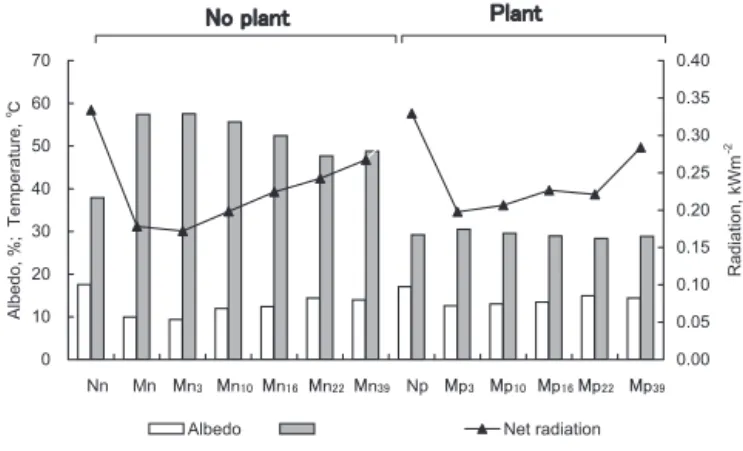
The relationship between the albedo, the surface tempera-ture and the net radiation in each plot were shown in Fig. 1.
Under no plant conditions, the albedo in the Nn plot was 17.6%, and in the Mn plot was much lower, 9.3%. As the planting hole diameter became larger, from Mn3 to Mn22, the
albedo increased up to 13.3%. The larger in the planting hole diameter caused the albedo to be higher. The same tendency was also observed in the plots with plant, but the average albedo in all plots under a plant condition was 10.1% higher than those under no plant condition. Comparing the varia-tions of the albedo for the periods of at 34 DAS (29% of the shadow ratio) and 54 DAS (85% of the shadow ratio), the value at the 34 DAS was 14.3% higher than that at the 54 DAS. These results agreed well with the results of Andre and Viswanadham(5). They have reported that the albedo increased
with an increasing of the plant coverage.
For a row surface temperature under no plant condition, comparing to that of the albedo, the temperature showed an adverse tendency. The temperature decreased when the size of the planting hole size increased, except in the Mn39
experi-ment. Much lower of the soil temperature in Mn22 could be an
effect of a thick air layer between the film mulch and the soil surface which acted as an insulator(6).
The surface temperature, under the plant conditions, showed the same tendency as those in the plot without plant. However, the average temperature of all plots was 21.8ºC low-er than those undlow-er no plant condition. Considlow-ering the tem-perature at 34 DAS and 54 DAS, the average at 54 DAS was approximately 1.9ºC lower than those at 34 DAS. This could be due to a change of an evapotranspiration with crop devel-opment as reported(5). When the LAI of plant was increased,
the surface temperature became lower by an increasing of the evaporatranspiration.
The net radiation in the plot under no plant conditions and Table 1 Experimental details.
Diameter2) Mulching Space of
Plot1) cm coverage planting
ratio3), % hole4), cm No plant Nn - 0 Mn - 100 Mn3 3 99.5 50a x 25b Mn10 10 93.9 50 x 25 Mn16 16 84.5 50 x 25 Mn22 22 70.6 50 x 25 Mn39 39 53.9 50 x 50 Plant5) Np - 0 50 x 25 Mp3 3 99.5 50 x 25 Mp10 10 93.9 50 x 25 Mp16 16 84.5 50 x 25 Mp22 22 70.6 50 x 25 Mp39 39 53.9 50 x 50
1)Plot symbol. N: No mulch, M: Mulch, n: No plant, p: Plant. 2)Diameter of planting hole.
3)Ratio of mulching coverage to row soil surface. 4)a: Interrow space, b: Intrarow space.
5)Soybean(Glycine max L. cv., Kurodaizu).
Fig. 1 Albedo, surface temperature and net radiation of each plot measured at 11:00-11:45 on May 8 in 2007.
without mulch (Nn; 0.47 kWm−2) was lower than those in
the plots with mulch, except in Mn39 (an average net
radia-tion of all plots was 0.51 kWm−2). Generally, covering the
row surface with black film mulch could increase a soil heat flux and decrease a sensible and latent flux at the surface(7,8).
Hence, the net radiation increased in the mulched plots. When comparing the net radiation among the mulched plots, net radiation in all plots was almost the same and it in the range of 0.51-0.53 kWm−2, except in Mp
39. In Mn39, which was large
hole diameter, the net radiation was lower than the other mulch plot, became of the mulching coverage was decreased. Under the plant conditions, the effect of the planting hole size on the net radiation was not clearly observed. Nonethe-less, the average of the net radiation of all plots with plant was higher than that without one.
Under no plant conditions, the correlation between the al-bedo and the planting hole diameter could be noticed while no definite correlation was observed between the albedo and the net radiation. This tendency was not observed in the plots with plant.
3.2 Daily variations of the air and soil temperature Air temperature: The daily variations of the air tempera-ture in the plots with/without mulch, and with/without plant (Nn, Mn, Mn10, Mp10) were shown in Fig. 2.
According to Fig. 2, at 10:00, the temperature at a height of 1 cm in Nn plot was about 3ºC higher than that just above the planting hole while the temperature at each height, from 11 cm to 40 cm high, was not much different. The tempera-ture difference between 1 cm and 11 cm high was found to be the biggest (3.6ºC) at 12:00. After 12:00, the temperature difference became smaller. From 18:00 of May 21 to 10:00 of May 22, the temperature near and above the ground was almost the same. In the mulched hole without planting (Mn), an hourly change of the air temperature at 1 cm high above the hole was much larger than that in the Nn plot. However, from the height of 11 cm to 40 cm, the hourly change of the temperature at each height in the Mn plot was almost in the same degree as found in the Nn plot. In the mulched plot with 10 cm of a planting hole (Mn10), the hourly changed of the air
temperature showed the same tendency as that in the Mn plot. Nevertheless, the air temperature in Mn10 plot at 1 cm high
was lower than the temperature in the Mn plot. In the Mp10
plot, the daily variation of the air temperature in this plot was smaller than the others.
Soil temperature: In the Nn plot from 10:00 to 16:00, the highest temperature (40ºC to 45ºC) was observed near the row surface. After 18:00, the temperature near the ground started to drop, and was in a range of 10ºC to 20ºC after 19:00. The soil temperature stayed high, 20ºC to 25ºC, for the depth about 10 to 20 cm. After 6:00 of the following day, May 22, the temperature started to increase.
In the Mn plot, the change of soil temperature was much larger than that in the Nn plot. The surface temperature, par-ticularly around noon, was about 50ºC to 55ºC which had not been observed in the Nn plot. Furthermore, at 10 cm deep, an isotherm of the soil temperature in the range of 25ºC−30ºC was larger than that in Nn plot. In the Mn10, the hourly
chang-es of soil temperature showed the same tendency as noticed in the Mn plot. However, soil temperature in the Mn10 plot was
lower than in the Mn plot because the latent heat flux from the row surface increased in an existence of a planting hole. In the Mp10, the hourly changes of soil temperature were a
little smaller than in the Mn10 because an effect of the plant
canopy.
In order to clarify the daily variation of soil temperature, the temperature was measured at 0 cm, 2.5 cm, 5 cm, 10 cm, 20 cm and 30 cm in depth. The daily mean (a0), the daily
range (a1) and the phase angle of soil temperature (ε1) were
calculated using the harmonic analysis (Table 2).
Fig. 2 Daily isotherm of soil temperature in the plot with and without canopy under mulch and no mulch plot from 10:00 of May 21 to 10:00 of May 22 in 2006.
The daily mean and the daily range of soil temperature in each plot showed the highest values at 0 cm and decreased as the soil depth increased. In the Nn plot, the average daily mean of soil temperature from 0 cm to 30 cm was 3.4ºC and 1.3ºC lower than those of the Mn and Mn10, respectively,
be-cause of the effect of mulch. In the Mp10 plot, the average
dai-ly mean for all depth was 0.1ºC lower than those found in the Nn plot owning to the effect of the plant canopy. The average of daily range (0-30 cm) in the Nn plot was 0.6ºC and 0.1ºC higher than in the Mn and the Mn10, respectively. The phase
angle of soil temperature became smaller with an increasing of the soil depth. This tendency was found both in the plots with and without mulch whether or not there was plant. None-theless, the change of soil temperature in the Nn plot was higher than the others. Comparing between the changes of soil temperature in the Mn and Mn10 plots, the changes of soil
temperature in the Mn10 was little smaller than the changes in
the Mn plot. The smaller changes of soil temperature were no-ticed when there was plant.
The changes of air and soil temperature were affected by mulch, the planting hole and the plant canopy. Mulch could increase soil temperature when compared to the Nn plot. The temperature difference between mulch and the Nn plots became lower when the planting hole existed. Moreover, the effect of mulch and the planting hole was suppressed by the plant canopy.
3.3 Soil temperature
3.3.1 Period average of soil temperature and standard deviation
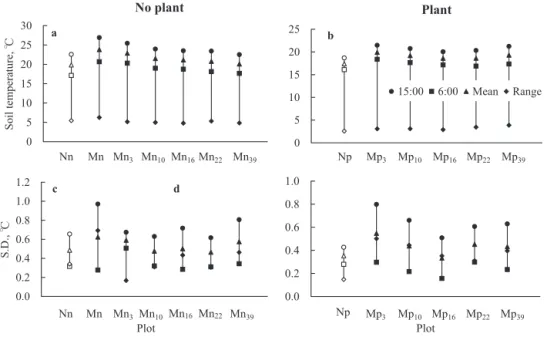
Soil temperature: Average maximum, minimum, mean and range of soil temperature and their standard deviation were shown in Fig. 3.
Under no plant conditions in Fig. 3(a), the maximum of 10 soil temperatures was the lowest in the plot with no mulch (Nn). The highest temperature was observed in the Mn plot, and the temperature in the other mulch plots decreased as the size of the planting hole increased. This related to the results reported in the previous experiment(3) that the mulching
cov-erage decreased as the planting hole diameter increased. The same results were reported by Li et al.(1) that soil temperature
depended on the mulch coverage. When the mulch cover-age was decreased, soil temperature beneath the film mulch became lower. The minimum and the mean value of soil temperature also showed the same tendency as the maximum soil temperature. The daily range of soil temperature was rela-tively stable and stayed within the range of 4.8ºC− 6.2ºC. Under plant conditions (Fig. 3(b)), the maximum soil temperature in the plots without mulch (Np) was lower than those in the mulched plots. Comparing among the mulched plots, the maximum soil temperature was found to be the low-est in the Mp16, because the shadow ratio of this plot (Mp16)
was higher than the other plots. Soil temperature was related with the solar radiation(9). When the plant coverage showed
by the shadow ratio of the plant canopy was increased, soil temperature became lower. The minimum and the mean of soil temperature showed the same tendency as the maximum soil temperature. The daily range of soil temperature in the Nn plot (2.6ºC) was lower than those in the mulched plots. Under mulch conditions, the daily range was gradually increased as the planting hole size increased, except in the Mp16. The
low-est daily range in the Mp16 plot could be explained in term of
the highest shadow ratio that could reduce an incoming of the solar radiation during the daytime and could intercept an out-going long-wave radiation during the night time. The shadow ratio of soybean for each plot was shown in Fig. 4. The high-est and the lowhigh-est shadow ratio were observed in the Mp16 plot
(70.9%) and the Mp39 plot (48.9%), respectively.
Standard deviation: Under no plant conditions (Fig. 3 (c)), the maximum soil temperature of the 10 points in the
Mn plot appeared to be the highest standard deviations (1.0ºC) because of a high soil temperature. The standard deviation showed a positive relationship with soil temperature. In gener-Table 2 Harmonic coefficients for the daily cycle of soil
temperature from 10:00 on May 21 to 10:00 on May 22 in 2007. a0 : Daily mean temperature, a1
: Daily range of temperature(ºC), ε1: Phase angle
(deg.) Depth a Nn Mn 0 a1 ε1 a0 a1 ε1 0 cm 25.0 ºC 15.5 ºC 50° 15’ 27.6 ºC 12.5 ºC 33° 49’ 2.5 22.9 8.1 21 26 26.9 7.3 354 69 5 22.1 5.5 349 92 26.0 6.0 335 77 10 21.4 4.4 322 51 24.9 4.5 298 04 20 19.7 3.2 259 61 22.8 3.3 252 39 30 18.8 2.8 242 47 22.0 2.5 237 52 Depth Mn10 Mp10 a0 a1 ε1 a0 a1 ε1 0 cm 26.2 ºC 12.7 ºC 33° 05’ 24.7 ºC 9.3 ºC 19° 51’ 2.5 24.7 7.6 3 03 22.9 5.8 341 17 5 23.7 5.9 340 91 22.2 4.9 325 42 10 22.6 4.4 310 00 21.1 3.9 297 38 20 20.6 3.2 257 51 19.6 2.7 265 61 30 19.9 2.6 241 93 18.9 1.9 257 79
al, the standard deviation (S.D.) of soil temperature increased with an increasing of soil temperature. From the Mn3 to Mn39
plots, the difference of the deviation was rather small. The average of S.D. in all of the mulched plots was 0.7ºC. The S.D. of the minimum soil temperature in all plots was approximate-ly 0.3ºC. The deviation of mean soil temperature showed a similar tendency as the maximum soil temperature. The daily range of the S.D. was found to be the smallest in the Mn3
be-cause of high soil moisture content. The relationship between the S.D. and the soil moisture content was reported by Suzuki and Tanada(10). They reported that the variation of the S.D. of
soil temperature was related to soil moisture content, which would decrease with an increasing of the soil moisture con-tent.
Under plant conditions (Fig. 3(d)), the S.D. of the maxi-mum soil temperature in the plot without mulch (Np) was lower than those in the plots with mulch. In the mulched plot, the highest S.D. was observed in the Mp3 plot (0.9ºC)
while the lowest S.D. was found in the Mp16 because of a high
shadow ratio in the Mp16 plot. Arya(11) reported that the
varia-tion of soil temperature was depended on the shading of plant canopy, which would be decreased with an increasing of the shading. The minimum and the mean of S.D. showed the same tendency as that of the maximum. The daily range of the S.D. almost showed the same tendency as that of the maximum. However, the S.D. of range was lowest in the Mp22 because of
a small difference between the maximum and the minimum of soil temperature affected by the high soil moisture content as
Fig. 3 Mean soil temperatures for 10 point and their standard deviations in each plots from April 13 to June 23 in 2007.
Fig 4 Mean of shadow ratio that measured every 5 days from April to June in 2007.
previous report(2).
Soil temperature in the plots without plant increased as the planting hole size increased. This tendency was not observed in the plots with plant. The temperature was lowest in the Mp16, which was decreased by the high shadow ratio. The S.D.
of soil temperature was related to soil temperature depended on soil moisture and a plant growth.
3.3.2 Frequency distribution of soil temperature The characteristics of distribution patterns of the experi-ments were shown by the maximum frequency of soil temper-ature difference. Fig. 5shows the maximum frequency under plant condition between each plot and the control plot (Nn). At 6:00, the maximum frequency in no mulch plot (Np) was about −0.8ºC, which was significantly lower than those in the mulched plots. The maximum frequency in the mulched
plots was highest in the Mp3 case (1.2ºC) due to a high
per-centage of a mulched coverage. While the maximum frequen-cy compared from Mp10 to Mp39 was relatively stable staying
within the range of −0.32 to 0.42ºC.
At 15:00, the maximum frequency in no mulch plot (Np) decreased to −3.4ºC. In case of the mulched plots, the fre-quency was noticed to be the highest in the Mp3 plot because
a smaller hole could reduce the latent heat escaped from soil surface to the atmosphere. On the other hand, the frequency was found to be the lowest in the Mp16 because its high
shad-ow ratio could prevent the incoming solar radiation.
In both of 6:00 and 15:00 observations, the maximum frequencies changed by the effect of the planting hole. The maximum frequency was highest in the Mp3 plot having small
holes.
3.3.3 Order relationships of the soil temperature be-tween two plots
Frequencies of the order relationships of soil temperature between any two plots were determined using t-test method as a reference(10). Fig. 6showed the order relationships between
two plots divided into three sections. The topmost section was for the shadow ratios of 0-30% (a), the middle one was for the shadow ratio of 30-60% (b), and the last one was for the shadow ratio of 60-90% (c).
Shadow ratio 0-30%: At 6:00, for the Np - Nn relation-ship, the frequencies when Np > Nn and Np ≒ Nn rela-tionships were about 5% and 29%, respectively. While the frequency of Np < Nn relationship was accounted for around 67%. In the Mp3-Nn relationship, the frequency of the Mp3
> Nn relationship was accounted for 100%. When the plant-ing hole was larger than 3 cm, the frequency of mulch (Mp10,
Mp16 and Mp22) > Nn relation was decreased, except in the
Mp39. On the other hand, the frequencies of mulch < no mulch
and mulch≒no mulch relationships were increased with a size of hole. This was caused by the effect of the planting hole that could decrease soil temperature when increasing the planting hole size(2).
At 15:00, the relationship between each plot with a planting hole (Mp10, Mp16 and Mp22) and Nn plot was about 41% of the
mulch < no mulch relationships. This relationship increased when the hole diameter was larger than 22 cm. While, the fre-quency of mulch > no mulch and mulch ≒ no mulch relation-ships tended to increase as the hole size increased.
Shadow ratio 30-60%: At 6:00, the frequency of order relation of all plots showed the same tendency as those in
0-30% of shadow ratio cases.
At 15:00, in the Np-Nn relationship, soil temperature showed only the “Np < Nn” relationship. In each planting hole and Nn relationship, the frequency of mulch > no mulch, and mulch ≒ no mulch relationships in all relations almost showed the same tendency as that at 6:00. Whereas, the mulch < no mulch relationship was observed to be approximately 50% for all of the relationships.
Shadow ratio 60-90%: At 6:00, in the plots with mulch, the frequency of mulch > no mulch and mulch ≒ no mulch relationships showed the same tendency as that in 0-30%. Whereas, the frequency of mulch < no mulch relationship in all relations became longer when the planting hole size was increased due to the effect of mulch, except in the Mp39-Nn
relation. When the planting hole diameter was increased, soil temperature in the larger hole became higher and almost to be equal to that in the Nn plot resulted from the decreasing of the mulch coverage.
At 15:00, soil temperature in the Nn plot was clearly seen to be higher than all of the other plots with mulch because of the effected of the plant canopy. Increasing the plant cover-age would decrease soil temperature difference between two plots because it decreased an amount of solar radiation at the soil surface. Suzuki et al.(12) and Teasdale and Abdul-Baki(6)
reported the differences of soil temperature between the two plots was decreased with the decreasing of the amount of solar radiation.
As mentioned earlier, at 6:00, the variation of soil tempera-ture depended on the planting hole size and the plant stage. At Fig. 5 Maximum frequency distribution of the soil
tem-perature difference between each plot and Nn plot at 10 cm depth from April 13 to June 23 in 2007. The same letter within the graph are not significantly different according the Tukey (P = 0.05).
15:00, the effect of the planting hole on soil temperature was suppressed when the shadow ratio of plant was larger than 60% of the coverage.
3.4 Ratio of daily range of soil temperature
Ratio of daily range of soil temperature was calculated by dividing the daily range of soil temperature in each plot with that of the Nn plot (Fig. 7).
Under no plant conditions, the highest ratio was observed in the plot without the planting hole (Mn: 1.16). When the diameter of the planting hole was varied to 16 cm, the ratio of the range was lower down to 0.88. However, the ratios were increased to 0.99 and 0.90 when the diameters were increased to 22 and 39 cm, respectively. An increase of the ratio in the Mp22 and Mp39 plots could be a result of much of solar
radia-tion, during the day time, that the row surface of these two plots could receive and lower the shadow ratio. On the other
hand, during the night time, an outgoing long wave radiation was almost the same as that of the other plots(2).
Under plant conditions, the ratio of the range in the plot without mulch (Np) was lower than those in the mulched plots. In the plots with mulch, the ratios increased as the planting hole size increased, except for the Mp16. The lowest
ratio was observed in the Mp16 plot because of its high plant
coverage, which could reduce an incoming solar radiation and prevented the outgoing long-wave radiation from the row sur-face.
In order to clarify the relationships between the ratio of daily range of soil temperature and the meteorological condi-tions, the studies were carried out with some experimental variations as summarized in Table 3.
According to Table 3, under no plant conditions, soil moisture content had been observed in all plots, except in the Mn10 that only air temperature was recorded. The multiple
re-gression coefficients were found to be the highest in the Mp10
plot, while the coefficients of the others were within the range of 0.313 to 0.530.
Under plant conditions, the shadow ratio was observed in all plots, except in the Mp39. The shadow ratio is one of factors
that could affect the variation of soil temperature. Numbers of explanatory variables were increased twice as much as those for the conditions under no plant. Furthermore, the multiple regression coefficients values of all plots in plant conditions were higher than those in the plots without plant.
The variation of the ratio of range was depended on the planting hole diameter and soil moisture content under no plant conditions. While the under plant conditions, the shadow ratio was high in relation with the variation of the range ratio. 3.5 Growth and yield of soybean
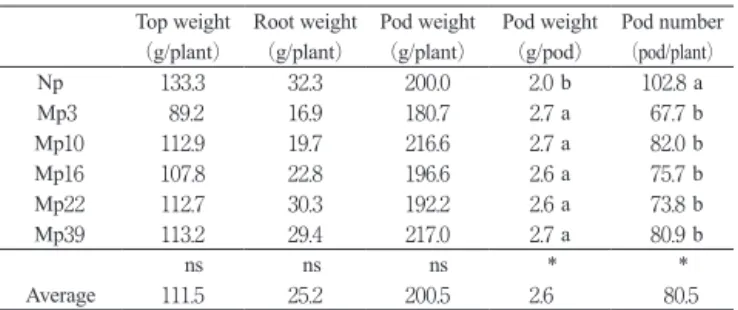
The yield of soybean was examined in June 25 in 2007 (Table 4).
Fig. 6 Order relation of frequency of soil temperature dif-ference at 10 cm depth between the two plots under soybean canopy from April 13 to June 27 in 2006.
Fig. 7 Ratio of daily range of soil temperature in each plot to that of plot Nn(control) from April 13 to April 23 in 2007.
Comparing the yield of soybean between the mulched and no-mulched plots, significantly differences were not observed in the shoot, root and pod weight. Whereas, pod weight and the pod number were significantly affected by the mulch. The average of the pod weight of soybean in a mulched plot was 25.3% higher than the Nn plot. On the contrary, the pod number was 35.2% lower than that in the Nn plot. This may be a result of the mulch which could increase an availability of nutrient absorption(13). Consequently, the growth of soybean
in the plots with mulch was higher than in the plots without mulch. This result had also been reported by Suzuki et al.(14).
They reported that the height of soybean in the plots with black polyethylene mulch was higher than no mulch plots. The effect of the planting hole on the yield was not signifi-cantly observed. However, the growth and yield of soybean were the lowest in the Mp3 case because a high soil
tempera-ture in this plot might decrease the growth of soybean. In order to clarify the relationship between the yield of soy-bean and soil temperature, the correlation coefficient was es-tablished (Table 5). A significantly negative correlation was observed between the soil temperature and yield of soybean, except for the pod weight. The shoot, root and pod weight and the pod number decreased with an increasing of soil tempera-ture. This result has agreed well with the result of Pushkala and Yagarajarao(15) studied the effect of soil temperature on
the growth of soybean. They reported that the shoot weight of soybean was declined as soil temperature increased. On the other hand, a weight per pod was increased as soil temperature increased.
Mulching and the planting hole could significantly in-creased the pod weight of soybean compared to that in the Np plot. On the contrary, they also could significantly decreased the pod number. Furthermore, soil temperature had a negative correlation with the yield of soybean, but not the pod weight.
4.Conclusions
The albedo and surface temperature was correlated with the planting hole diameter under the conditions of no plant, while the correlation between net radiation and planting hole was not observed. The albedo showed positively correlations with the planting hole diameter, whereas the surface temperature showed a negative relation with the hole diameter. On the other hand, for the under plant conditions, these correlations were not clearly observed because the growing crops exerted an increasing shading effect which could limit the period of an effectiveness of a mulch. As for the changes in soil tempera-ture, under no plant conditions, the average soil temperatures for 10 points were affected by the mulch and the planting hole diameter. When the planting hole diameter was increased, the Table 3 Standard partial regression coefficients in the multiple regression of daily range ratio of soil temperature
at 10 cm depth and meteorological factors from April 13 to June 23 in 2007.
Range ratio1) Meteorological factor2)
Multiple regression Te Pr Ia Um SmA SmB Sr coefficient3) No plant Mn/Nn4) 0.517 0.459 Mn3/Nn 0.576 0.530 Mn10/Nn 0.601 0.550 Mn16/Nn -0.440 0.484 0.393 Mn22/Nn -0.391 0.411 0.313 Mn39/Nn -0.561 0.677 0.357 Plant Np/Nn -0.286 0.175 -0.911 0.975 Mp3/Nn -0.410 -0.260 -0.491 0.891 Mp10/Nn -0.424 -0.297 -0.447 0.871 Mp16/Nn 0.337 -0.390 -0.563 0.933 Mp22/Nn -0.133 -0.134 -0.117 -0.798 0.987 Mp39/Nn -0.628 -0.404 0.766 1)Criterion variables. 2)Explanatory variables.
Notation: Te: Daily mean air temp. (ºC); Pr: Amount of precipitation (mm); Ia: Amount of insolation (MJm−2day−1);
Um: Daily mean wind velocity (ms−1); SmA: Soil moisture suction of A plot (mmHg);
SmB: Soil moisture suction of B plot (mmHg); Sr: Shadow ratio (%). 3)Adjusted for the degrees of freedom.
maximum and the minimum soil temperature became lower. On the other hand, this pattern was not found under the plant conditions. However, soil temperature under plant conditions was affected by the planting hole diameter and the shadow ratio. Soil temperature was the lowest in Mp16.
As for the ratio of daily range of soil temperature, the range ratio depended on the planting hole diameter and soil moisture content under no plant conditions. On the other hand, under plant conditions, the range ratio depended on the planting hole and the shadow ratio. The range ratio was the lowest in Mp16.
This might be due to the highest shadow ratio in the Mp16 plot
reducing the incoming solar radiation during the daytime and intercepting the outgoing long-wave radiation during the night time.
As mentioned above, the mulching and the planting hole could significantly increase the pod weight of soybean com-pared to the Np plot. On the contrary, it also could significant-ly decreased the pod number. Furthermore, soil temperature had a negative correlation with the yield of soybean, except to the pod weight.
Table 4 Effects of planting hlole size on growth of balck soybean, measured on June 25 in 2007.
Top weight Root weight Pod weight Pod weight Pod number (g/plant) (g/plant) (g/plant) (g/pod) (pod/plant)
Np 133.3 32.3 200.0 2.0 b 102.8 a Mp3 89.2 16.9 180.7 2.7 a 67.7 b Mp10 112.9 19.7 216.6 2.7 a 82.0 b Mp16 107.8 22.8 196.6 2.6 a 75.7 b Mp22 112.7 30.3 192.2 2.6 a 73.8 b Mp39 113.2 29.4 217.0 2.7 a 80.9 b ns ns ns * * Average 111.5 25.2 200.5 2.6 80.5
*: Denote significantly difference at P < 0.05, ns: No significantly difference, n = 10. The same letter within the column indicates no significant difference at P < 0.05.
Table 5 Relation between average soil temperature and soybean growth form April 13 to June 23 in 2007.
Growth parameter Equation r Top weight (g/plant) Y = −14.49X + 384.57 0.888 * Root weight (g/plant) Y = −5.35X + 126 0.734 Pod weight (g/plant) Y = −1.28X + 224.62 0.077 Pod weight (g/pod) Y = 0.29X −2.83 0.884 * Pod Number (pod/plant) Y = −11.49X + 296.90 0.820 * X: Soil temperature at 10 cm depth, Y: Growht parameter
References
⑴ Li, Y., M. Shao, W. Wang, Q. Wang and R. Horton.: Open-hole effects of perforated plastic mulches on soil water evaporation. Soil Science, 168, 751−758 (2003). ⑵ Suzuki, H., D. Shirasu and T. Takemasa: Effects of
plant-ing hole of film mulch on soil temperature. Agricultural
Meteorology of Chugoku and Shikoku, 4, 1−9 (1991).
⑶ Pongsa-anutin, T., H. Suzuki, M. Matsui and N. Okuda: Effect of planting hole on soil temperature beneath film mulch. Tech. Bull. Fac. Agric. Kagawa Univ., 60, 9−16 (2008).
⑷ Duangpaeng A., H. Suzuki, K. Nakanishi, N. Okuda, T. Matsui and Y. Fujime: Effects of canopy type on soil temperature beneath film mulch. J. Agric. Meteorol., 58, 23−32 (2002).
⑸ Andre, R.. G.. B. and Y. Viswanadham: Radiation bal-ance of soybeans grown in Brazil. Agric. Meteorol., 30, 157−173 (1983).
⑹ Teasdale, J.R. and A.A. Abdul-Baki: Soil temperature and tomato growth associated with black polyethylene and hairy vetch mulches. J. Amer. Soc. Hort. Sci., 120, 848−853 (1995).
⑺ Liakatas, A., Clark, J.A., and Monteith J.L.:
Measure-ments of the heat balance under plastic mulches. J. Agric.
Meteorol., 36, 227−239 (1986).
⑻ Ham, J.M., G.J. Kluitenberg and W.J. Lamont.: Optical properties of plastic mulches affect the field temperature regime. J. Amer. Soc. Hort. Sci., 118, 188−193 (1993). ⑼ Fu, P. and P.M. Rich: A geometric solar radiation model
with applications in agriculture and forestry. Comp.
Elect. Agric., 37, 25−35 (2002).
⑽ Suzuki, H. and H. Tanada: Deviations in the horizontal distribution of soil temperatures beneath film mulch and evaluation of the mulch effect. J. Agr. Met., 44, 119−126 (1988).
⑾ Arya S.P. : Introduction to Micrometeorology. Academic Press, London. 307 (1988).
⑿ Suzuki, H., T. Hashimoto and K. Miyamoto: Studies on the microclimate of the mulched row surface. VIII. Ef-fects of canopy and mulching with black polyethylene film on the soil temperature in plastic greenhouse. Tech.
Bull. Fac. Agric. Kagawa Univ., 34, 129−138 (1983).
⒀ Clarkson, V.A.: Effects of black polyethylene mulch on soil and microclimate temperature and nitrate level.
⒂ Pushkala, S. and Y. Yagarajarao: Influence of different soil temperatures on water use, growth and internal water status of soybean. Plant and Soil, 109, 288−290 (1988).
(Accepted November, 8, 2010) ⒁ Suzuki, H., M. Uehara and H. Miyagawa: Studies on the
micrometeorology of the mulched ground surface of the rows. III. Effects of the difference of the mulching mate-rials and of the mulching methods on the growth of the crop (part 1). Tech. Bull. Fac. Agri. Kagawa Univ., 60, 37−49 (1977).