A study on Non-Correspondence in Spread between Objective Space and Design Variable Space and Application to Genetic Search
4
0
0
全文
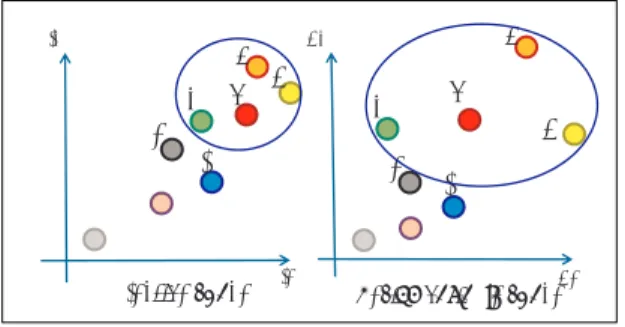
(2) Vol.2015-MPS-104 No.1 2015/7/27. IPSJ SIG Technical Report. 2. Non-Correspondence in Spread 2.1 Definition Spread. of. Non-Correspondence. in. In this paper, we focus on Non-Correspondence in Spread. The area with Non-Correspondence in Spread, called NonCorrespondence area in Spread, is defined as the area where solutions are distributed densely in the objective space but are distributed widely in the design variables space, and vice versa (Hereinafter we call simply "Non-Correspondence area."). The former means that there are a lot of design patterns with similar performance and the later means that the design variables are sensitive, i.e. the small change of design variables causes the large change of fitness values. For designers, the former is especially important because they can select design variables from some design patterns having similar performance in consideration of the cost of design or the difficulty level of design and the later is because they have to choose design variables very carefully. Figure 1 shows an example of Non-Correspondence area. In Fig. 1, data 5-6-7-8 are distributed widely in the design variable space compared to the distribution of the objective space.. neighborhood radius, flmax , flmin mean the maximum and the minimum fitness values, which are normalized, in the Pareto solutions for objective function l, and Mf is the number of objective functions. xlmax , xlmin mean the maximum range and the minimum range of design variables l, and Md is the number of design variables. If the neighborhood is defined in the objective space, the upper equations in eq. (1) and eq. (2) are employed and otherwise the lower equations are employed to calculate the value of index vi . In eq. (2), ddcik is the normalized Euclidean Distance between target individual k and the center of gravity in the design variable space, df cik is that in the objective space, N is the number of the target individuals and vi is the index for individual i. Individuals with large indexes are distributed densely in the objective space / design variable space and distributed widely in the design variable space / objective space. √∑M f 2 l=1 (flmax −flmin ) η (Neighborhood was defined in the objective space.) √ ϵ= ∑Md 2 l=1 (xlmax −xlmin ) η . (Neighborhood was defined in the design variable space.). (1) vi =. . 1 N. ∑N. k=1 (ddcik ). (Neighborhood was defined in the objective space.) 1 N. ∑N. k=1 (df cik ). (Neighborhood was defined in the design variable space.). (2). 2.3 Application to Genetic Search. Fig. 1: Non-Correspondence area in Spread. 2.2 Index for Non-Correspondence Area in Spread Here, we define the quantitative index for NonCorrespondence in Spread to extract the NonCorrespondence area. The index is calculated in the following procedure. 1) Define the neighborhood radius ϵ (eq. (1)) in the objective space or the design variable space. 2) Extract the individuals as target individuals within radius ϵ from individual i. 3) Calculate the center of gravity of the target individuals. 4) Calculate the index for Non-Correspondence in Spread vi according to eq. (2). By the above procedure, the index vi is calculated for each individual. The neighborhood radius ϵ is defined by eq. (1). In eq. (1), η denotes the parameter that defines the. ⓒ 2015 Information Processing Society of Japan. By applying the index defined above to genetic search, it is aimed to obtain solutions whose fitness values are robust to the change of design variables. In this paper, we apply the index value instead of Crowding Distance that is one of the distinguish mechanism in NSGA-II. We introduce the new search criterion R according to eq. (4) . In eq. (4), CDi is Crowding Distance of individual i and vi is the index value of Non-Correspondence in Spread defined by eq. (2). As the aim of 2.2 is to extract the Non-Correspondence area, vi is calculated using the distance between target individuals and the center of gravity of them. On the other hand, vi is calculated according to eq. (3) using the normalized Euclidean Distance ddik between the individual i and the target individual k because the index value is introduced into each individual as search criterion. In addition, this paper aims to obtain solutions with the robustness to the change of fitness values in regard to the change of design variables, then the neighborhood radius is defined in the objective space. 1∑ (ddik ) N N. vi =. (3). k=1. 2.
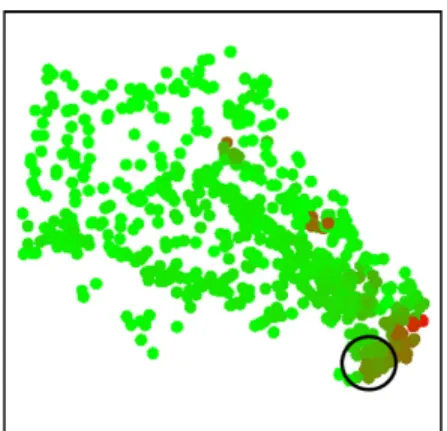
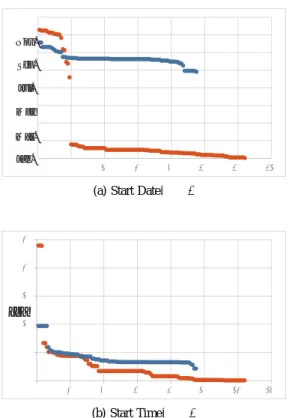
(3) Vol.2015-MPS-104 No.1 2015/7/27. IPSJ SIG Technical Report. Ri = CDi ∗ vi. (4). The larger the value of CD or v is, the larger the value of R is. Thus it is expected that this method can consider the diversity in the objective space and the robustness of fitness values.. 3. Experiment In this paper, we applied the above calculation to the trajectory designing optimization problem “ DESTINY ” provided by JAXA[13] and analyzed the obtained Pareto solutions. In the experimental condition here, population size was 100, and generation was 100. We compared the proposed method described in 2.3 and NSGA-II as the conventional method. Note that the difference between the proposed method and the conventional method was only the difference between Crowding Distance (CDi ) and Ri by eq. (4). Figure 8 shows the visualization result of the distribution of obtained Pareto solutions in the objective space by MDS. In Fig. 2, the color of solutions indicates the value of index v, in which red color means large value and green color means small value. As shown in Fig. 2, Pareto solutions by the proposed method have many solutions with large value of v compared to the solutions by the conventional method. We extracted the solutions with large value of v (in the circle in Fig. 2(b)) from the obtained Pareto solutions by the proposed method. Next, we extracted the solutions having same fitness values in the conventional method and compared the values of design variables. The maximum and minimum fitness values in the extracted solutions are shown in TABLE 1. We focused on Start Date and Time (V 1 and V 2), and showed the result of comparison in terms of Start Date and Time in Fig. 3. In Fig. 3, the horizontal axis shows the label of each solution and the vertical axis shows the value of each design variable. Red plots indicate Start Date and Time of solutions by the proposed method with the range of fitness values in TABLE 1 and blue plots indicate those of solutions by the conventional method. As shown in Fig. 3, the proposed method could obtain the solutions with Start Date and Time which the conventional method could not do (from December to February, from 23 o’clock to 2 o’clock). This result shows that the proposed method could obtain a lot of solutions having same fitness values and different Start Date and Time.. 4. Conclusion In this paper, we defined Non-Correspondence in Spread between the objective space and the design variable space. We proposed the quantitative index to extract NonCorrespondence area in Spread. This paper applied the proposed method to the trajectory designing optimization. ⓒ 2015 Information Processing Society of Japan. (a) Result of conventional method. (b) Result of proposed method. Fig. 2: Distribution of Pareto Solutions (Objective Space). Table 1: Maximum and Minimum of Fitness Values Obj1 Obj2 Obj3 Obj4 Obj5. Max 1544.51 8364.64 438.76 1.893 223.87. Min 1442.90 7999.78 424.75 1.144 218.014. problem known as DESTINY provided by JAXA and analyzed the extracted Non-Correspondence area in Spread in the obtained Pareto solutions. This paper showed that the Pareto solutions having widely different design variables with similar fitness values could be extracted. This paper also applied the defined index to genetic search and obtained a lot of Pareto solutions having similar fitness values but different Start Date and Time. For the future work, we will apply the proposed method to other problems with more objective functions or higher dimensional design variables and study Non-Correspondence in Linear Relationship. 3.
(4) IPSJ SIG Technical Report. Vol.2015-MPS-104 No.1 2015/7/27. [9] T. Yoshida and T. Yoshikawa, “A study on Non-Correspondence in Spread between Objective Space and Design Variable Space for Trajectory Designing Optimization Problem,” 2014 IEEE Congress on Evolutionary Computation (CEC), pp. 2444–2450, 2014. [10] K. Deb and R. Agrawal, “Simulated binary crossover for continuous search space,” Complex Systems, vol. 1, no. 9, pp. 115–148, 1994. [11] K. Deb and M. Goyal, “A combined genetic adaptive search (geneas) for engineering design,” Computer Science and Informatics, vol. 26, pp. 30–45, 1996. [12] J. W. Sammon, “A nonlinear mapping for data structure analysis,” IEEE Transactions on computers, vol. 18, no. 5, pp. 401–409, 1969. [13] http://www.ciss.iis.u-tokyo.ac.jp/supercomputer/about/.. Nov. Sep. Jul. May Mar. Jan.. (a) Start Date(V 1). [h]. (b) Start Time(V 2). Fig. 3: Start Date and Time. 5. Acknowledgment This research is partially supported by High Performance Computing Initiative Field 4: Industrial Innovation R and D Topic 4 [Design innovation with mutiobjective design exploration][12].. References [1] K. Deb, Multi-objective optimization using evolutionary algorithms. Wiley, 2001. [2] S. Obayashi, “Multiobjective design optimization of aircraft configuration (in japanese),” The Japanese Society for Artificial Intelligence, vol. 18, pp. 495–501, 2003. [3] K. Deb, “Unveiling innovative design principles by means of multiple conflicting objectives,” Engineering Optimization, vol. 35, no. 5, pp. 445–470, 2003. [4] K. H. Akira Oyama, Yasuhiro Kawakatsu, “Application of multiobjective design exploration to trajectory design of the next-generation solar physics satellite,” Japanese Society for Evolutionary Computation, 2010. [5] F. Kudo and T. Yoshikawa, “Knowledge extraction in multi-objective optimization problem based on visualization of pareto solutions,” WCCI 2012 IEEE World Congress on Computational Intelligence, pp. 860– 865, 2012. [6] T. Yoshida and T. Yoshikawa, “An extraction of non-correspondence area between objective space and design variable space based on order correlation of distance relation(in japanese),” The Japanese Society for Artificial Intelligence, 2013. [7] A. L´ opez, A. Oyama, and K. Fujii, “Evaluating two evolutionary approaches to solve a many-objective space trajectory design problem,” The Japanese Society for Evolutionary Computation, 2012. [8] K. Deb, A Fast and Elitist Multiobjective Genetic Algorithm : NSGA-II. 2002.. ⓒ 2015 Information Processing Society of Japan. 4.
(5)
図
関連したドキュメント
We prove that the spread of shape operator is a conformal invariant for any submanifold in a Riemannian manifold.. Then, we prove that, for a compact submanifold of a
In he following numerical examples, for simplicity of calculations he start-up time parameter is dropped in Model 1. In order to keep system idle ime minimal, the "system
The approach based on the strangeness index includes un- determined solution components but requires a number of constant rank conditions, whereas the approach based on
Thus, we use the results both to prove existence and uniqueness of exponentially asymptotically stable periodic orbits and to determine a part of their basin of attraction.. Let
The algebra of noncommutative symmetric functions Sym, introduced in [2], is the free associative algebra (over some field of characteristic zero) generated by an infinite sequence (
In Section 3 using the method of level sets, we show integral inequalities comparing some weighted Sobolev norm of a function with a corresponding norm of its symmetric
Such bounds are of interest because they can be used to improve estimates of volumes of hyperbolic manifolds in much the same way that B¨ or¨ oczky’s bounds [B¨ o1], [B¨ o2] for
Section 3 is first devoted to the study of a-priori bounds for positive solutions to problem (D) and then to prove our main theorem by using Leray Schauder degree arguments.. To show
