Doctoral Thesis
Reward-Predictive Stimuli Enhance Post-Error
Uncertainty in the Cingulate Cortex
Submitted: 01/21/2016
Brain Sciences Major
Graduate School of Brain Sciences
Jessica Elizabeth Stewart
Introduction………..….………...1
Materials and Methods……….……….……….5
Behavioral Results……….……….…………..18
fMRI Results……….……….……….………...23
Discussion……….……….……….………..36
EXPERIMENT TWO……….………41
Introduction……….……….………..41
Materials and Methods……….……….……..44
Behavioral Results……….……….………...54
fMRI Results……….……….……….………...60
Discussion……….……….……….………..78
GENERAL DISCUSSION……….……..82
Brief summary of results……….……….82
Relation of our results to “Evidence accumulation” models of error-processing and uncertainty...……….….83
How might the reward value associated with stimuli affect processing after committing to a decision? ………..……….86
How does neural activity in the MCC relate to actual self-reports of confidence? ………..…91
A system for the monitoring of uncertainty………….……….…...92
Correct/Error-processing and Confidence/Uncertainty………...………93
Relation of our results to “Distance to decision boundary” models of error-processing and uncertainty………...…………..…95
References………..…...….103
Appendix A………..…...….115
Appendix B………..…...….117
Table 2. Summary of brain activation found in EXPT1-GLM2…….….……….28 Table 3. Summary of brain activation found in EXPT1-GLM3…….…….…….34 Table 4. Summary of brain activation found in EXPT2-GLM1……….….…….61 Table 5. Summary of brain activation found in EXPT2-GLM2…….….….……64 Table 6. Summary of brain activation found in EXPT2-GLM3……….…..……67 Table 7. Summary of brain activation found in EXPT2-GLM4 and
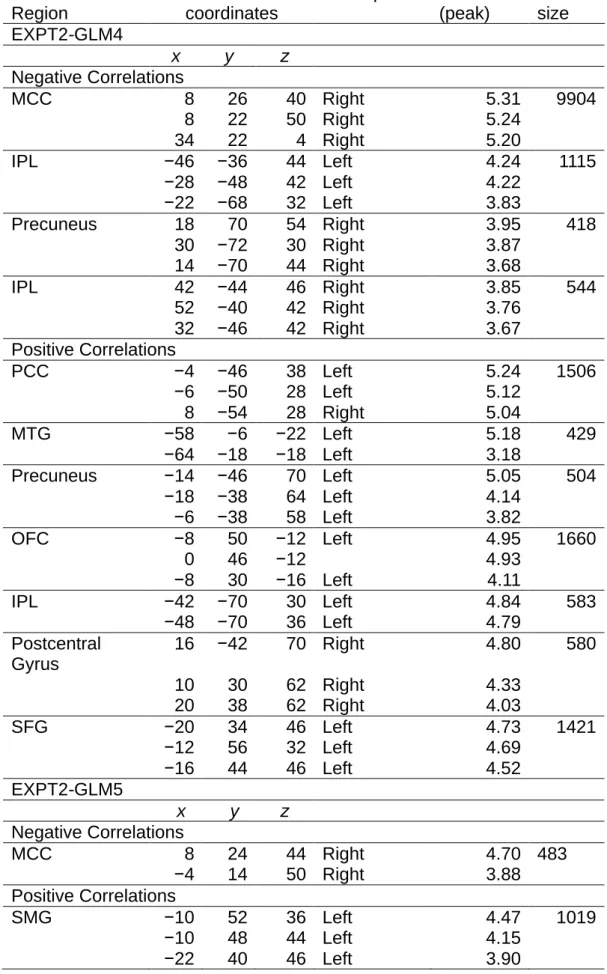
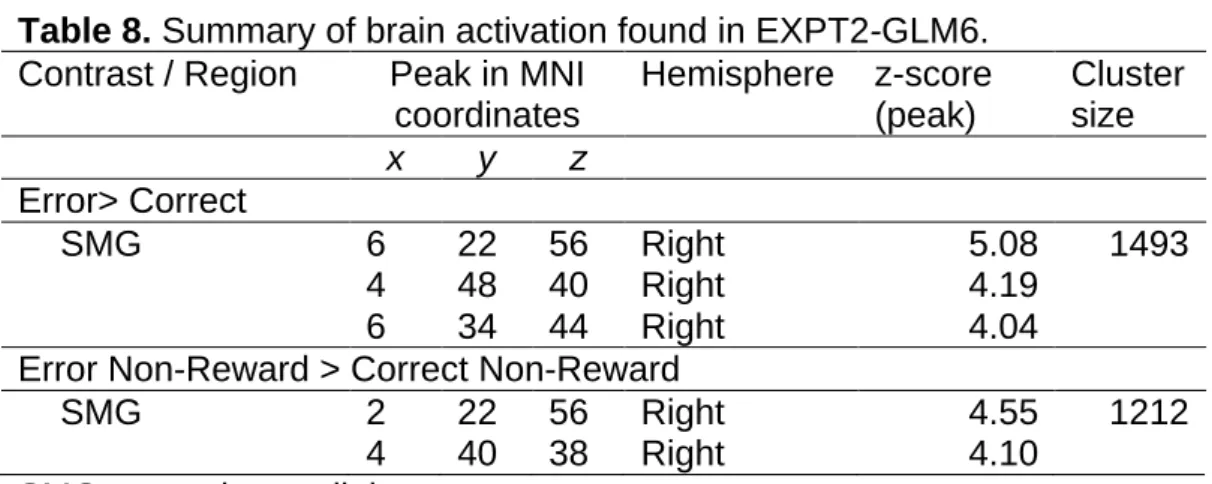
EXPT2GLM5……….……….……….……….……….……….……….………..…72 Table 8. Summary of brain activation found in EXPT2-GLM6……….…….….76
from experiment one.….………….………...………..11 Figure 2. Sequence of events in each trial on the main task of experiment one. …………...……….13 Figure 3. The accuracy and SDT results of the main task of experiment
one………...20 Figure 4. The response times of the main task of experiment one. …….……22 Figure 5. The results of EXPT1-GLM1, i.e. activity during the dot motion
period of experiment one, rendered on the template of SPM. ……....….……26 Figure 6. The results of EXPT1-GLM2, i.e. activity at the response time of experiment one, rendered on the template of SPM……….………29 Figure 7. The results of an interaction found in the MCC in EXPT1-GLM2, i.e. at the response time of experiment one, rendered on the template of
SPM……….31 Figure 8. The results of EXPT1-GLM3, i.e. activity at outcome time of
experiment one, rendered on the template of SPM. ………..35 Figure 9. Sequence of events in each trial on the psychophysical testing and training task and on the main task from experiment two………..…..……48 Figure 10. The accuracy and SDT results of the main task of experiment two.………..55 Figure 11. The response times and confidence ratings of the main task of experiment two. ………..………..…58 Figure 12. The results of EXPT2-GLM1, i.e. activity during the dot motion period of experiment two, rendered on the template of SPM. …………...…...62
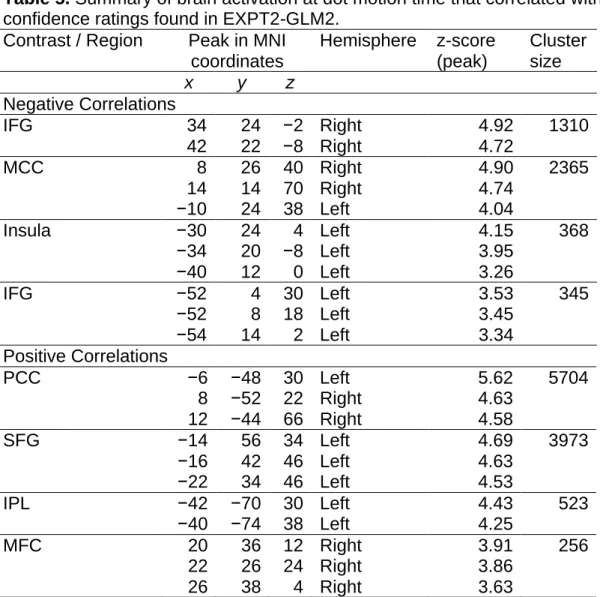
negatively with subsequently rated confidence, rendered on the template of SPM………..……..65 Figure 14. The results of EXPT1-GLM3, i.e. activity at the response time of experiment two, rendered on the template of SPM...……….….68 Figure 15. The MCC ROIs in EXPT2-GLM5, and the activity at response time that was found to negatively correlate with reported confidence, rendered on the template of SPM……….………70 Figure 16. The results of EXPT2-GLM6, i.e. activity at outcome time of
experiment two, rendered on the template of SPM.. ………..77 Figure 17. The Salience Network. ………..……..90
Experiment One Introduction
It is an awful winters evening with fog so thick you can barely see a full meter in front of you, but you are out driving on a narrow road and you come to a sharp corner. You stop for a while and look for potential headlights of cars approaching from the other direction. You see none and decide to brave the corner. After you put your foot back on the accelerator… do you stop looking for approaching cars? Hopefully not! In this case even after deciding to drive ahead it would be wise to continue monitoring perceptual information. This is because continued monitoring of perceptual information, even after we have committed to an action or response, has been shown to help us to process and thereby correct our mistakes (e.g. Hochman, Eviater, Breznitz, Nevat, & Shaul, 2015). For example, in this scenario the continued appraisal of
perceptual information might help you to realize that you had made a mistake, and that there was in fact a car approaching, in which case you could quickly swerve your car to avoid a crash. Continued monitoring of perceptual
information has also been shown to, in very worst cases, help us to prepare ourselves for impending aversive outcomes (Yu & Zhou, 2009), for example, it may help you to brace your body to deal with a crash.
Early on into the research of error-processing, it was suggested that this is similar to votes in a committee (Rabbitt & Vyas, 1981; Rabbitt, Cumming, & Vyas, 1978). The more votes that come in, the more likely the sum of these is to reflect the actual overall general consensus. Therefore, if one makes a decision too quickly before enough votes (evidence) have been accumulated, then they are more likely to come to the wrong conclusion (make an error). In this case, if one continues evaluating the incoming votes then eventually they
may find that their original decision was not in line with the overall general consensus (error-processing) and they may therefore have to adjust the conclusion (error correction). The key concepts of this analogy have since been formalized in computational models of the processing of error (for a summary of these models see Yeung & Summerfield, 2012).
A key premise for error-processing, as evident above, is that evidence must continue to be accumulated after a decision has been made. In support of this, Rabbitt and Vyas (1981) found that error correction rates, which naturally rely on the processing of errors, were reduced as stimulus duration decreased and therefore as continued processing of the evidence about stimuli became harder. Furthermore, Rabbitt (2002) found that participants were less likely to signal that they had made an error to a stimulus when it was immediately followed by another stimulus. This supports the above premise by indicating that interference of continued processing of the original stimulus prevents the detection of errors in response to it.
Neuroimaging studies have also shown evidence that the processing of errors occurs after a decision has been made. Many fMRI studies have found the anterior cingulate cortex (ACC) to be more active subsequent to
erroneous compared to correct responses (Carter et al., 1998; Carter, et al., 2001; Garavan, et al., 2002; Kerns et al., 2004; Kiehl, et al., 2000; Menon, et al., 2001). This fMRI activation has been found to correlate with the size of the classic “error-related negativity” (ERN; Iannaccone et al., 2015; Mathalon, Whitfield, & Ford, 2003). The ERN is a negative deflection in ongoing
encephalography measured from fronto-central sites on the scalp that occurs quickly, about 100ms, after an erroneous response (Falkenstein, Hohnsbein,
Hoormann, & Blanke, 1990; Gehring, Coles, Meyer, & Donchin, 1990). The ERN is thought to be sourced in or around the ACC (Herrmann, Rommler, Ehlis, Heidrich, & Fallgatter, 2004; Miltner, et al., 2003).
Related to this, fMRI studies have shown ACC activation to sometimes occur- not immediately after an erroneous response but rather- when a person subsequently receives feedback that response that they made was erroneous (e.g. Holroyd et al., 2004). This is related to another negative component in ongoing encephalography that is similarly found after feedback about errors (Miltner, Braun, & Coles, 1997). This component is often
referred to as the “feedback ERN” and this is thought to be sourced in the same area as, and to share at least one major component with, the classic ERN (Potts, Martin, Kamp, & Donchin, 2011).
Together the error-related activity in the cingulate that occurs just after an erroneous response, and the error-related activity in the cingulate that occurs when feedback informs one that their response was an error, have been proposed to form a “generic error processing system” (Miltner et al., 1997). At which of these times an error is processed is thought to depend on when this cingulate system “first determines” that an error has been made (Holroyd & Coles, 2002). Therefore, in line with models of error-processing (e.g. see Yeung & Summerfield, 2012) this may depend on how much evidence is continued to be accumulated after a decision has been made.
Interestingly, the cingulate cortex is strongly connected to the
mesencephalic dopamine system (Berger et al., 1991; Gaspar et al., 1989; Williams & Goldman-Rakic, 1993), which is part of the brains “reward processing system” (e.g. Bayer & Glimcher, 2005; Schultz, Dayan, &
Montague, 1997). Therefore, the “generic error processing system” is in a unique position where it may be able to combine processes related to error with those related to reward. Previous studies have shown that the reward value associated with stimuli can have drastic effects on information processing prior to decisions (Anderson, 2013; Marx & Einhauser, 2015; Stormer, Eppinger, & Li; 2014). Stimuli have been shown to be processed more when they are associated with reward than if they are not (Theeuwes & Belopolsky, 2012), and even when this is unnecessary or disadvantageous (Anderson, Laurent, & Yantis, 2011a, Anderson, Laurent, & Yantis, 2011b; Hickey, Chelazzi, & Theeuwes, 2010; Sali, Anderson & Yantis, 2014; Vaidya & Fellows, 2015). Therefore, if the reward value associated with stimuli can also increase their processing after decisions, then because error-processing depends on this, error-processing might be greater after decisions are made to stimuli that are associated with higher reward value.
Unfortunately, previous studies that have investigated reward value and error-processing have rewarded participants for correct responses but not for erroneous responses, thereby confounding response accuracy and value processes (e.g. Hajcak, Moser, Yeung, & Simons, 2005; Ichikawa, Siegle, Dombrovski, & Ohira, 2010; Martin & Potts, 2011). Furthermore, the design of these experiments meant that reward value was always associated with the accuracy of response rather than with stimuli, and therefore the distinct effects of stimulus value on error-processing remained unknown. In the first
experiment of this thesis, we set out to investigate the effects of stimulus value on error-processing that might occur independent to effects caused by
response-outcome associations. Specifically we wished to see if error-processing is enhanced when responses are made to stimuli predictive of reward compared to when responses are made to stimuli predictive of non-reward. We therefore created an fMRI compatible task where the stimulus shown on each trial, rather than response accuracy, was predictive of the value of the outcome. This design yielded rewarded correct, unrewarded correct, rewarded error, and unrewarded error conditions and therefore we were able to properly dissociate the effects of reward value and response accuracy.
While error-related neural activity is commonly found just after decision response time or feedback time, it was recently proposed that neural activity related to response accuracy might also occur in the ACC prior to response (Hoffman & Beste, 2015). Therefore, we investigated error-related neural activity that occurred prior to response, after response, and after error feedback, to see if and when it might be affected by the reward value
associated with stimuli. We used a perceptual decision making task with two conditions in which stimuli had higher and lower levels of expected
perceivability. This meant that we were able to test error-processing under conditions where more or less evidence about the stimuli (reward predictive or non-reward predictive) was available to be processed.
Experiment One Materials and Methods Ethics Statement
All participants were informed about the requirements of this study and completed written consent forms before it began. This study was approved by the ethics committee of Brain Science Institute of Tamagawa University. Participants
The data of eighteen neurologically and psychologically healthy, right-handed, undergraduate students (9 female, 9 male, mean age 20 ± 1.2 years; this style indicates mean ± s.d.) were included this experiment. Data of nine other participants ware excluded from analyses due to excessive motion or low error rates. When required, participants were provided with
MRI-compatible eyeglasses of the necessary strength. All participants were asked to refrain from eating for at least 10 hours before the beginning of the main experiment so as to maximize the value of the juice reward. Participants attended experiments for one hour on one day and then for two hours the next. They were compensated with a total of ¥7000.
Materials
Visual stimulus presentation was controlled using the “psychophysics toolbox” (Brainard, 1997) running on Matlab 7.1 (Mathworks, Inc.). Visual stimuli were projected to an opaque screen set inside the scanner via a (CP-SX1350, HITACHI; frame rate = 60 Hz) projector and a mirror system.
Responses were recorded using MRI compatible response pads (HHSC-2x2, Current Designs, Inc., PA, USA).
Experimental Procedure
Each participant completed the preliminary tasks and main task over a consecutive two-day period. On the first day after watching a video about MRI technology, participants completed a liquid-rating task, a practice task, a
psychophysical measurement task, and a training task. On the second day they completed the training task again, did the main task, and then once again briefly rated the two liquids that they had received in the main task.
Liquid-ratings
Six liquids (yoghurt-flavored water, apple juice, orange juice, and three ion water solutions) were rated in this task. The “juices” (yoghurt-flavored water, apple juice, and orange juice) were simply made from concentrates mixed with water. The aim in getting participants to rate these was to find a liquid that each participant liked a lot. The “ion waters” were made from different concentrations of ions and water (25 mM KCL and 2.5 mM NaHCO3 x 1, 2 or 3, with 1 liter of water). The aim in getting participants to rate these was to find a neutral tasting control (similar in content to human saliva, O’Doherty, Deichmann, Critchley, & Dolan, 2002) for each participant.
Six milliliters of each of these six liquids were provided to participants in disposable plastic cups. Participants were told that for each liquid, they were to pour all 6ml into their mouth, swish it around, and then spit it out into the provided spitting pot (following the design of De Araujo, Lin, Veldhuizen, & Small, 2013). They were told to then immediately rate what they thought about the liquid on a scale of -5 to +5 (それぞれの飲み物について、どれぐ ら 良 い ま た は 嫌 だ と 思 い ま し た か 。 ー 5 か ら + 5 で 判 断 し て く だ さ い 。 該当する数字に丸をつけてください). On this scale -5 represented very bad (とても嫌) 、﹅0 represented neutrality (どちでもない), and +5 represented very good (とても良い). Participants were told to subsequently wash their mouth out well with water, and wait 30 seconds before moving onto the next
liquid. The order in which participants were presented with liquids was randomized.
Participants’ most preferred juice was used as their “reward” in the training and main tasks. The most preferred juices were rated before the experiment with a mean of 4.3 (s.d.=0.8) and after the experiment with a mean of 3.1 (s.d.=1.7). Participants’ most neutrally rated ion water was used as their “non-reward” in the training and main tasks. The most neutrally rated ion water solutions were rated before the experiment with a mean of -0.6 (s.d.=1.4) and after the experiment with a mean of −0.5 (s.d.=1.7). Juice ratings were
significantly higher than ion water ratings (F(1,17)=126.5, P<0.001) and there was no main effect of time (before/after experiment) and no interaction
between liquid (juice/ion water) and time (before/after experiment). Practice task
Because we wanted the participants to properly understand the response mappings and task requirements before doing the psychophysical
measurement task, we had them read instructions and then complete an approximately 4.5 minute task on a computer outside of the scanner. In this task the participants used the same fMRI response pads to respond that they would also use in the scanner in subsequent tasks. This “random dot motion discrimination” task involved basic discrimination between the global direction of motion of a cloud of small moving dots. Participants indicated on each trial whether they thought the global dot movement was leftwards, in which case they pressed a button on the response pad in their left hand, or rightwards, in which case they pressed a button on the response pad in their right hand. In reality all the dots in 50% of trials moved in a leftwards global direction and all
the dots in the other 50% of trials moved in a rightwards global direction (order determined using Optseq2 (Greve, 2002)).
There were 50 trials; in each trial the following sequence of events occurred. First, a red fixation point was presented in the center of the screen for 1
second. Second, a cloud of small white dots appeared around the fixation point and these had a global motion direction of leftwards or rightwards for 0.5 seconds (speed = 5 deg/s, density = 16.7 dots/deg, size of a dot = 0.10 ✕ 0.07 deg2, visual angle = 10°). Each small white dot was shown on a given video frame, and then shown three frames later, either displaced to the left or right (to indicate global motion while preventing the participants from following any one dot with their eyes). Third, the small white dots disappeared leaving only the fixation point onscreen. This remained onscreen for 2 seconds. The participants were able to respond their perceived dot motion direction at any point from the onset of the white cloud of dots until the offset of this 2-second fixation point (in total this made a 2.5 second response window). If
participants responded the red fixation point changed to a darker red but the trial did not move on till the next screen until the response window was finished. Finally, participants were provided with feedback according to their response, either: “correct”, “incorrect”, or “you did not respond in time”. A 1 second inter-trial-interval (ITI) was inserted between all trials.
Psychophysical measurement task
After the practice task, participants completed another random dot motion discrimination task (Figure 1). No scans were taken but this task was
completed in the scanner because we wanted to measure the psychophysical abilities of participants in the same environment as that in which they would
do the main task. Eight levels of coherence were used in this task
(“coherence” refers to the percent of dots that move coherently in a given direction). These coherences were selected as representative of the full range of psychophysical abilities in preliminary testing and were 0, 5, 10, 15, 20, 40, 70, and 100%. In the practice task, coherence was 100% in all trials and so each small white dot was shown on a given video frame, and then shown three frames later, either displaced to the left or right. However, in this psychophysical measurement task, on each trial a given percent of the dots did this (depending on the coherence), and the rest reappeared after three frames in totally random positions. Participants were asked to indicate, using the left-hand and right-hand response pad buttons respectively, whether overall the dots appeared to be moving in a leftward or rightward global direction. The sequence of events and the timing in this task were the same as in the practice task except that no feedback was provided. Overall, each participant completed 160 trials. There were 20 trials of each coherence for each of which half of dots moved in a leftwards and half of dots moved in a rightwards global direction. This took 12 minutes. The results of this
experiment were used to determine each individual's “high coherence” (90% accuracy threshold) and “low coherence” (65% accuracy threshold). On average, participants were found to respond with 90% accuracy when dots moved with a coherence of 20% (± 15%) and so this was the average high coherence. On average they were found to respond with 65% accuracy when dots moved with a coherence of 7% (± 6%) and so this was the average low coherence.
Figure 1.
Figure 1. The sequence of events in each trial on the psychophysical testing task from experiment one. After initial presentation of a red fixation point for 1 second, a cloud of moving dots was presented for 0.5 seconds. This cloud then disappeared leaving the fixation point on screen for another 2 seconds. Finally a blank black screen was presented for 1 second as an inter-trial interval. Participants’ task was to indicate whether the cloud of dots had a leftwards or rightwards global motion direction. They could respond any time from the onset of dot motion until the fixation point disappeared.
Training task I
In this task participants again completed a random dot motion
discrimination task in the scanner but without being scanned (Figure 2 with 1s ITI). Coherence was 100%. The aim of this and the second training task was to help participants to understand that one direction of global dot motion was associated with delivery of the reward liquid and the other with delivery of the non-reward liquid. Importantly, which liquid they were given depended on the actual global dot motion direction, not on the participant's response. For half of the participants reward was associated with leftward global dot motion and for the other half of participants reward was associated with rightward global dot motion. In this task, there were 80 trials, which took a total of 12 minutes to complete. The same sequence of events as in the previous tasks occurred except that the response window was 4 seconds long; subsequent to this response window the participants were provided with either juice or ion water that took 2 seconds to be delivered via polythene tubes which were hooked up to a Multi-Phaser syringe pump system (New Era Pump Systems Inc.); and finally the fixation dot changed size and color for 0.5 seconds to indicate that the liquid could then be swallowed. Importantly, participants were told not to swallow the liquid until this cue appeared. As in the above tasks, a 1 second inter-trial interval (ITI) was inserted between all trials.
Figure 2.
Figure 2. The sequence of events in each trial on the training and main tasks of experiment one. After initial presentation of a red fixation point for 1 second, a cloud of moving dots was presented for 0.5 seconds. This cloud then disappeared leaving the fixation point on screen for another 4 seconds. This was followed by delivery of juice or neutral tasting ion water which participants had to wait 2 seconds before swallowing. A change in size and color of the fixation point indicated when they could swallow. Finally, a blank screen was presented for 1 second in the training task/a variable length of time in the main task. Participants’ task was to indicate whether the cloud of dots had a leftwards or rightwards global motion direction. They could respond any time from the onset of the dot motion until liquid was delivered.
Training task II
This was identical to the first training task except that it was completed on the second day (before the participant did the main task) while participants’ T1 scans were taken. In total, the proportion of correct responses across the two training tasks was 0.998 (± 0.002) in trials where dots moved in the reward associated direction and 0.994 (± 0.004) in trials where dots moved in the non-reward associated direction. This shows that participants understood the task and could respond very well when coherence was 100%.
Main Experiment
The design of this task (Figure 2 with variable ITI) was similar to that of the training task except that (a) the dots moved with the high and low
coherences determined for each participant individually in the psychophysical testing task, and (b) the ITI was of a variable length (0-23s, median = 3s, determined using Optseq2 (Greve, 2002)). In order to obtain enough error trials for a decent statistical analysis, an uneven number of high and low coherence trials were used. We planned for each participant to perform 10 sessions, each of which consisted of 32 trials and took 6 min in total (including ITIs). If there were 250 high coherence trials, and 70 low coherence trials completed across these 10 sessions, then because the high coherence was set at each individual’s 90% accuracy threshold and the low coherence was set at each individual's 65% accuracy threshold, we expected participants to make around 25 error trials in total for each coherence condition. The ratio of high coherence to low coherence trials was therefore set to 78:22 accordingly. Due to fatigue and time limitations, some participants completed less than 10 sessions: 3 participants completed 9 sessions, 2 participants completed 8
sessions, and 2 participants completed 7 sessions. The data from these participants was still kept in our analyses because they all made over 2 errors in each of the 4 (reward/non-reward high/low coherence) conditions.
Imaging data acquisition
A Siemens Trio TIM 3T scanner with a 32-channel head coil was used for scanning acquisition. Anatomical images were acquired using a T1-weighted MP-RAGE protocol (TR = 2000 ms, TE = 1.98 ms, FA = 10°, FOV = 256 mm × 256 mm, resolution 1 × 1 × 1 mm3
). Subsequently, T2*-weighted images reflecting blood oxygen level-dependent (BOLD) signals were acquired using gradient-echo echo-planar imaging (EPI) (TR = 2000 ms, TE = 25 ms, 38 slices, FA = 90°, FOV = 192 mm × 192 mm, and resolution = 3.0 × 3.0 × 3.5 mm3). Functional data were collected over a series of sessions, each of which took 360 seconds and consisted of 182 volumes. The first two volumes taken in each session were discarded to ensure steady-state magnetization.
Behavioral data analyses
Classical cognitive and behavioral experiments consider a person to be accurate if they correctly detect the presence of a signal (a ‘hit’), and to be inaccurate if they do not correctly identify the presence of a signal (a ‘miss’). However, the measure of accuracy does not account for the fact that people are also accurate if they correctly identify the absence of a signal (a ‘correct rejection’), and that they are also inaccurate if they say a signal is present when it is not (a ‘false alarm’). This means that whether a person's
performance reflects sensitivity (the ability to discriminate between signal present and signal absent trials) or bias (the increased likelihood to select one response over the other) cannot be determined from traditional measures
alone. Application of Signal Detection Theory (SDT; Green & Swets, 1966) to data is useful because it considers ‘false alarms’ as well as ‘hits’, and
therefore is informative about what type of errors (and correct responses) are made, and therefore what kinds of decision making strategies participants are using. We therefore conducted a SDT analysis to estimate participants’
sensitivity and their bias.
In this analysis, a ‘hit’ (H) was considered a trial in which participants correctly responded that dots moved in the reward associated direction. A ‘false alarm’ (F) was considered a trial in which participants responded incorrectly that the dots moved in the reward associated direction. The parameter d’ was calculated to estimate sensitivity, and the parameter c was calculated to estimate bias.
d' = z(H) − z(F) (1)
c = −0.5*(z(H) + z(F)) (2)
Imaging data analyses
SPM8 (Wellcome Trust Centre for Neuroimaging, University College London) was used to pre-process and analyze the imaging data. Standard pre-processing steps were completed in the following order: realignment, slice-timing correction, normalization to the EPI template (voxel-size re-sampled to 2 × 2 × 2 mm3
) and spatial smoothing using a Gaussian filter (FWHM = 8 mm). A high-pass filter of 128s was used to remove low-frequency noise.
Regressors of interest from different time points were found to have low orthogonality when they were all included in the same general linear model. Therefore, because we wished to analyze the brain activation from the dot
motion period, at response time, and from the outcome period, we performed three separate general linear model analyses looking at the regressors of interest at each of these times separately.
Our first whole-brain analysis model (EXPT1-GLM1) was a factorial design for brain activity that occurred during dot motion presentation time split by coherence (high/low), stimulus (reward/non-reward predictive), and
accuracy (correct/error). This gave us the eight conditions in total. For each subject, the general linear model (GLM) was used to fit the fMRI time series. Each condition was modeled from the onset of dot motion until the offset of dot motion, 500 ms in total. In addition, six other trial-related regressors were included: left/right response (duration = 0 s), juice/ion water delivery (duration = 2s), and swallowing of juice/ion water (from swallow cue onset for 0 s).
Our second whole-brain analysis model (EXPT1-GLM2) was a factorial design for brain activity that occurred at response time split by coherence (high/low), stimulus (reward/non-reward predictive), and accuracy
(correct/error). While these may appear the same as the eight regressors of interest in the EXPT1-GLM1 analysis, the current regressors occurred at the time that the participants made their response, which on average was 0.9 seconds (s.d. = 0.28, range = 0.2-4.5s) after the dot motion stimuli first
appeared, and therefore on average 0.4s after these stimuli disappeared. This range of response times made a jittering effect on the analysis, which
suggests that observed activation in EXPT1-GLM2 reflects different neural processes from that in EXPT1-GLM1. Each condition was modeled at the onset of response as an event (duration = 0 s). Six other trial-related regressors were also included: left/right dot motion (duration = 500 ms),
juice/ion water delivery (duration = 2s), and swallowing of juice/ion water (duration = 0 s).
For our third whole-brain analysis model (EXPT1-GLM3), a factorial design for brain activity that occurred at outcome time was completed and activity was divided by coherence (high/low), stimulus (reward/non-reward), and accuracy (correct/error). While these may appear the same as the regressors in the GLMs above, it is important to note that these regressors involved brain activations from a completely different time in the experiment. Each condition was modeled from the onset of liquid delivery until the offset of liquid delivery (i.e. duration = 2s). Two other trial-related regressors were included: dot motion leftwards and dot motion rightwards; these were modeled as starting at dot motion onset and lasting 500 ms until dot motion offset.
For all GLMs, random effect analyses at the group-level were conducted using an ANOVA design (Friston et al., 2002) that modeled the eight
conditions of interest and the main effect of subjects. Significant clusters were identified using the voxel-level threshold of p-unc. = 0.001. The statistic
threshold at cluster-level was set to p-FWE = 0.05. The six motion regressors were included as effects of no interest.
Experiment One Results Behavioral Results
We examined the effects of coherence (high/low) and stimulus (reward/ non-reward predictive) on response accuracy and found that participants performed significantly better in high coherence trials (0.82 ± 0.15) than in low coherence trials (0.60 ± 0.15; F(1,17)=47.1, P<0.001; Figure 3a). Likewise,
their sensitivity in high coherence trials (d’ = 2.27 ± 1.19) was better than that in low coherence trials (d’ = 0.63 ± 0.52; t(17)=6.15, P<0.001, Figure 3b). However, sensitivity on low coherence trials was still better than chance (t(17)=5.15, P<0.001). An effect of stimulus (reward/non-reward predictive) was also found on accuracy. On average participants responded more accurately in trials with reward predictive stimuli (0.76 ± 0.15) than in trials with non-reward predictive stimuli (0.65 ± 0.16; F(1,17)=5.85, P<0.05, Figure 3a). This finding can likely be explained by response bias (c). The response bias across the experiment significantly differed from 0 in low coherence trials (one-sample t-test, t(17)=−2.40, P<0.05; Figure 3c), and approached
significantly differing from 0 in high coherence trials (one-sample t-test, t(17)=−2.03, P=0.058; Figure 3c). On average it was -0.17 (± 0.35) in high coherence trials and -0.22 (± 0.39) in low coherence trials. Due to the way that we calculated c, any negative c reflects a bias for the response
associated with reward predictive stimuli. Therefore because the average c for both high and low coherence conditions were negative, this shows that on average our participants had a bias for the response associated with reward predictive stimuli, and therefore that they tended to choose this response more than the other response. This may therefore explain why participants were correct more often on trials where stimuli were reward predictive. The level of bias did not differ significantly depending on coherence (t(17)=0.85, P=0.41).
Figure 3.
Figure 3. The accuracy and SDT results of the main task of experiment one. Asterisks indicate statistically significant differences. a. Accuracy: There were main effects of stimulus (reward/non-reward predictive) and coherence (high/low) on participants’ dot motion direction discrimination performance. b. SDT Sensitivity: This (d’) was significantly higher in high than in low
coherence trials, and significantly greater than chance in low coherence trials. c. SDT Bias (c): On average, in both high and low coherence conditions, participants had a bias to select the response associated with reward
predictive stimuli. Bias was significantly greater than chance in low coherence conditions and approached a significant difference from chance in high
A coherence (high/low) by accuracy (correct/error) interaction was found when response times were investigated (F(1,17)=9.04, P<0.01). Post hoc t-tests showed that response times in high coherence correct trials (0.75s ± 0.18s) were faster than those in low coherence correct trials (0.88s ± 0.28s; t(17)=−3.75, P<0.01, Bonferroni corrected, Figure 4) and faster than those in high coherence error trials (1.01s ± 0.52s; t(17)= −3.19, P<0.01, Bonferroni corrected, Figure 4). Because participants were thereby shown to be fastest in high coherence correct trials, we wished to see if this was the same for both trials with reward and non-reward predictive stimuli. A paired sample t-test revealed that participants were significantly faster to respond in high
coherence correct trials with reward predictive stimuli (0.73s ± 0.18s) than in high coherence correct trials with non-reward predictive stimuli (0.78s ± 0.18s; t(17)= −3.07, P<0.01, Bonferroni corrected). This finding means that when participants could identify the stimulus (high coherence correct trials), their speed in response discriminated between reward and non-reward conditions. This finding therefore provides evidence that participants had learned that stimuli with one direction of dot motion were associated with reward and that stimuli with the other direction were associated with non-reward
Figure 4.
Figure 4. The response times of the main task of experiment one.
Participants were faster to respond in correct high coherence trials than in any other trials. Responses were faster in correct high coherence trials with stimuli predictive of reward than in correct high coherence trials with stimuli predictive of non-reward. R = reward trials, NR = non-reward trials. Asterisks indicate statistically significant differences.
When we investigated the relationship between response times and the SDT measures of response bias and sensitivity, we found that the greater a person’s bias for the response associated with reward predictive stimuli was on high coherence trials, the faster they erroneously responded on high coherence reward trials, (n=18, r=0.59, P =0.01). Similarly, the greater a person’s bias for the response associated with reward predictive stimuli was on low coherence trials, the faster they erroneously responded on low
coherence reward trials, (n=18, r=0.54, P <0.05) and the faster they correctly responded on low coherence reward trials (n=18, r=0.56, P <0.05). No other correlations reached significance.
fMRI Results
Dot Motion Duration BOLD Contrasts: EXPT1-GLM1
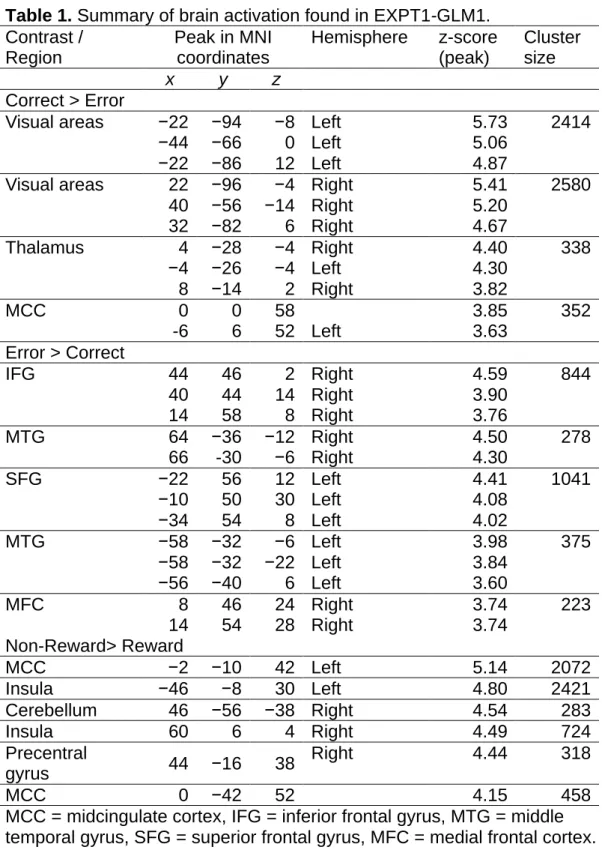
We investigated brain activation that occurred during the 0.5 second time period in which dot motion stimuli were displayed (Table 1, Figure 5).
Significantly increased activity in trials where participants subsequently made a correct compared to an erroneous response (correct > error) was seen in visual areas, including the putative middle temporal area (MT), which is associated with visual motion perception (Krug, Cicmil, Parker, & Cumming, 2013). Significantly increased activity in trials where participants subsequently made an erroneous compared to a correct response (error > correct) was seen in the bilateral inferior frontal gyrus (IFG) and medial frontal cortex (MFC; including a cluster from the ACC). None of these activities were found to differ depending on whether stimuli were reward or non-reward predictive. Finally, significantly increased activity in the midcingulate cortex (MCC), insula, cerebellum, precentral gyrus was found in trials with non-reward
compared to reward predictive stimuli (non-reward > reward). None of these activities were found to differ depending on whether the subsequently made response would be correct or incorrect. No areas were found to have
significantly increased activity for reward compared to non-reward predictive stimuli (reward > non-reward).
Table 1. Summary of brain activation found in EXPT1-GLM1. Contrast / Region Peak in MNI coordinates Hemisphere z-score (peak) Cluster size x y z Correct > Error
Visual areas −22 −94 −8 Left 5.73 2414
−44 −66 0 Left 5.06
−22 −86 12 Left 4.87
Visual areas 22 −96 −4 Right 5.41 2580
40 −56 −14 Right 5.20 32 −82 6 Right 4.67 Thalamus 4 −28 −4 Right 4.40 338 −4 −26 −4 Left 4.30 8 −14 2 Right 3.82 MCC 0 0 58 3.85 352 -6 6 52 Left 3.63 Error > Correct IFG 44 46 2 Right 4.59 844 40 44 14 Right 3.90 14 58 8 Right 3.76 MTG 64 −36 −12 Right 4.50 278 66 -30 −6 Right 4.30 SFG −22 56 12 Left 4.41 1041 −10 50 30 Left 4.08 −34 54 8 Left 4.02 MTG −58 −32 −6 Left 3.98 375 −58 −32 −22 Left 3.84 −56 −40 6 Left 3.60 MFC 8 46 24 Right 3.74 223 14 54 28 Right 3.74 Non-Reward> Reward MCC −2 −10 42 Left 5.14 2072 Insula −46 −8 30 Left 4.80 2421 Cerebellum 46 −56 −38 Right 4.54 283 Insula 60 6 4 Right 4.49 724 Precentral gyrus 44 −16 38 Right 4.44 318 MCC 0 −42 52 4.15 458
MCC = midcingulate cortex, IFG = inferior frontal gyrus, MTG = middle temporal gyrus, SFG = superior frontal gyrus, MFC = medial frontal cortex.
Figure 5.
Figure 5. The results of EXPT1-GLM1, i.e. activity during the dot motion period, are shown rendered on the template of SPM with P <0.001, uncorrected. The correct > error contrast revealed significant activation in the visual cortex including the MT. The error > correct contrast revealed
Response Time BOLD Contrasts: EXPT1-GLM2
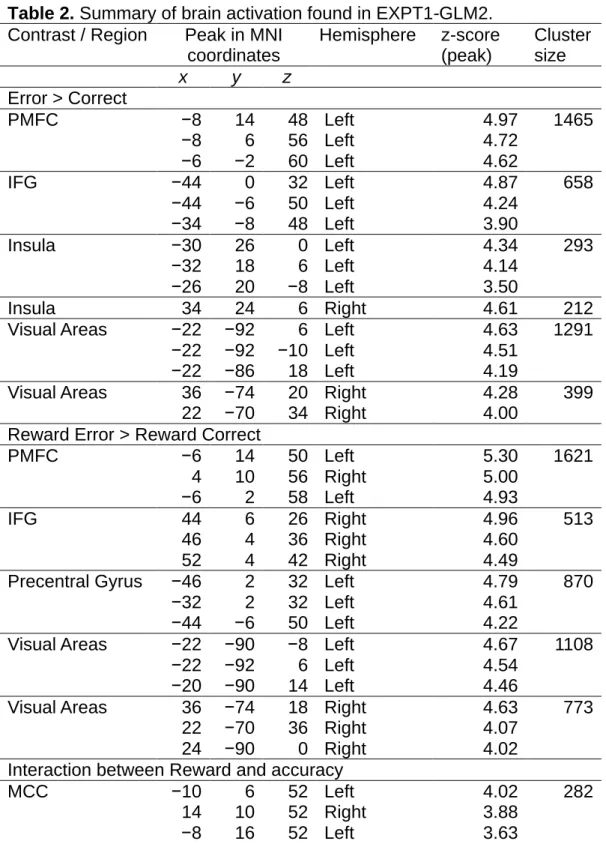
We next examined neural activation that occurred at the time participants made a response (Table 2, Figure 6). Note that at this time participants had already committed to a decision but had not yet received feedback about its accuracy. Activations for erroneous responses (error > correct) were found in the left posterior medial frontal cortex (PMFC), the left IFG, the bilateral insula, and an array of bilateral visual areas. We split these trials by stimulus type (reward/non-reward predictive). When we re-did the same contrast exclusively using trials with reward predictive stimuli (reward error > correct) we found that activity in the bilateral PMFC, the right IFG, the left precentral gryus, and an array of bilateral visual areas was significantly increased at this time. Doing the same contrast exclusively using trials with non-reward
predictive stimuli (non-reward error > correct) revealed no significant activity. Therefore, the error-related activity we found was much more broadly and significantly active in reward compared to non-reward trials. No areas were more active at this time in correct compared to erroneous responses.
Table 2. Summary of brain activation found in EXPT1-GLM2. Contrast / Region Peak in MNI
coordinates Hemisphere z-score (peak) Cluster size x y z Error > Correct PMFC −8 14 48 Left 4.97 1465 −8 6 56 Left 4.72 −6 −2 60 Left 4.62 IFG −44 0 32 Left 4.87 658 −44 −6 50 Left 4.24 −34 −8 48 Left 3.90 Insula −30 26 0 Left 4.34 293 −32 18 6 Left 4.14 −26 20 −8 Left 3.50 Insula 34 24 6 Right 4.61 212
Visual Areas −22 −92 6 Left 4.63 1291
−22 −92 −10 Left 4.51
−22 −86 18 Left 4.19
Visual Areas 36 −74 20 Right 4.28 399
22 −70 34 Right 4.00
Reward Error > Reward Correct
PMFC −6 14 50 Left 5.30 1621 4 10 56 Right 5.00 −6 2 58 Left 4.93 IFG 44 6 26 Right 4.96 513 46 4 36 Right 4.60 52 4 42 Right 4.49
Precentral Gyrus −46 2 32 Left 4.79 870
−32 2 32 Left 4.61
−44 −6 50 Left 4.22
Visual Areas −22 −90 −8 Left 4.67 1108
−22 −92 6 Left 4.54
−20 −90 14 Left 4.46
Visual Areas 36 −74 18 Right 4.63 773
22 −70 36 Right 4.07
24 −90 0 Right 4.02
Interaction between Reward and accuracy
MCC −10 6 52 Left 4.02 282
14 10 52 Right 3.88
−8 16 52 Left 3.63
PMFC = posterior medial frontal cortex, IFG = inferior frontal gyrus, MOG = middle occipital gyrus, MCC = midcingulate cortex.
Figure 6.
Figure 6. The results of EXPT1-GLM2, i.e. activity at the time of response, are shown rendered on the template of SPM with P <0.001,
uncorrected. The error > correct contrast revealed significant activation in the PMFC, IFG, bilateral insula, and visual areas. Activity in these same areas was more significant and broad in reward trials (reward error > correct; blue) than in non-reward trials (non-reward error > correct; red).
Interestingly, part of the PMFC, specifically part of the bilateral MCC, survived an interaction between accuracy (correct/error) and stimulus (reward/non-reward predictive). This area had increased activity for error compared to correct responses in reward compared to in non-reward trials (Table 2, Figure 7).
Figure 7.
Figure 7. The results of an interaction found in the MCC in EXPT1-GLM2, i.e. during the response period, are shown rendered on the template of SPM with P <0.001, uncorrected. This interaction revealed increased error-related activity in reward compared to non-reward trials. Raw beta values from each condition are shown. H = high coherence, L = low coherence.
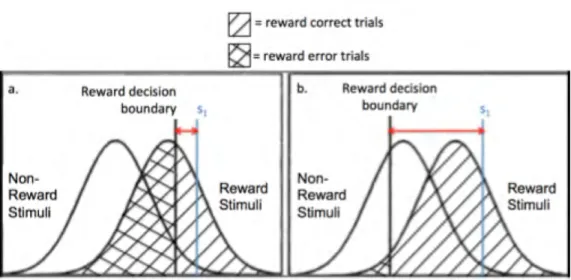
Because certain models predict that error-related neural activity should differ depending on decision boundaries (to be discussed in the general discussion), we analyzed averaged beta values from 4mm spheres around each of the three MCC peaks found in this interaction for each participant for each of the 8 conditions. We correlated the betas from high coherence conditions with participants’ response bias in the high coherence trials (calculated using SDT as reported in the above behavioral result section). Similarly, we correlated the betas from low coherence conditions with participants’ response bias for the low coherence trials. Betas in high coherence reward error trials from two of these spheres were found to correlate negatively with high coherence response bias (n=18, r = -0.483, P <0.05 for the sphere around the peak coordinates 14 10 53; n = 18, r = -0.514; P <0.05 for the sphere around the peak coordinates -8 16 52). Because in our analyses a negative c indicates a bias for the response associated with
reward predictive stimuli, this means that the more biased a participant was for the response associated with reward predictive stimuli, the more activity they had in their MCC during high coherence reward error trials. No other correlations were found to reach significance.
Outcome Time BOLD Contrasts: EXPT1-GLM3
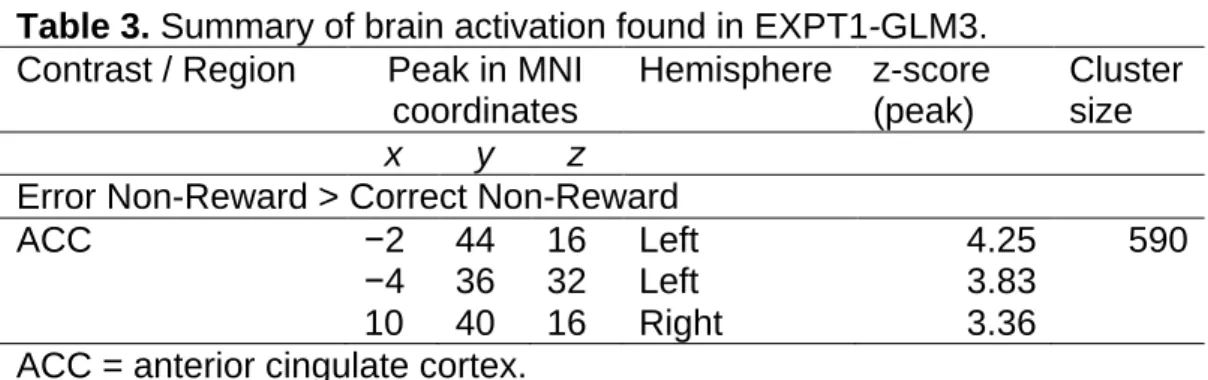
Brain activation that occurred when participants were presented with an outcome (reward/non-reward) was examined (Table 3). It is important to note that at this time, the outcome was dependent on the direction in which the dots had moved rather than on the accuracy of the participants’ response (e.g. if dots moved leftwards then you get the juice reward regardless of whether you correctly responded that they moved leftwards or incorrectly
responded that they moved rightwards). The outcome therefore informed participants of the correct dot motion direction in the current trial (e.g. if you receive juice then you know that the dots must have moved leftwards).
Participants could then use this information to determine if they had made the correct response or not. At this time, we did not find any overall effects of error. However, when we split these trials by stimulus type (reward/non-reward predictive) and looked only at trials with non-(reward/non-reward predictive stimuli (non-reward error > correct), we found significant error-related activation in part of the MFC, the ACC (Figure 8). No significant error-related activity was found at this time when we looked at trials with reward predictive stimuli (reward error > correct).
Table 3. Summary of brain activation found in EXPT1-GLM3. Contrast / Region Peak in MNI
coordinates Hemisphere z-score (peak) Cluster size x y z
Error Non-Reward > Correct Non-Reward
ACC −2 44 16 Left 4.25 590
−4 36 32 Left 3.83
10 40 16 Right 3.36
Figure 8.
Figure 8. The results of EXPT1-GLM3, i.e. activity at outcome time, rendered on the template of SPM. The ACC was found to be activated in an error > correct contrast using only non-reward trials. These results are shown rendered on the template of SPM with P <0.001, uncorrected.
Experiment One Discussion
In our first experiment we set out to determine if error-processing would differ after decisions were made to stimuli associated with different reward values. Therefore, we designed a task in which participants’ goal was to distinguish between reward and non-reward predictive stimuli after which they received the outcome (reward or non-reward) corresponding to the stimulus, regardless of whether they made the correct or incorrect response.
Behaviorally, despite the fact that its selection did not determine whether reward or non-reward would be delivered, participants were biased for the response associated with reward predictive stimuli. Because this means that participants selected the response associated with reward predictive stimuli more often overall, they were consequently more accurate in responding when stimuli were reward predictive rather than non-reward predictive. In addition, participants made correct responses faster to reward predictive compared to non-reward predictive stimuli. This effect was only significant for high coherence trials, which makes sense because information about the reward value associated with stimuli should have been more available in high than in low coherence trials. Overall, these results show that the reward value associated with stimuli can affect behavior. We next looked to see if the reward value associated with stimuli could also affect error-related neural processing at three different periods in time. At the time of stimulus
presentation, neural activity that was related to the subsequent accuracy of response was found but this did not differ dependent on the reward value associated with stimuli. In addition, neural activity that discriminated between reward and non-reward predictive stimuli was also found at this time (it was
greater in non-reward trials), but this did not differ depending on the
subsequent accuracy of response. Therefore, at stimulus presentation time neural activity that signaled the reward value associated with stimuli was not related to neural activity that signaled the subsequent accuracy of response.
These factors were found to interact, however, at a subsequent point in time where participants had committed to their decision and were therefore no longer able to change it, but had not yet received feedback about its accuracy. At this time error-related neural activity (defined as activity in error trials minus activity in correct trials) in the MCC was significantly greater in reward than in non-reward trials. This indicates that, as hypothesized, even when reward outcome is unrelated to the accuracy of decision response, the reward value associated with stimuli can enhance the neural processing of errors after a decision is made. Finally, in the third time period that we investigated, when participants received feedback that essentially informed them about the accuracy of their response, the only error-related neural activity found was in non-reward trials in the MFC.
The main finding of this experiment was the interaction between stimulus (reward/non-reward predictive) and accuracy (correct/error) in the MCC at response time (Figure 7). This interaction showed that, even though response did not affect whether or not a reward would be obtained, error-processing in the MCC was significantly greater in trials where responses were made to reward predictive compared to non-reward predictive stimuli. In fact, when trials with non-reward predictive stimuli were examined alone error-processing was not significant at all at this time. This indicates that the reward value associated with stimuli can affect information processing after a decision has
been made. However, the reward we used in this experiment was a primary reward, and because primary and secondary rewards are often associated with processes in different areas of the brain (e.g. see Sescousse, et al., 2013) we have to be cautious and note that it remained undetermined whether or not this effect was generalizable to all types of reward.
Because the value of the outcome on each trial on this task was not related to response accuracy, this finding is problematic for the popular idea that error-processing occurs specifically when the learning of
response-outcome associations is useful for obtainment of future reward (e.g. Holroyd & Coles, 2002). Instead, because error-processing at response time (after committing to a decision but before receiving feedback about its accuracy) is thought to occur as a result of continued monitoring of evidence after a decision is made (for an related theories see the general discussion and Yeung & Summerfield, 2012), our result perhaps indicates the reward value associated with stimuli can affect the degree to which decision evidence continues to be monitored after a decision is made. If this explanation were true, then the brain would need to be able to distinguish between reward and non-reward predictive stimuli prior to this. Consistent with this idea, activity prior to response (at stimulus presentation time) was found to be different for reward and non-reward conditions. While this activity did not differ according to subsequent accuracy, and therefore was likely not processed explicitly enough to be used to make the correct response, it may have provided
enough information for the brain to determine whether or not, or how much, to continue evidence monitoring after making a decision response.
In further support of the idea that reward enhances error-processing at response time, we found activity in a variety of other regions of the brain (including the bilateral insula, IFG, and posterior medial prefrontal cortex) to be somewhat differentially activated after erroneous responses in reward compared to non-reward trials. These areas are often found to be active after errors (e.g. Garavan et al., 2002; Klein et al., 2007; Menon et al., 2001). In our study, an error > correct contrast conducted on activity exclusively from
reward trials showed these areas to be broadly and significantly active. In contrast, a similar error > correct contrast conducted on activity exclusively from non-reward trials did not show any significantly active areas at all (although the same areas must have been a little active in non-reward trials, albeit non-significantly, or else they would have survived the interaction, and this can be seen in Figure 6 where the p-value is reduced to <0.001
uncorrected). This result therefore indicates that overall error-processing may be stronger in conditions with reward predictive stimuli (Figure 6).
In our first experiment, because outcome was associated with dot motion direction (e.g. left = juice, right = ion water), when participants received the outcome of the current trial they should have been able to infer the direction in which dots had moved (e.g. “I got juice so the dots must have moved left”). Based on this they should have been able to infer the accuracy of their response (e.g. “I got juice so the dots must have moved left but I responded that they moved right so I was wrong”). In this way the outcome of each trial was informative about response accuracy. One explanation for our finding of ACC activity in non-reward trials at feedback time is that the brain simply did not recognize that an error had been made in these trials until this point. In
reward trials, perhaps due to better continuation of evidence accumulation, error had already been signaled at response time. On the contrary, on non-reward trials error was not signaled (significantly) at response time and so when feedback effectively informed participants that their response had been erroneous, the generic error processing system proposed to exist in the cingulate (Holroyd & Coles, 2002) may finally have then received the evidence it needed to process these errors properly.
Our result that increased activity was found in the MFC (including the part of the ACC) and IFG prior to erroneous compared to correct response is interesting because it is the first time, to our knowledge, that such activity has been reported. A popular theory claims that activity in the ACC might be used in difficult situations for the recruitment of cognitive control to improve
response accuracy (e.g. Hoffman & Beste, 2015; Shenhav, Botvinick, & Cohen, 2013). Problematic for this, we found this activity, on average to occur prior to errors compared to prior to correct responses. Nevertheless, because this was not our goal we did not directly test this and so cannot rule out the possibility that this activity might have occurred and lead to correct response in a small amount of correct trials. Therefore further studies are required to determine the function of the activity we found to precede erroneous
responses in this experiment.
Overall, the results of our first experiment showed that error-related activities in the MCC and (to a lesser extent) in an array of other classic error regions were enhanced at response time by reward value. This was found even though the reward value of outcome in our task was simply related to the provided stimuli rather than to the accuracy of response. In situations of
non-reward, error-related processing did not significantly occur until feedback that an error has been made was effectively provided. These results therefore indicate that whether error is processed at response time, or not until external source provides evidence that an error was made, may depend on the value associated with the stimuli to which the erroneous response was made.
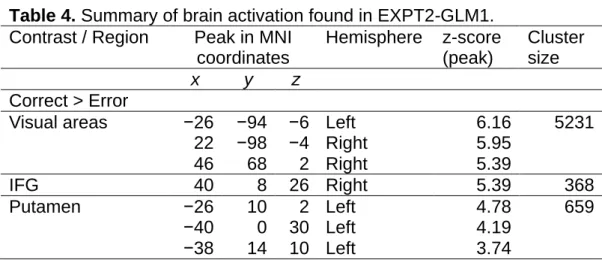
Experiment Two Introduction
In our first experiment we found that error-processing at response time (prior to feedback) particularly in the MCC, was enhanced in conditions with reward predictive stimuli. Because the reward used in experiment one was a primary reward we wished to test whether or not the same result could be found with a secondary reward. In addition to this, because the processing of response accuracy has been proposed to reflect confidence and uncertainty (see Yeung & Summerfield, 2012), we wished to see if the results found in experiment one were related to these. We therefore conducted a follow-up experiment.
The “common currency" hypothesis is the proposal that all types of reward are converted to a common currency and then similarly processed in the brain (Levy and Glimcher, 2012; Montague & Berns, 2002; Sugrue,
Corrado, & Newsome, 2005). However, secondary rewards only acquire value after they have been associated with primary rewards (see Knutson &
Bossaerts, 2007). For example money, a secondary reward, may acquire value after one learns that they can use it to buy food, a primary reward. Therefore, because this suggests that the processing of secondary rewards may be more convoluted than the processing of primary reward, it suggests
that the neural regions which process them might differ somewhat. Consistent with this, a recent activation likelihood estimate meta-analysis investigating 33 neuroimaging studies on reward showed that while some areas were indeed commonly activated for both primary and secondary rewards (including the ventromedial prefrontal cortex and striatum), other areas were more activated for certain types of rewards (e.g. the orbitofrontal cortex for secondary reward; Sescousse, et al., 2013). This paper did not discuss whether or not primary and secondary rewards are processed in the cingulate. Therefore, whether or not the results our first experiment are generic to all types of reward remained questionable and thus did the scope of our finding. To test the generalizability of this effect, we conducted another similar experiment where a secondary reward (money) was associated with stimuli.
If we are able to replicate the effect found in experiment one using a secondary reward, then we would have the chance to further probe the mechanisms underlying this effect. In experiment one, we measured and compared neural activity that occurred after correct and erroneous responses. This type of binary analysis was enough to show that processing in erroneous compared to correct responses was greater when stimuli were associated with reward than non-reward. However, some studies have suggested that rather than processing actual error per se, this type of cingulate activity instead depends on some other process that occurs more often in erroneous than in correct responses (Scheffers & Coles, 2000; Vidal, Hasbroucq, Grapperon, & Bonnet, 2000).
One likely candidate for a process that occurs more often in erroneous than in correct trials is decision uncertainty (Yeung & Summerfield, 2012). This is
often defined as one’s perceived likelihood of having made an erroneous decision (rather than their actual processing of an error), and has been considered the opposite of decision confidence, which is the perceived likelihood of having made the correct decision (e.g. Kepecs, et al., 2008; Kepecs & Mainen, 2012). For simplicity, in this paper we shall adhere to these definitions. There is some support for the idea that post-error processes that occur in the cingulate cortex might reflect decision confidence/uncertainty rather than just the processing of error. For example, several studies have had participants self-report their perceived confidence in their decisions and found that event related potentials (thought to be sourced in the cingulate) which were originally thought to signify error-processing, actually differed in a graded fashion as decision confidence decreased, i.e. as decision uncertainty increased (Boldt & Yeung, 2015; Scheffers & Coles, 2000). Importantly, when participants reported feelings of uncertainty, this activity has been found to occur even in correct trials in which error-processing, by nature, should be impossible (Boldt & Yeung, 2015; Scheffers & Coles, 2000). Therefore, many findings of the error-processing literature might be better explained as
reflecting decision uncertainty (Yeung & Summerfield, 2012). If the results that we found in the MCC in experiment one reflect the processing of uncertainty rather than simply the processing of error, then if we get participants to self-report decision confidence, this MCC activity should correlate negatively with these. Furthermore, this correlation should withstand even in correct trials.
Overall, in experiment two we wished to further study the effect found in experiment one. Therefore, we had participants complete a similar task to that in experiment one but with two changes. First, instead of receiving a primary
reward (juice) participants received a secondary reward (money) on trials with reward predictive stimuli. Second, after making a dot-motion direction
response, and prior to receiving outcome, participants had to explicitly rate the level of confidence they had that their dot-motion direction response was accurate. The major goals of this experiment were to see if the effect found in experiment one occurs when secondary rather than primary rewards are used, and to see if the neural processing of error in the MCC was related to continuous self-reports of decision confidence/uncertainty.
Experiment Two Materials and Methods Ethics Statement
All participants were informed about the requirements of this study and completed written consent forms prior to initiation of the experiment. This study was approved by the ethics committee of Brain Science Institute of Tamagawa University.
Participants
The data of twenty-four participants were included in this experiment. These participants were all psychologically and neurologically healthy, right-handed, undergraduate students (12 female, 12 male, mean age 20.5 ± 1.3 years) with normal or corrected-to-normal vision. Data of seven of other participants were excluded from analyses due to excessive motion or low error rates. Participants were paid a baseline of ¥6000 yen for a two-hour session. This payment could be increased up to ¥7500 yen depending on the participant’s performance.
Presentation of visual stimuli was controlled using the “psychophysics toolbox” (Brainard, 1997) running on Matlab 7.1 (Mathworks, Inc.). These stimuli were projected to an opaque screen inside the scanner via a mirror system and a (CP-SX1350, HITACHI; frame rate = 60 Hz) projector. MRI compatible response pads (HHSC-2x2, Current Designs, Inc., PA, USA) were used by participants to respond to stimuli.
Experimental Procedure Practice Task
After watching a video about MRI and receiving instructions about the experiment, participants completed 20 practice trials out of the scanner. The sequence of events in this task was similar to that in the main task of
experiment one. For the first 1 second a black screen with a red fixation point in the center was presented. Then for 0.5 seconds a cloud of small white dots appeared around this fixation point. These dots had the same parameters as those in experiment one and they similarly had a global motion direction of left or right. In this practice task dots moved with a coherence of 100% on every trial. After these dots disappeared, the red fixation point was left on the black screen for a further 4 seconds. Participants’ task was to indicate whether they thought the dots were moving to the right or to the left by pressing a button under their index finger on the response pad in their corresponding hand. They were able to respond at any time in the 4.5 second response period from the onset of the small white dots until the offset of the fixation point. When they pressed a button, the fixation point changed color to a darker red to indicate that the response had been registered. Unlike in experiment one, in all tasks in experiment two a white likert scale appeared on the black
screen after the response period. The numbers 1-7 were shown beneath the points on the scale from left to right. Participants had been instructed to select the number corresponding to the level of confidence that they had in their response about dot motion direction. They were told that 1 represented “absolutely no confidence, I chose a direction at random” (1は全く自信がな くて当てずっぽうの場合), that 4 represented “moderately confident in my response” (4はまあまあ自信がある場合), and that 7 represented complete confidence “I think I definitely chose the correct response” (7は絶対にあって いると思う場合). A white cursor randomly appeared above one of the
numbers and participants were able to move this cursor to their selected level of confidence. They pressed the button under their index finger in their left hand to move the cursor leftwards and the button under their index finger in their right hand to move the cursor rightwards. When they had reached the number that corresponded to their level of confidence, they could press any other button in either hand to select it. This screen only terminated after participants selected a confidence level. Subsequently, the outcome of that trial was presented in white letters on a black screen for two seconds (¥30 or ¥0). Outcome was determined by dot direction (left or right) rather than by the participant’s response (correct or erroneous) so that if dots moved in a given direction (counterbalanced between subjects) then participants were
rewarded (¥30) and if dots moved in the other direction then they received no reward (¥0). Finally, a black screen was presented for 1 second to provide an inter-trial interval. After completing these 20 practice trials, participants filled out a questionnaire about the experiment. It had questions to test their understanding of the task such as “what happens if the dots moved left but
you mistakenly respond that they moved right?” Participants were only allowed to move on once they had answered all questions correctly and therefore shown that they had a good understanding of the experiment. Psychophysical measurement and training task:
This task (Figure 9 with 1s ITI) was completed in the scanner while participants’ T1 scan was taken. The events in this task were identical to those in the practice task except for that the coherence was not 100% on all trials but rather 20 trials of each of the following coherences were used: 0, 5, 10, 15, 20, 40, 70, or 100%, 160 trials in total. The results of this experiment were used to determine each individual's “low coherence” (65% accuracy threshold) and “high coherence” (90% accuracy threshold).
On average, participants were found to respond with 90% accuracy when dots moved with a coherence of 24% (± 13%) and so this was the average high coherence. On average they were found to respond with 65% accuracy when dots moved with a coherence of 8% (± 5%) and so this was the average low coherence.
Figure 9.
Figure 9. The sequence of events in each trial on the psychophysical testing and training task and on the main task from experiment two. After initial presentation of a red fixation point for 1 second, a cloud of moving dots was presented for 0.5 seconds. This cloud then disappeared leaving the fixation point on screen for another 4 seconds. Participants’ task was to indicate whether the cloud of dots had a leftwards or rightwards global motion direction. They could respond any time from the onset of the dot motion until the fixation point disappeared. After the fixation dot disappeared a white likert scale appeared on the black screen. Participants’ were told to then select the number corresponding to how much confidence they had that they had selected the correct dot motion direction (7 = most confident, 1 = least confident). Selection of a number terminated this screen after which the outcome of the current trial (¥30 or ¥0) was displayed in white letters on a black screen for 2 seconds. Finally a black screen was shown for 1 second as an inter-trial interval in the psychophysical testing and training task/for an amount of time that varied between trials on the main task.