Analysis Based on Gray Theory and Personality
Analysis
Shin-ichi Ito, Momoyo Ito, Katsuya Sato, Shoichiro Fujisawa and Minoru Fukumi
Institute of Technology and Science, The University of Tokushima, Tokushima, Japan
{s.ito, katsuyas, s-fuji}@eco.tokushima-u.ac.jp, {momoito, fukumi}@is.tokushima-u.ac.jp
Abstract- This paper introduces a method to classify the preference patterns of sounds on the basis of an electroencephalogram (EEG) analysis and a personality analysis. We analyze the EEG of the left prefrontal cortex by single-point sensing. For EEG recording, a dry-type sensor and few electrodes were used. The proposed feature extraction method employs gray relational grade detection on the frequency bands of EEG and egogram. The gray relational grade is used for extracting the EEG feature. The egogram is extracted for quantifying the
subject’s personality. The preference patterns generated
when the subject is hearing a sound are classified using the nearest neighbor method. To show the effectiveness of the proposed method, we conduct experiments using real EEG data. These results show that the accuracy rate of the preference classification using the proposed method is better than that using the method that does not to
consider the subject’s personality.
Keywords- electroencephalogram, individual difference, gray relational grade, nearest neighbor method, personality, egogram, preference.
I. INTRODUCTION
In this study, we attempt to investigate human character,
including a person’s feelings, personality, KANSEI, and
sensibility, as it is a well-known fact that human beings respond differently to exogenous stimuli depending on their character. The stimuli found unpleasant by a person are known as stressors, which are encountered on a daily basis, while the stimuli found pleasant have a positive effect on the
person’s behavior.
Ideally, one should routinely encounter stimuli for good mental health. Then, we can assume that the response to the stimuli depends on the person’s personality. Therefore, we can analyze his/her character by using an egogram because the egogram is similar to a psychological fingerprint; each person has a unique profile that can be seen and measured [1– 4]. Basically, the egogram is obtained by calculating the score of each ego state.
An electrocap with several electrodes is uncomfortable for human beings to wear, and thus unsuitable for longterm recordings of the use of a brain–computer interface (BCI) in day-to-day applications [5]. Therefore, we have attempted to construct a BCI by using a compact device with dry-type
electrodes. The target-sensing point is the left lobe, and a single electrode is used. Because the prefrontal cortex can be assumed to be the brain area [6,7], which is associated with humans, the electroencephalogram (EEG) activities in the prefrontal pole are variable. Further, it has been confirmed that an EEG of the frontal cortex activity is different for different people [8,9]. This difference is one of the factors that affects the variability. In particular, the difference is notable when the sensing position is the prefrontal cortex. However, the reasons for this difference are not clear. Therefore, in this paper, we propose a method to mitigate the adverse effects of this individual difference in EEG with single-point sensing by analyzing the EEG.
Numerous approaches exist for analyzing the EEG activity [10], such as the EEG features of power spectrum and spectral centroid, special EEG feature extraction techniques, principal component analysis [11,12], independent component analysis [12], factor analysis, EEG pattern classifiers, knearest neighbor (kNN) [10,13], linear discriminant analysis [14], neural networks [12], support vector machine [15], and self-organizing maps [16]. EEG pattern classification techniques have a learning function and are susceptible to the features of input vectors. Moreover, it is difficult to learn the input vectors when we consider the individual difference and noise elements. In this study, we employ an input modality to mitigate the individual difference. The EEG feature is computed using the relationships among degrees of the time series feature of the power spectra of each frequency band of EEG on the basis of the gray relational analysis [17]. The classifier employs kNN because kNN is one of the most popular nonparametric classifiers in practice. Considering the individual difference, we find that the input modality consists of the EEG feature vector and the human character vector that is based on the personality analysis. Furthermore, in a previous study, we confirmed that the left prefrontal cortex EEG activities exhibited the individual difference when the subject was listening to a sound [18]. However, we could not classify preference patterns. In this study, we classify the preference patterns obtained when a subject was listening to a sound by analyzing the prefrontal cortex EEG activities on the basis of the personality analysis.
Finally, to show the effectiveness of the proposed method, we conducted experiments using real EEG data.
Figure (1): International 10–20 system. Reference electrode is placed at the left ear lobe (A1), and exploring electrode is placed at the left prefrontal pole (Fp1).
II. PROPOSED METHODS
The proposed method consists of three phases: EEG recording, feature extraction, and preference classification. The feature vector is created by computing the gray relational grade of each frequency band of EEG. The personality is quantified by the egogram through a psychological questionnaire.
For EEG recording, we use the “MindTune (MT)” device,
which was developed by TOSHIBA in Japan, to measure the EEG activity. In general, EEG systems use an electrocap. However, an electro cap with several electrodes is uncomfortable for human beings to wear, and thus unsuitable for longterm recordings of the use of BCI in daily applications. Therefore, the preparation of EEG recording before a BCI operation takes a long time when the subject is wearing the electrocap. Further, the reduction in the number of electrodes in the BCI system is critical. The MT uses a dry-type sensor and few electrodes in the headphone. It does not require the subject to use a gel or water to wear the electrodes. Therefore, we believe that it can alleviate uncomfortable feelings and can be used under realistic conditions. This methodology is referential recording. The reference electrode is placed at the left ear and the exploring electrode is placed at Fp1 in the international 10–20 system, shown in Figure (1). The obtained EEG data are sent to the computer every second through a serial port. The power spectra of the EEG data per second are calculated using a fast Fourier transform (FFT). The FFT data cover the frequency bands, theta (4–7 Hz), low-alpha (8–9 Hz), high-alpha (10–12 Hz), and beta (13–30 Hz).
After EEG recording, the user completes an easy questionnaire for a preference evaluation of the sounds heard. In this paper, we define the preference patterns on the basis of the questionnaire results. The criterion of the questionnaire is as follows: does the subject like the sound (“LikeSound”),
dislike it (“DislikeSound”), or is neutral about it (“Other”)?
[18]. There are two preference patterns, LikeSound and DislikeSound. We eliminate the patterns classified as Other because the subjects found it difficult to specify the preference for these patterns.
The feature vector used for classifying the preference patterns is created by correlating the results of the EEG feature extraction and personality analysis. The EEG feature is extracted by computing the gray relational grade of each
frequency band of EEG. The subject’s personality is
quantified by using an egogram based on the psychological questionnaire.
In the EEG feature extraction, we consider the gray relational grade of the time variations of the power spectra of each EEG frequency band. LetX, x , and M be the matrices of the discrete time series data of the power spectra of the frequency bands of EEG, power spectra of each time period, and maximum time, respectively.
⋅⋅
⋅
⋅⋅
⋅
⋅⋅
⋅
⋅⋅
⋅
=
− − − − − −)
(
)
2
(
)
1
(
)
(
)
2
(
)
1
(
)
(
)
2
(
)
1
(
)
(
)
2
(
)
1
(
M
x
x
x
M
x
x
x
M
x
x
x
M
x
x
x
X
high high high low low low (1)Here, the gray relational coefficient (xi(k),xj(k))is defined as follows: . max . max . min
)
(
))
(
),
(
(
∆
+
∆
∆
+
∆
=
k
k
x
k
x
ij j i (2)where ∆ijindicate xi(k)−xj(k) . xi(k) and xj(k) denote the reference and comparison matrices, respectively. Both i and j refer to the frequency bands (,low−,high−, ) . Then ) ( ) ( . min . min . min xi k xj k k i j = − = ∆ ∀ ∈ ∀ , ) ( ) ( . max . max . max xi k xj k k i j = − = ∆ ∀ ∈ ∀ .
where represents the distinguishing coefficient (∈[0,1]). The gray relational grade matrix R is calculated using the gray relational coefficient as follows:
Γ Γ Γ Γ = 44 41 14 11 R (3) subject to Γ = ∑ = M k ij ij k M 1 ) ( 1
The gray relational grade is computed by calculating the eigenvector of greatest eigenvalue. We regard the gray relational grade as the EEG feature.
In the personality analysis, we employ the egogram to analyze the personality of a human being. The egogram, which depends on a transaction analysis, is regarded as a psychological fingerprint: each person has a unique profile that can be seen and measured. The egogram classifies ego states as critical parent, nurturing parent, adult, free child, and adopted child [1-4]. The egogram indicates the score of each
Table (1): Types of sounds heard. fire engine
siren wind bells sound helicopter noise cicada buzz grade crossing scotch tape roar of waves bush warbler
buzz Mosquito
fireworks soda water unwrapping the paper drill noise train noise frictional noise
of styrene foams
Table (2): Results of preference evaluation of sounds. Total indicates the total number of sounds for all and/or each subject. All and S1–S5 correspond to all subjects and subjects
1–5, respectively.
All S1 S2 S3 S4 S5
Sex - male male male male female
Like 44 9 13 8 0 14
Dislike 178 35 48 39 24 32
Other 153 31 14 28 51 29
Total 375 75 75 75 75 75
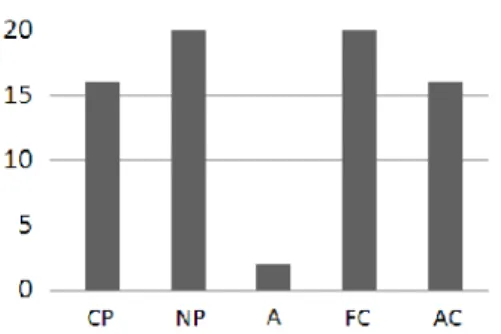
Figure (3): Time duration of experiments. Figure (2): Example of the egogram. The vertical axis
denotes the ego score. CP, NP, A, FC, and AC represent the critical parent, nurturing parent, adult, free child, and adopted child, respectively.
ego state and the total score. These scores are calculated on the basis of the results of psychological testing. To assess a
subject’s personality, we adopt the self-grow-up egogram [4],
which was developed by the Chukyo Psychosomatic Medicine Workshop. This is a brief questionnaire composed
of 50 items. The subject is asked to assign each item “○” for “yes,” “×” for “no,” or “△” for “unsure.” These states are
allotted 2, 0, or 1 point, respectively [4]. The 50 items on the questionnaire fall into the five ego states mentioned above. A diagram on the calculated score from the psychological questionnaire shows the ego states that dominate the subject’s personality or nature. Figure (2) shows an example of an egogram. We normalize each ego score by dividing the score by 20 because the maximum score of each ego state is 20.
In feature creation, to classify the preference patterns, we correlate the results of the gray relational grade and the normalized ego scores as follows:
[
p
p
lowp
highp
s
cps
nps
as
fcs
ac]
Feature
=
,
−,
−,
,
,
,
,
,
where Feature , p and s denote the feature vector, gray relational grade of the EEG features, and normalized score of each ego state, respectively.
In the preference pattern classification, we use the kNN for classifying the EEG patterns because it is one of the most popular nonparametric classifiers in practice.
When used in BCI systems with low-dimensional feature vectors, kNN proves to be efficient [10,13]. Assume L classes c1,c2,cL. The training sample set of the ith class is vi. The design set for the kNN classifier is iL=1vi. S denotes the total number of vectors in the design set. Vector
i
y (i=1,2,,S) denotes the ith vector in the design set. For an input vector, the kNN algorithm is used for finding the k closest vectors in the design set. Let ki (1≤i≤L) be the number of closest vectors from the ith class,
k k k
k1+ 2++ L= . The input vector’s class label is cI if =
I arg max ki. Then, the Euclidean metric is used as a distance measure. Moreover, the EEG datasets for learning
are chosen on the basis of the repeated random sub-sampling validation algorithm for all datasets. In the repeated random sub-sampling validation, 80% of the data are chosen randomly as the datasets for learning. The rest of the data (20%) are used for testing. Furthermore, the accuracy rate is computed on the basis of the EEG pattern classification.
r TotalNumbe er
CrrectNumb
Accuracy= / (4)
where the CorrectNumber denotes the total number of correct answers by checking LikeSound and DislikeSound, and TotalNumber denotes the total number of LikeSound and DislikeSound.
III. EXPERIMENTS
The subjects in this study comprised five persons: four males (average age: 22.5 years) and a female (age: 22 years). The experiment proceeded as follows. The EEG device was positioned on the forehead of each subject; the subject then sat on a chair, closed his/her eyes, and remained quiet. EEG was recorded more than once in the laboratory with environmental noise during the experiment. The time table of each EEG recoding was 15 s (no sound) and 15 s (hearing a sound) as a set, as shown in Figure (3). After EEG recording,
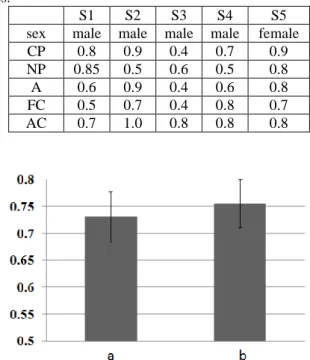
Table (3): Results of the normalized ego scores for each ego states.
S1 S2 S3 S4 S5
sex male male male male female
CP 0.8 0.9 0.4 0.7 0.9
NP 0.85 0.5 0.6 0.5 0.8
A 0.6 0.9 0.4 0.6 0.8
FC 0.5 0.7 0.4 0.8 0.7
AC 0.7 1.0 0.8 0.8 0.8
Figure (4): Mean and S.D. of preference classification accuracy (10,000 trails). (a) Comparative method and the feature vector is the gray relational grade only. (b) Proposed method.
he/she completed the easy questionnaire for the preference evaluation of sounds heard by checking LikeSound, DislikeSound, and Other. The experiments classified the patterns as LikeSound and DislikeSound by using the proposed method. for EEG feature extraction was 0.5. Then, L and S for preference pattern classification were 1 and 2, respectively. Tables (1) and (2) list the types of sounds heard and the results of the preference evaluation of the sounds, respectively. Table (3) and Figure (4) show the results of the egogram for each subject and the preference classification (10,000 trials), respectively.
IV. DISCUSSIONS
In Table (2), we confirmed that the number of subjective evaluations of the sounds heard through the questionnaire was different for each subject. These results indicated the response of the brain, impression, and taste with respect to the sounds. Although the almost listening to sounds may provide an uncomfortable feeling shown in Table (1), subject 4 did not choose LikeSound.
From Table (3), despite the egogram, we confirmed that each subject had different scores for each ego state.
From Figure (4), we confirmed that the accuracy rate of the preference classification using the proposed method was better than that using the comparative method (Figure (4a)) and that the feature vector did not consider the results of personality analysis. Moreover, the mean as well as S.D. of
the classification ratio were higher than 0.7 and lower than 0.04. Since the number of trials was 10,000, these results were stable. A common feature of the proposed method and the comparative method was the gray relational grade of the frequency bands of EEG. These results suggested that the prefrontal cortex EEG activities related to the difference in each preference could be extracted by computing the grade of the relation of the frequency bands and that the gray relational analysis proved useful in extracting the EEG feature. Furthermore, the improvement rate was highly reliable because the obtained results were stable. In other words, it was effective in that the feature vector included the results of personality analysis as the mitigating effects of the individual difference.
We believed that the important factor was the individual difference. Further, although the EEG analysis employed other techniques, in a previous study, we had confirmed that it was easy to detect the EEG pattern related to a negative feeling when the measurement position was the left prefrontal pole (Fp1) [19] and obtained sufficient results of the preference pattern classification. Thus, we had the opportunity of detecting the human response to negative stimuli for BCI when the sensing point was Fp1 by using an approach that considered the individual difference.
V. CONCLUSIONS
In this paper, we proposed a method to classify the preference patterns of sounds on the basis of an electroencephalogram (EEG) analysis and a personality analysis. The proposed method consists of three phases: EEG recording, feature extraction, and preference classification. The feature vector was created by correlating the results of EEG analysis and the personality analysis. We analyzed the EEG of the left prefrontal cortex by single-point sensing. For EEG recording, a dry-type sensor and few electrodes were used. The EEG analysis computed the gray relational grade of the discrete time series data of the power spectra of the frequency bands of EEG. The personality analysis quantified by the egogram on the basis of a psychological questionnaire. The preference patterns generated when a subject heard a sound were classified using the nearest neighbor method. To demonstrate the effectiveness of the proposed method, we conducted experiments using real EEG data. These results revealed that the accuracy rate of the preference classification using the proposed method was better than that using the
ACKNOWLEGMENT
This work was supported by MEXT KAKENHI Grant Number 24700210.
REFERENCES
[1] S. Shirai, How transactional analysis can be used in terminal care, International Congress Series 1287, pp.179-184, 2006.
[2] E. Berne, Transactional Analysis in Psychotherapy, Random House, New York, pp.38-43, 1961.
[3] J. M. Dusay, Egogram, Harper and Row Publishers, New York, xv, 1977.
[4] T. Katsura, M. Ashihara and M. Murakami, Manual of Self Grow-up Egogram, Team Iryo Ltd., 1999 (in Japanese).
[5] Y. Wang, X. Gao, B. Hong, C. Jia, and S. Gao, Brain-computer interfaces based on visual evoked potentials, Journal of IEEE engineering in medicine and biology magazine, vol. 27, issue 5, pp 64-71, 2008.
[6] R. J. Davison, Anterior cerebral asymmetry and the nature of emotion, Brain and Cognition, Vol.20, pp.125-151, 1995.
[7] R. J. Davison, Anterior electrophysiological asymmetries, emotion, and depression: Conceptual and methodological conundrums, Psychophysiology, Vol.35, pp.607-614, 1998.
[8] J. B. Allen, Issues and assumptions on the road from raw signals to metrics of frontal EEG asymmetry in emotion, Biological Psychology, 67, pp.183-218, 2004.
[9] J. A. Coan, J. B. Allen and P. E. Mcknight, A capability model of individual diferences in frontal EEG asymmentry, Biological Psychology, 72, pp. 198-207, 2006.
[10] F. Lotte, M. Congedo, F. Lecuyer and B. Arnaldi, A review of classification algorithms for EEG-based brain-computer interface, Journal of Neural Engineering, 4, R1-R13, 2007.
[11] H. Lee and S. Choi, PCA+HMM+SVM for EEG pattern classification, Proc. 7th Int. Symp. on Signal Processing and its Application, 2003.
[12] T. Hoya, G. Hori, H. Bakardjian, S. Nishimura, T. Suzuki, Y. Miyawaki, A. Funase and J. Cao, Classification of single trial EEG signals by a combined principal + independent component analysis and probabilistic neural network approach, Proc. ICA2003, pp.197-202, 2003.
[13] J. F. Borisoff, S. G. Mason, A. Bashashati and G. E. Birch, Brain-computer interface design for asynchronous control applications: improvements to the LF-ASD asynchronous brain switch, IEEE Trans. Biomed. Eng., 51, pp.985-992, 2004.
[14] B. Blankertz, G. Curio and K. R. Muller, Classifying single trial EEG: towards brain computer interfacing,
Adv. Neural Inf. Process. Syst., NIPS 01, vol. 14, pp.157-164, 2002.
[15] T. Felzer and B. Freisieben, Analyzing EEG signals using the probability estimating guarded neural classifier, IEEE Trans. Neural Syst. Rehabil. Eng., 11, pp.361-371, 2003.
[16] R. Khorsrowabadi, C. Q. Hiok, A. Watab and K. A. Kai, EEG-based Emotion Recognition Using Self-Organizing Map for Boundary Detection, Proceedings of ICPR, pp. 4242-4245, 2010.
[17] K.-L. Wen, Gray Systems: Modeling and Prediction, Alibris, Amazon, 2004.
[18] S. Ito, M. Hamaguchi, K. SATO, S. Fujisawa and M. Fukumi, Variability in EEG with Single Point Sensing as Inter-Individual Difference Measure Using Self-Organizing Map, Proceedings of 2011 International Symposium on Nonlinear Theory and its Applications, NOLTA2011, pp.290-293, 2011. [19] S. Ito, Y. Mitsukura, K. Sato, S. Fujisawa and M.
Fukumi, Association between Ego Scores and Individual Characteristics in EEG Analysis: Basic Study on Individual Brain Activity, Proceedings of 19th IEEE International Symposium on Robot and Human Interactive Communication (Ro-Man'10), pp. 230-235, 2010.