日本人の「夢」は変わってきたのか? -NHK日本人の意識調査(1973-2008)を手がかりに
18
0
0
全文
(2) 論 文:日本人の「夢」は変わってきたのか?. Joint Symposium” in 2016. As the title suggests, scholars from South Korea and Japan discussed and compared how people’s “dreams” in both countries have changed from various perspectives. As representatives of the Japan’s side, we discussed some characteristics of the changing value orientation of Japanese people. These characteristics, as we argue later in this paper, fit into the main theme of the symposium and seem to reflect how the “Japanese dream” has been changing and redefined in the last few decades. The contents of the presentation were further developed and refined, and this paper is the outcome of such attempt. Another reason for using the concept of “dream” in this paper is that, we believe, it has a slightly different meaning than the more commonly used concept “value”. In many academic studies, “value” is often used to refer to “the beliefs people have, especially about what is right and wrong and what is most important in life, that control their behavior” (Cambridge Dictionary). For example, ethical and moral values, such as the acceptability of suicide, homosexuality, and euthanasia, may differ from person to person according to family, religious, and cultural backgrounds. On the other hand, “dream” is usually regarded as a desire towards an ideal life which is shared collectively by a group of people, or in other words, an “aggregate” of people’s values orientations. Due to such delicate differences, “dream” in this paper is not considered as values hold by individuals; instead it is defined as an orientation towards a set of social norms and ideals, which is created or constructed in a particular socio-economic context and is widely shared by its people due to media and government facilitation and socialization. Before answering whether and how the “Japanese dream” is changing, the first and most important step is to give a working definition to it. Defining the “Japanese dream” is not an easy task and it may be helpful to look at how “dreams” are culturally defined and socially constructed in other societies. For instance, the “American dream” is highlighted throughout the American history of nation building. When talking about the “American dream”, one can easily refer to such ideas as democracy, rights, liberty, equality, and opportunity for prosperity and success, as described by Adams in his book Epic of America: Life should be better and richer and fuller for everyone, with opportunity for each, according to ability or achievement regardless of social class or circumstances of birth (Adams, 1931:373). In fact, the “American dream” is not only a national ethos for the Americans but has also spread globally with its soft power, admired by many people around the world. In China, the “Chinese dream” is advocated publicly by President Xi Jinping in 2012, which he refers to the pursuit of Chinese prosperity, collective effort, socialism, and national glory (also see Liu, 2015; Miller, 2017). Xi says:. - 41 -.
(3) 21世紀東アジア社会学 第10号. The Chinese dream, after all, is the dream of the people…realizing the great renewal of the Chinese nation is the greatest dream for the Chinese nation in modern history…(Young people should) dare to dream, work assiduously to fulfill the dreams and contribute to the revitalization of the nation. (Xinhua English News, 2016) In this sense, the “American dream” and the “Chinese dream” similarly stress the importance of entrepreneurial spirit and improvement of living standards and social life through one’s efforts. These “dreams” are also defined and constructed by the media and the government in explicit ways and widely discussed, shared, and recognized by their people. Due to the lack of public discussion by the media or an official definition by the Japanese government, there is no concrete definition of what the “Japanese dream” really refers to. Nevertheless, we can still grasp the essence of the “Japanese dream” by drawing some insights from existing studies. According to the opinion poll conducted by Japanese Cabinet Office, there is a constant rise of the Japanese population recognizing themselves as middle class from around 70% in 1958 to 90% in 1979. The prevalence of a “middleclass identity” shared by Japanese people has even given rise to the term “one hundred million middle-class society” (in Japanese: ichioku-souchuuryuu-shakai). The increase of middle-class consciousness at that time is attributed to rising income brought by economic growth and the life-long employment system that promoted stable life and working environment for many Japanese, which is further facilitated by media glimpses of the middle-class American dream. For most Japanese at that time, their “dream” is to become part of the “middle-class”, moving up the social ladder through education and hard work and be able to enjoy a rich material life. At the heart of the Japan’s “middle-class dream” is the desire for upward mobility and economic wealth through one’s efforts, and the path to these goals are getting into a top university, a good company, getting married, and owning a home and a car, among others. The dreams of owning a modest “my home” was particularly popular as described in Neitzel’s recent study (2016) on the middle class dream in postwar Japan, which argues that danchi (high-rise housing projects during the high-speed economic growth to house aspiring middle-class families) and danchi lifestyle served as “a powerful ‘middle-class dream’ which shaped the materiality and ideology of postwar everyday life” (Neitzel 2016). In fact, the pursuit of the “middle-class dream” was highly accepted by the Japanese people, because it not only led to an increase of living standards for individuals but also contributed to Japan’s economic success as the “number one” of the world (see Vogel, 1963; 1979). Japan’s “middle-class dream” is also characterized by an emphasis on hard work and group-orientation. During the rapid economic growth era, “salaryman” (white-collar worker or businessman) was expected to work selflessly for the success of the company. - 42 -.
(4) 論 文:日本人の「夢」は変わってきたのか?. and for the good of the whole society because the latter were the prerequisite for individual success. Workers often sacrifice their family time for company matters; overtime work was common and “overwork death” (in Japanese karoshi) was not rare. Nevertheless, Japanese people still widely believed their middle-class dream could come true if they were able to endure hard work and contribute to the company, for individual success often comes after the success of the society and company. Also, while the economic growth era has witnessed the rise of female labor participation, Japan’s “middle-clas dream” is often perceived in patriarchal ways in that male are expected to be as breadwinner, contributing to the success of Japan’s economy, and female as kensairyobo (wise-wife-good-mother), taking good care of husbands and children so that they can concentrate on their work and study. Such division of labor in families has been considered the foundations of Japan’s economic success and often portrayed positively in many Japanese soap-dramas. Although there has been no such concrete definition of a “Japanese dream”, the general public appeared to show a strong longing for a “middle-class dream” and a belief in achieving upward mobility that could be achieved through individual hard work and determination during the rapid economic growth era. Their “middle-class dream” is also characterized by a strong belief that personal success could be brought by hard work and selfless services to the company, and by an inclination to a gender-based household labor division. For convenience of discussion, throughout this paper, the “Japanese dream” is defined as a “middle-class dream” that was popularized in post-war Japan when its economy experienced rapid recovery and growth. With this working definition of the “Japanese dream”, it is then possible for us to examine whether it has sustained or changed over the past decades along with Japan’s economic and social developments. Economic development and value changes Economic development has been one of the major forces shaping our value orientations. For instance, using data from the three waves of the World Values Surveys, Inglehart & Baker (2000) find that economic development is associated with shifts away from absolute norms and values toward values that are increasingly rational, tolerant, trusting, and participatory. This is possible because increased economic well-being has given space and time for people to reflect on and pursuit other aspects of well-being, such as diversity and equality of society. In recent years, we see increasing acceptance of social values (e.g. LGBT) and cultural diversity (e.g. Islam) in Japanese society. The pursuit of diversity and equality in Japan can be partly attributed to the overall increase of economic well-being in Japanese society. The ups and downs in Japanese economy is also a strong force that has continuously shaped and reshaped values in Japan. The rise of the “middle class dream” in Japan (and other social values that are needed to support the pursuit of this “dream”) can be argued. - 43 -.
(5) 21世紀東アジア社会学 第10号. as a product of Japan’s fast-paced growth in the post-war period. But when the economic miracle came to a stop in the early 1990s and Japan entered a prolonged period of stagnation, which lasts until today, Japanese people have started to lose confidence in themselves and wonder the pursuit of the “middle class dream” is no longer suitable. Therefore, we would expect there is a gradual shift (or liberation) from economic and personal achievement, towards a higher diversity of values, such as friendships, community, leisure and the like. There will also be increasing awareness of work-life balance and gender equality as the society is becoming more tolerant and respectful for individual rights. Hypotheses Based on the above background and theories, the following hypothesis is developed: The new generation is associated with values less associated with the “Japanese middle class dream” (emphasis on economic and personal achievement, importance of work over leisure, and “male breadwinner female homemaker” gender role). Data The data for analysis used in this study is from the Survey of Japanese Value Orientation. This survey is conducted by NHK (Japan Broadcasting Corporation) every 5 years from 1973 to 2008 to “monitor long-term changes in basic Japanese values and attitudes concerning life and society” (Kono et al., 2010). In each round of the survey, 5,400 people aged 16 and older (12 people×450 spots by stratified two-stage sampling) were selected for a face-to-face interview. The NHK’s Survey of Japanese Value Orientation is the best dataset available that suits the purpose of our study for a few reasons. First of all, the survey covers a wide range of topics to monitor the changes in value orientation of Japanese, among which three of the topics, namely (1) life goals, (2) ideal work-leisure balance, and (3) ideal family pattern, provide some hints about the changes related to the “Japanese middle-class dream”. Second, the survey has been conducted since 1973 every 5 years. Therefore, data from 8 waves covering Japan’s over past 30 years from rapid economic growth, the burst of the bubble, to stagnation were available for analysis. Variables Dependent variables 1. Life goals Although the NHK’s Survey of Value Orientation does not ask explicitly what the dreams of Japanese people are, it does have a question concerning “life goals”, allowing us to understand what Japanese are seeking for in their life. The question was designed. - 44 -.
(6) 論 文:日本人の「夢」は変わってきたのか?. based on Mita’s theory of value orientation (1996) and respondents were asked to indicate the credo that best describes their ideal approach to life. Which of the following four credos most closely describes your ideal approach to life”: A) Enjoying life freely one day at a time (Enjoyment) B) Gradually building an abundant life in accordance with a clear-cut plan (Advantage) C) Spending each day in a happy atmosphere with the people closest to me (Affection) D) Cooperating with others to make the world a better place (Justice) 2. Work-leisure balance Work-leisure balance is measured by the following question: Which of the following five statements most closely describes your ideal approach to work and leisure?” A) I prefer to discover the meaning of life from leisure more than from work. B) I want to finish my work quickly because I want to enjoy my leisure as much as possible. C) I want to spend the same efforts on work and leisure. D) I enjoy my leisure sometimes, but I prefer to spend more efforts on work. E) I look for the meaning of life from my work and spend all my efforts on it. 3. Ideal family pattern To understand changes in the ideal family pattern, the survey asks the respondents the following question: Which of the following most closely describes your ideal approach to the family? A) The wife following the lead set by her husband B) Independence of wife and husband C) Division of labor by sex D) Cooperation within family Independent variables Cohort, age, and other socio-demographic indictors As the main purpose of our analysis is to test whether the “Japanese dream” has changed over the past few decades (i.e. whether the new generations have different “dream” (value orientations) than the old generations), the effects of cohort and age have to be examined. The cohort variable is constructed based on respondents’ year of birth (9 groups: 1904-13, 1914-23, 1924-33, 1934-43, 1944-53, 1954-63, 1964-73, 1974-83, and 1984-93). The group 1984-93 was the comparison group in the regression equations. The age variable was constructed based on their age (6 groups: 16-24, 25-34, 35-44, 45-54,. - 45 -.
(7) 21世紀東アジア社会学 第10号. 55-64, and 65-74); 16-24 is the comparison group. A number of control variables which may affect the dependent variables were incorporated in our analysis. They include gender (0 = male, 1 = female), education level (junior high school, high school, college/technical college, university/graduate school), marital status (0 = not living with spouse, 1 = living with spouse), and occupation (management, white collar, sales/service, blue collar, unemployed, student, selfemployed, and agriculture/forestry/fisheries). Analytical strategies We apply cohort analysis in our study to picture longitudinal value changes among Japanese people. Cohort analysis is a method to examine the relationships between the target variables and other indicators in terms of three time scales, namely age, period, and cohort. However, it is widely known as a statistical challenge to identify the independent effects of each of the time variable as they are highly interrelated and lineally depending on each other, as cohort is defined as “period minus age”. To deal with this so-called “identification problem” associated with cohort analysis, a variety of techniques such as “Bayesian cohort model” (Nakamura 2002, 2004)”, “nonlinear transformation approach” (Fienberg and Mason 1985) and “hierarchical APC model” (Yang 2008) have been developed. However, the more fundamental problem with using both age, period, and cohort variables in the same regression is that it causes “multicollinearity”, leading to unreliable and unstable results due to high correlations among dependent variables. The simplest solution to avoid this is to remove one time variable from the age-period-cohort model. In this paper, instead of using the three approaches, we adopt the age-cohort model for simpler and more theory-driven results. Age-cohort model is highly suitable for our analysis due to the following reasons. According to Inglehart’s theory of values changes (1977), the “prevailing conditions” that we experience during formative years leave a lasting impact on us (i.e. cohort effects). They found that the most significant changes in individuals’ values along with modernization is a shift in emphasis from survival values to self-expression values (Inglehart and Baker, 2000). On the other hand, Inkeles and Smith (1974) found that, when entering adulthood, adaptation to society has an important effect on our value changes (i.e. aging affect). For instance, going through various life stages—such as becoming wives/husbands and afterwards parents, being promoted in workplace, and then reaching retirement age—is a crucial factor affecting our values. The “Japanese dream”, defined as the “middle-class dream” in this paper, is more commonly hold by people who were born in the period “1944-53”. This group of people spent their formative years when Japan experienced rapid economy recovery and growth (Inglehart, 1977), which provided much opportunity for career and economic success. Under such socio-economic contexts, this cohort is arguably the group who internalized the “middle-class dream” the most. In addition, considering the effects of socialization on. - 46 -.
(8) 論 文:日本人の「夢」は変わってきたのか?. values formation for adults (Inkeles and Smith, 1974), the working population in the 1970s (i.e. the groups who were born during or before the period “1944-53”), who were also under such “positive” socio-economic conditions, are arguably highly associated with the “middle-class dream”. Therefore, the groups “1904-13”, “1914-23”, “1924-33”, “1934-43”, and “1944-53” can be considered the cohorts which are strongly affected by the “middle-class dream”. Fig. 1 Composition of respondents (age) 2003. 16-19 years old. 1993. 20-39 years old. 1983. 40-59 years old. 1973. 60 years old and above. 0%. 50%. 100%. One more important reason for adding age in our regression model is that population is ageing rapidly in Japan and the proportion of elderly respondents in the survey is rising gradually in each year (fig. 1). It is therefore possible that any changes shown in the descriptive time-series comparison could simply be caused by the number of elderly people that are inclined to choose or not to choose a particular answer is actually increasing. Adding the age variable in our model therefore allows us to examine the effects of age on value changes, by removing the effects caused by the size of people belonging to that age group.. - 47 -.
(9) - 48 -. Cohort. Age. Work. Marital Status. Education. Gender. 37.9%. 29.1%. 24.0%. 20.3%. 20.7%. 21.2%. 21.4%. 26.2%. 1974-83. 1964-73. 1954-63. 1944-53. 1934-43. 1924-33. 1914-23. 1904-13. 32.2%. 65-74. 38.9%. 23.6%. 55-64. 1984-93. 17.8%. 22.2%. Agriculture, Forestry and Fisheries. 16.2%. 19.3%. Self-employed. 45-54. 34.5%. Student. 35-44. 26.4%. Unemployed. 33.5%. 24.4%. Blue collar. 18.8%. 21.5%. Sales, Service. 16-24. 17.7%. White collar. 25-34. 16.8%. 20.3%. Management. Living with spouse. 38.3%. 19.9%. 31.1%. 34.5%. 33.6%. 30.6%. 28.0%. 23.8%. 22.8%. 10.2%. 15.5%. 26.0%. 35.3%. 36.6%. 35.8%. 23.2%. 29.2%. 32.5%. 21.9%. 23.3%. 31.5%. 31.6%. 35.6%. 37.8%. 32.0%. 22.5%. 14.8%. 30.4%. Not living with spouse. 31.9%. 29.3%. 24.3%. 28.0%. 30.6%. Advantage. 18.7%. 24.5%. High school. College/Technical college University/Graduate school. 26.9%. 21.9%. Junior High school. 25.1%. Male. Female. Enjoyment. 35.9%. 33.2%. 34.5%. 39.6%. 44.6%. 44.6%. 43.6%. 37.3%. 38.9%. 38.9%. 37.6%. 36.3%. 39.3%. 40.4%. 39.3%. 31.1%. 37.2%. 39.3%. 41.2%. 35.5%. 41.6%. 40.4%. 32.9%. 38.0%. 40.4%. 38.5%. 43.3%. 39.5%. 35.0%. 42.5%. 34.0%. Affection. Life Goals. 18.0%. 14.4%. 9.7%. 6.1%. 4.4%. 3.5%. 3.6%. 2.0%. 12.0%. 13.5%. 12.8%. 10.6%. 7.9%. 5.0%. 3.9%. 17.5%. 11.0%. 4.2%. 9.1%. 8.7%. 5.3%. 6.3%. 12.5%. 9.7%. 6.8%. 8.3%. 6.0%. 6.7%. 13.8%. 7.6%. 10.4%. Justice. 765. 1932. 4152. 5856. 6461. 4283. 2926. 1379. 451. 3150. 4668. 5215. 5981. 5167. 4141. 1467. 3428. 2072. 9434. 4499. 1756. 4983. 1563. 21019. 8334. 3343. 4258. 13337. 8493. 16228. 13527. N. 10.3%. 5.1%. 5.7%. 5.3%. 5.8%. 6.1%. 8.7%. 10.9%. 5.6%. 10.1%. 6.6%. 5.1%. 4.4%. 6.4%. 7.6%. 5.3%. 4.2%. 5.6%. 8.9%. 6.4%. 7.5%. 5.7%. 4.4%. 6.1%. 8.1%. 4.9%. 7.2%. 6.8%. 6.9%. 7.2%. 6.0%. leisure >>work. 32.2%. 35.1%. 32.3%. 29.2%. 25.7%. 22.2%. 24.4%. 25.8%. 19.7%. 32.9%. 32.1%. 28.3%. 27.0%. 25.5%. 20.6%. 31.2%. 22.1%. 18.0%. 35.5%. 28.2%. 24.3%. 23.9%. 17.9%. 29.0%. 24.5%. 19.0%. 24.4%. 26.9%. 34.2%. 32.7%. 21.9%. leisure >work. 13.9%. 18.0%. 19.7%. 24.4%. 34.8%. 42.6%. 47.6%. 46.5%. 52.7%. 21.1%. 24.4%. 28.6%. 32.5%. 38.5%. 44.7%. 15.9%. 26.1%. 45.7%. 27.2%. 30.9%. 39.8%. 40.0%. 28.2%. 28.8%. 38.5%. 41.1%. 39.8%. 33.3%. 20.2%. 31.9%. 31.0%. leisure =work. 27.7%. 28.5%. 31.9%. 33.9%. 29.9%. 26.1%. 17.8%. 14.5%. 20.2%. 24.4%. 28.1%. 30.8%. 31.7%. 26.6%. 24.1%. 35.6%. 38.3%. 27.6%. 21.5%. 28.1%. 24.2%. 27.4%. 40.4%. 29.4%. 23.7%. 30.4%. 24.9%. 28.3%. 27.7%. 23.0%. 33.4%. leisure <work. 16.0%. 13.3%. 10.3%. 7.2%. 3.7%. 3.0%. 1.4%. 2.3%. 1.8%. 11.5%. 8.8%. 7.2%. 4.3%. 3.0%. 3.0%. 12.0%. 9.4%. 3.0%. 6.9%. 6.4%. 4.3%. 3.0%. 9.1%. 6.8%. 5.1%. 4.7%. 3.8%. 4.7%. 11.0%. 5.2%. 7.8%. leisure <<work. Ideal Work-leisure Balance. 721. 1897. 4118. 5825. 6451. 4303. 2927. 1380. 446. 3042. 4612. 5214. 5992. 5170. 4147. 1462. 3416. 2070. 9113. 4500. 1771. 5013. 1576. 20868. 8229. 3355. 4265. 13307. 8254. 15945. 13518. N. 31.5%. 26.1%. 23.9%. 19.1%. 17.6%. 15.2%. 11.1%. 6.2%. 5.2%. 25.8%. 20.1%. 18.3%. 17.6%. 15.7%. 13.5%. 27.6%. 21.7%. 12.2%. 21.1%. 18.3%. 14.7%. 14.3%. 16.2%. 19.0%. 17.4%. 13.5%. 13.5%. 17.5%. 25.1%. 19.0%. 18.1%. Wife follows husband. Table 1. Cross table for dependent and independent variables. 11.2%. 13.1%. 15.8%. 18.9%. 20.7%. 19.5%. 22.0%. 26.3%. 27.8%. 15.4%. 18.7%. 19.9%. 17.9%. 19.5%. 22.7%. 14.8%. 19.8%. 24.7%. 14.5%. 17.4%. 20.9%. 25.3%. 19.4%. 18.1%. 21.0%. 25.4%. 23.9%. 18.7%. 13.9%. 19.0%. 18.6%. Independent. 32.6%. 34.9%. 34.6%. 33.7%. 27.5%. 19.0%. 12.8%. 9.3%. 7.4%. 26.4%. 29.3%. 28.6%. 27.9%. 24.9%. 20.3%. 30.1%. 30.7%. 19.4%. 27.3%. 29.3%. 22.5%. 20.0%. 34.7%. 28.1%. 21.9%. 21.2%. 18.7%. 26.4%. 32.5%. 24.0%. 29.1%. Division of labor. 24.7%. 25.8%. 25.7%. 28.3%. 34.1%. 46.3%. 54.0%. 58.2%. 59.6%. 32.4%. 31.9%. 33.2%. 36.6%. 39.8%. 43.5%. 27.5%. 27.8%. 43.7%. 37.1%. 35.0%. 41.9%. 40.3%. 29.7%. 34.8%. 39.7%. 39.9%. 43.8%. 37.5%. 28.5%. 37.9%. 34.1%. Cooperation. Ideal Family Pattern. 740. 1886. 4107. 5803. 6417. 4279. 2916. 1359. 446. 3046. 4603. 5196. 5955. 5147. 4116. 1440. 3393. 2053. 9211. 4433. 1753. 4985. 1563. 20855. 8144. 3321. 4254. 13267. 8238. 15995. 13375. N. 21世紀東アジア社会学 第10号.
(10) - 49 -. -.106. .314***. 55-64. 65-74. .047 27193. -.449***. -.422**. -.569***. 27193. .058. 1924-33. 1914-23. 1904-13. N. Pseudo R2 (Nagelkerke). .269*. .059. .322*. .618***. .557***. -.136. -.266*. .082. -.022. 1934-43. 1954-63. -.155. -. -1.023***. -.500***. -.117. .028. .202**. -. .057. .017. -.093. -.243***. -. -.010. .052. .115. .369***. -.317***. 1944-53. -.167. -.280*. 1964-73. -.084. -.400***. 45-54. 1974-83. -.558***. 35-44. -. -.469***. 25-34. 1984-93. -. -.189*. 16-24. Notes: ***p < 0.001; **p < 0.01; *p < 0.05. Cohort. Age. Agriculture, Forestry and Fisheries. -.020. -.221***. Student. Self-employed. .137**. Unemployed. -.072. Sales, Service. -. -.149**. Blue collar. -.239**. Management. White collar. Work. -.350***. -. Living with spouse. -. .178**. College/Technical college University/Graduate school. Marital Status. -.135*. .530***. -.487***. .633***. Junior Highschool. Highschool. .024. -.925***. Education. -.328***. Female. -.753***. Advantage. Gender. (Intercept). Enjoyment. .030. 27193. -.796***. -.699***. -.727***. -.613***. -.266*. .062. .116. .172. -. .730***. .590***. .378***. .328***. .173**. -. -.080. .095. .008. .091*. -. .098. .053. -.057. -.010. -. .071. .023. -.038. .318***. -.708***. Affection. Life Goals. .085. 27193. 2.960***. 2.494***. 2.168***. 1.735***. 1.227***. .880*. .629. .522. -. -.258. .033. .166. .215. .065. -. .308**. .107. .317. .023. -. -.174. -.031. .210*. -.134*. -. -.152. -.249**. .068. -.303***. -3.735***. Justice. .040. 27093. -.922**. -1.431***. -1.020***. -.908***. -.417. -.128. .354. .622**. -. 1.227***. .706***. .270*. -.192. -.173. -. -.178. -.386***. -.751***. .174*. -. .025. -.150. -.264. -.087. -. .353**. .393***. .370***. .020. -2.714***. leisure >>work. .051. 27093. -.135. -.053. -.072. -.131. -.189. -.220. -.041. .198. -. .317***. .393***. .306***. .244***. .164*. -. -.058. -.382***. -.325***. .127**. -. -.193**. -.074. -.395***. .075. -. .130*. .277***. .516***. .441***. -1.632***. leisure >work. .086. 27093. -1.793***. -1.481***. -1.400***. -1.141***. -.681***. -.417***. -.201. -.271*. -. .231**. .161*. .094. -.009. -.033. -. -.472***. -.129*. -.007. -.068. -. .126*. .065. -.165*. -.053. -. -.141**. -.267***. -.527***. .081**. .308*. leisure =work. .070. 27093. 1.561***. 1.520***. 1.486***. 1.413***. 1.055***. .699***. .116. -.242. -. -.807***. -.617***. -.393***. -.096. -.003. -. .338***. .435***. .553***. -.139**. -. -.003. .073. .405***. .043. -. -.045. -.025. -.198***. -.407***. -1.559***. leisure <work. Ideal Work-leisure Balance. .092. 27093. 2.513***. 2.396***. 2.173***. 1.874***. 1.240**. .986*. .213. .545. -. -.196. -.294. -.226. -.380*. -.286. -. .176. .266**. .110. -.110. -. -.008. -.327**. .289*. -.143. -. -.034. -.020. .413***. -.384***. -3.994***. leisure <<work. .045. 26979. 2.438***. 2.231***. 2.126***. 1.849***. 1.710***. 1.465***. 1.025***. .326. -. -.322**. -.464***. -.374***. -.202*. -.096. -. .287***. .157**. -.011. .007. -. -.096. -.046. -.037. -.165***. -. .015. .183**. .344***. .057. -3.114***. Wife follows husband. .032. 26979. -1.072***. -.870***. -.652***. -.422**. -.324*. -.455***. -.289*. -.101. -. .459***. .406***. .281***. .024. .008. -. -.074. .102. .246**. -.317***. -. .070. .246***. -.064. -.066. -. -.131*. -.359***. -.539***. .194***. -.906***. Independent. .101. 26979. 3.374***. 3.372***. 3.182***. 2.950***. 2.409***. 1.685***. 1.055***. .562**. -. -1.615***. -1.263***. -1.007***. -.665***. -.313***. -. -.129. .049. .148. .125*. -. -.039. -.190***. .313***. -.027. -. .009. .225***. .271***. -.353***. -2.704***. Division of labor. Ideal Family Pattern. Table 2. Logistic regression analysis on life goals, ideal work-leisure balance, and ideal family pattern. .101. 26979. -2.895***. -2.781***. -2.637***. -2.364***. -1.839***. -1.079***. -.598***. -.256*. -. 1.238***. 1.028***. .773***. .511***. .193**. -. -.073. -.250***. -.210**. .115*. -. .025. -.035. -.241***. .175***. -. .064. .008. -.080. .104***. .476***. Cooperation. 論 文:日本人の「夢」は変わってきたのか?.
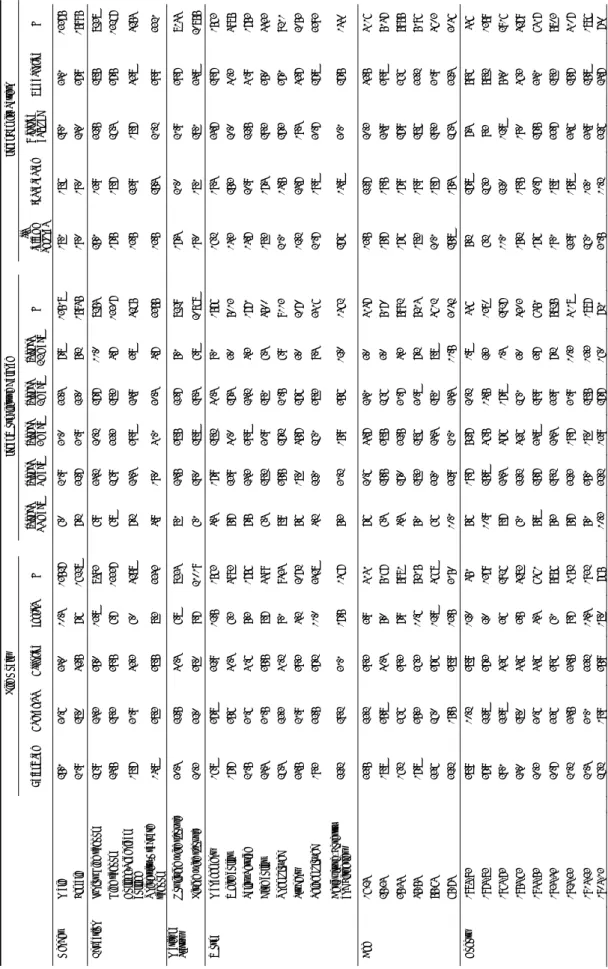
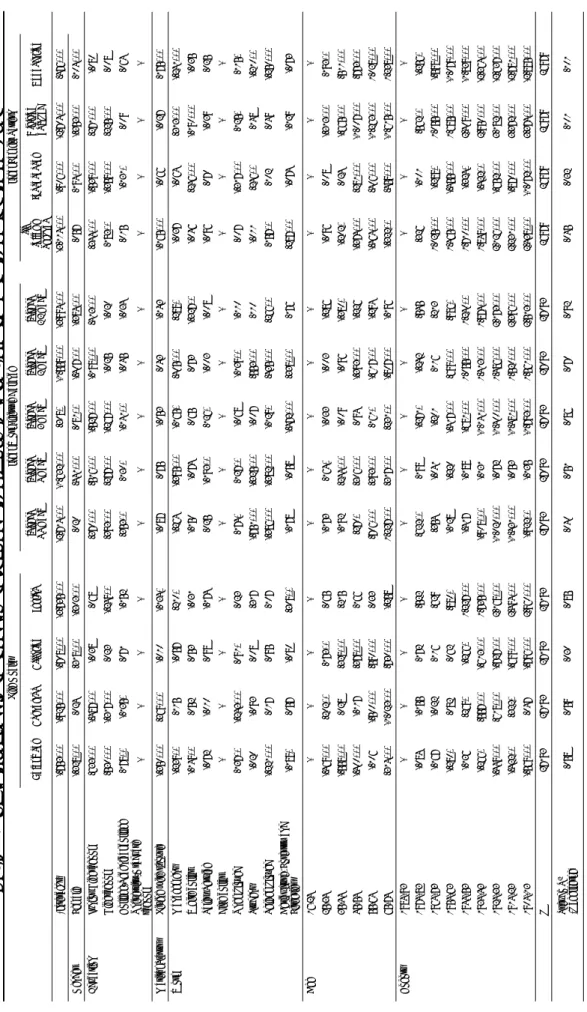
(11) 21世紀東アジア社会学 第10号. Results Table 1 is the cross table for dependent and independent variables. Table 2 shows the logistic regression analysis on life goals, work-leisure balance, and family pattern. The following part discusses some of the most important findings. Life Goals We find strong cohort effects for all credos. “Enjoyment” has a very strong negative association with old cohorts, especially for the group 1904-13 (b = -.569, p < .001), 191423 (b = -.422, p < .01), and 1924-33 (b = -.449, p < .001). For ageing effects, people at their young (25-34, 35-44) and middle ages (45-54) are strongly and negatively correlated to “enjoyment”, while the elderly (65-74) shows a strong and positive correlation (b = .314, p < .001). “Advantage” is significantly and strongly related to the cohorts 1914-23 (b = .322, p < .05), 1924-33 (b = .618, p < .001), 1934-43 (b = .557, p < .001), and 1944-53 (b = .269, p < .05) (who were born during and after the war period) and to the age group 25-34 (b = .202, p < .01). On the other hand, strong negative correlations are found between “advantage” and the age groups 55-64 (b = -.500, p < .001) and 65-74 (b = -1.023, p < .001). The effects of cohorts on “affection” change from positive to negative when moving from the new cohorts to old cohorts. Especially, the old cohort groups have very strong and negative associations to “affection”: 1934-43 (b = -.613, p < .001), 1924-33 (b = -.727, p < .001), 1914-23 (b = -.699, p < .001), and 1904-13 (b = -.796, p < .001). Interestingly, the results also show a strong and significant ageing effects on “affection”: the importance of “affection” grow along with one’s age. Strong correlations are found between “justice” and the old cohorts as seen from the high coefficients for people born in 1904-13 (b = 2.960, p < .001), 1914-23 (b = 2.494, p < .001), 1924-33 (b = 2.168, p < .001), 1934-43 (b = 1.753, p < .001), 1944-53 (b = 1.227, p < .001), and 1954-1963 (b = 0.880, p < .05). We also observed downward cohort effects from the results: the younger the cohort groups, the weaker the effects on “justice”. In contrast to other credos, the results do not show any ageing effects on “justice”. Ideal work-leisure balance Our results indicate several significant relationships between the perception of “ideal work-leisure balance” and cohorts. First of all, the idea that “work is more important than leisure” (i.e. “leisure << work”, “leisure < work”) is significantly and positively associated with older cohorts. Downward cohort effects for this trend are evident as. - 50 -.
(12) 論 文:日本人の「夢」は変わってきたのか?. shown by the decreasing size of coefficients (2.513 to .545 for “leisure << work” and 1.561 to -.242 for “leisure < work”). In other words, the old cohorts tend to put more emphasis on their work than leisure compared to the young cohorts. The idea that “leisure is as important as work” (i.e. “leisure = work) has stronger negative correlations to the old cohorts than the young cohorts. That is, compared to the old cohorts, the young cohorts tend to show more acceptance to the notion that work and leisure are equally important. Moreover, our results also indicate that the idea that “leisure is more important than work” is positively associated with the younger cohorts but negatively associated with the older cohorts. Apart from the cohort effects discussed above, our results also show some interesting ageing effects on work-leisure balance. When people get older, they tend to put more emphasize on leisure than work, as shown from the increasing correlations between “leisure >> work” and the age groups 45-54 (b = .270, p < .05), 55-64 (b = .760, p < .001), and 65-74 (b = 1.227, p < .001). Similar tendencies can also be found for the results of “leisure > work” and “leisure = work”, indicating people are getting more “leisureoriented” with age. Ideal family patterns Our results indicate both cohort and age have significant effects on people’s ideal patterns of family. In terms of cohort effects, we found the downward trends of “wife follows husband” and “division of labor” as we move from the old cohorts to young cohorts. This is to say, the old cohorts tend to view these family patterns as ideal when compared to the young cohorts. As for “independent” and “cooperation”, upward trends can be observed when moving to the young cohorts, meaning the younger cohorts are more associated with these family patterns. In terms of ageing effects, there is a tendency towards “independent” and “cooperation” as people age, whereas the popularity of “wife follows husband” and “division of labor” patterns decline with age. Discussion The results of our analyses indicate the effects of cohort, age, and various sociodemographic factors on life goals, ideal work-leisure balance, and ideal family pattern of Japanese people. The results offer support to our research hypothesis: the new generation is associated with values less associated with the “Japanese middle-class dream” (emphasis on economic and personal achievement, importance of work over leisure, and “male breadwinner female homemaker” gender role).. - 51 -.
(13) 21世紀東アジア社会学 第10号. For changes in life goals, we found upward cohort effects on “enjoyment” and “affection”, and downward cohort effects on “advantage” and “justice”. In other words, comparing to the older cohorts, the younger cohorts tend to prefer “enjoying life freely one day at a time” and “spending each day in a happy atmosphere with the people closest to me” to “gradually building an abundant life in accordance with a clear-cut plan” and “cooperating with others to make the world a better place”. These changes may be related to the burst of economic bubble and the prolonged economic stagnation since the early 1990s. People who were born and raised in recession period have lost their hope in the future because the path to achieving the “Japan's middle-class dream” is no longer available given the economic conditions. Investing in education, working hard to move upward, and planning ahead seems to become pointless and painful, as the larger economic and social context is outside of one’s control. They also began to doubt the idea of collectivism and selfless contribution to company and society for the common good. The younger cohorts began to shift their life goals from the pursuit of advantage and justice to maintaining good relationships with other and focusing on everyday enjoyment, which are more achievable by one’s efforts in daily life. Therefore, for young Japanese people, the desire to move up economically and contribute to the well-being of the society appears to be gradually replaced by a desire to maintain a stable and harmonious relationships with friends and family and live a hedonistic lifestyle. We also clarify the life cycle effects on “enjoyment” and “advantage”. Regardless of generation in which they were born, people at their young and old ages emphasize more on enjoyment, while middle-aged people prefer to build an “abundant life” with a mindful plan. The life cycle effects shown in the Japan’s case seem to agree with the general life patterns of modern people, whose priority of life changes in accordance with transition from teenage age (enjoyment), career age (advantage), and retirement life (enjoyment again). The results also show that the ideal work-leisure balance for Japanese people has changed gradually over the past 30 years. The society has witnessed a growing desire for leisure or work-leisure balance among the younger cohorts. The older generations stress the importance of work over leisure probably because they were born during the rapid economic growth period of Japan when work and life could “coexist”, as hard work could lead to better income and thus an enjoyable life. However, when Japanese economy began to collapse and stagnate, the lost decade (people born in the 1990s and 2000s) seem no longer agree with what the older generations hold, as they believe working hard for the company might not necessary bring better income and upward mobility. Moreover, there. - 52 -.
(14) 論 文:日本人の「夢」は変わってきたのか?. has also been a promotion work-life balance in Japan as the society is increasingly concerned about the problem of “overwork-death”, as well as the government has attempted to address the problem of population aging through restricting overtime work and facilitating family life, thereby bursting Japan's fertility rate. Growing concern over work-life balance have liberated Japanese “salarymen” from the “company-first” principle, who were obligated to work unpaid overtime (sābisu-zangy), to spend time after hours socializing with colleagues and clients over drinks, and was unable to leave work before their workaholic supervisors. In addition, Japan has seen a rise of irregular working styles in its labor system, such as part-time job and temporary work. The increase of irregular working style is attributed to the breakdown of life-long employment and restructuring of companies during the recession period, which has reduced the size of full-time employees and therefore a large amount of irregular workforce is required to fill these positions. When career paths become dim or nonexistent for irregular workers, the younger cohorts tends to be less motivated and less focused on work and turn to leisure for a sense of satisfaction and achievement. As the number of “freeter” (furītā) (young people with lower education and not in full-time permanent employment) and working poor (wākingu pua) are rising (see Chiavacci 2008), we expect the younger cohorts will increasingly challenge the Japanese middle-class dream. The ageing effects on work-life balance is also clear. People tend to put more emphasis on work than life when they are in young and middle-ages, and prefer life to work when they get older. In fact, the ageing effects on work-life balance are similar to what we see for “enjoyment” and “advantage”. In reality, Japan’s work culture still judge their employees based on their willingness to spend limitless face time with coworkers, attend an endless succession of meetings and prioritize work over private life. It is never easy to put a priority on leisure because overtime work is still widely accepted and allowed by law. For instance, the Japanese government actually allows overtime practice with a limit of 360 hours per year (Ministry of Health, Labor, and Work). In 2015, a graduate of the University of Tokyo in 2015 committed suicide as she suffered a mental breakdown after working overtime for 130 hours in one month. As long as the Japanese government and companies do not work out policies to address the problem of overtime work and Japan’s workaholic culture, it is never going to be easy to achieve better work-life balance. Japan’s ideal family pattern has undeniably changed over the decades. The patterns of “wife follows husband” and “division of labor by sex” are generally agreed by the older cohorts, whereas the younger cohorts show more support for “independence” and. - 53 -.
(15) 21世紀東アジア社会学 第10号. “cooperation in the family”. These changes are understandable as the Japanese society has experienced a series of feminism movement through the 1970s and beyond, a liberation from the traditional family system that has a strong patriarchal essence, as well as a gradual empowerment of female through education and work. Apart from growing gender equality in Japan’s family, the unstable employment system during economic stagnation has also contributed to the development of a family style that emphasizes economically independence and husband-wife cooperation within the family. With the decrease of full-time positions, more and more people are forced to engage in low-salary irregular and temporary positions, and both husbands and wives have to work to support their family. As the distinction between breadwinner and housemaker has become less important, wives also expect husbands to help with housework and child-rearing. Conclusion Let us return to our main research question: is the “Japanese dream” changing? From the above analysis, we find that the new generation is seeking something quite different from the old generation. Moving from the old to young cohorts, (1) the life goals of building wealth for one’s own future and improving the society is increasingly replaced by enjoyment and building harmonious relationships with the others, (2) emphasis on work is taken over by emphasis on leisure/ work-leisure balance, and (3) dependence and division of labor has lost their support to independence and cooperation in family. Based on the results, we may argue “the Japanese dream” has transformed from the old cohorts to the young cohorts in this way: from the pursuit of the common good for society and personal wealth with a career in the future, supported by a hardworking spirit and an ideal “male as breadwinner and female as housewife” idea during the rapid economic growth, to seeking happiness by having a harmonious relationships with close friends, family, and cultivating leisure, with an increase of gender equality, during the prolonged period of economic stagnation. The trends of “Japanese dream” we observed based on the NHK’s data in this study also largely agree with the finding of Inglehart and Baker (2000). Both show that economic developments are associated with value changes from widely accepted beliefs toward values that are more tolerant and diversified in nature-in our study, the “Japanese middle-class dream”, work-orientedness, and gendered role in family have given way to emphasis on non-economic achievements, work-life balance, and gender equality. In fact, many of these changes are related to the burst of the economic bubble and prolonged economic stagnation, which have made Japanese people to gradually shift their life goals from economic success to cultivating social relationships and leisure. The rise of low-pay. - 54 -.
(16) 論 文:日本人の「夢」は変わってきたのか?. irregular employment system has also required both husbands and housewives to be actively engaged in the workforce in order to earn a living for their family, changing the ways Japanese people view gender roles in family. The change of the “Japanese dream” may have both positive and negative implications. On the dull side, young people may stop making investments in their education and work; think less about the future of society; stop buying homes; and are less likely to take entrepreneurial risks. On the bright side, people turn to discover life purpose by building a harmonious relationship with close friends. They treasure the present state of life and are more satisfied with their status quo. There is also increased awareness of work-life balance and gender equality in family. Other results in the same survey also revealed similar trends. For instance, according to NHK’s report (2015), the decrease in the number of people who want to “work independently without hesitation” from 1973 to 2013 seems to indicate the decline of entrepreneurial spirits in Japan (NHK, 2015: 147). Similarly, the number of people in their 20s who prefer “a stable job” has increased from 12% to 30%, showing Japanese young people are becoming less interested to take risk in their career development (NHK, 2015: 153-4). In addition, compared to the past, people nowadays prefer a job that allows them to “work happily with colleagues” than that allows them “to make contributions to the world”, showing a stronger preference for good human relationships and less for selfless contributions to the society (NHK, 2015: 147). Nevertheless, the actual implications of these trends for individuals and society requires further investigation in the future. This preliminary study has explored the general trends of the “Japanese dream” over the past decades. However, it should be reminded that the results presented here merely shows the “a clear but general shifting away from the “middle-class dream” from the older cohorts to younger cohorts”. It does not attempt to examine the characteristics of each cohort. While we are highly aware that people from each cohort might possess dreams similar to or different from the “middle-class dream”, the features of these dreams are not dealt with in this paper because it is not the main concern or objective of this study. Also, the analytic strategy adapted in this paper, which is arguably the most suitable method as far as we are concerned, do not have enough power to allow us to shed lights on the characteristics of each cohort, which are highly complicated. To do so will require countless efforts and time and paper space that we decide it should be left for future studies. Apart from the above limitation, further studies are required to better understand the changing values of Japanese people, as well as the causes for such changes. Firstly, other. - 55 -.
(17) 21世紀東アジア社会学 第10号. aspects of changes, such as social and political activities, should also be paid attention. Also, the latest wave 2013 survey should also be studied when it is made available in the future in order to observe the latest changes. Finally, we hope that this study may provide some insights into understanding the social changes of other East Asian countries that have been following Japan’s path of industrialization and social developments. Acknowledgement The data for this secondary analysis, Japanese Value Orientation Survey (NHK Broadcasting Culture Research Institute) was provided by the Social Science Japan Data Archive, Center for Social Research and Data Archives, Institute of Social Science, The University of Tokyo. References Adams, J. T. (1931) The Epic of America. Greenwood Press, 1931. Bell, D. (1973) The Coming of Post-Industrial Society. New York: Basic Books. Cambridge Dictionary, available at https://dictionary.cambridge.org/ (accessed 26 Mar 2019) Chiavacci, D. (2008) “From Class Struggle to General Middle-Class Society to Divided Society: Societal Models of Inequality in Postwar Japan”, Social Science Japan Journal, Volume 11(1), 5–27, https://doi.org/10.1093/ssjj/jyn022. Inglehart , R. (1977) The Silent Revolution: Changing Values and Political Styles Among Western Public, Princeton University Press. Inglehart, R. & Baker W. E. (2000) “Modernization, Cultural Change, And The Persistence Of Traditional Values.” American Sociological Review, 65(1) 19-51. Inkeles, A. and David H. S. (1974) Becoming Modern: Individual Change in Six Developing Countries, Harvard University Press, Cambridge. Japanese Cabinet Office. Kokumin seikatsu ni kansuru yoron chosa (Survey on National Lifestyle), available at http://survey.gov-online.go.jp/index-ko.html (accessed 12 Jan 2017). Kono, K., Takahashi K., and Hara M. (2010) “The Survey of Japanese Value Orientations: Analysis of Trends over Thirty-Five Years”, available at https://www.nhk.or.jp/bunken/english/reports/ (accessed 26 Mar 2019). Liu, M. F. (2015) The China Dream: Great Power Thinking and Strategic Posture in the Post-American Era. CN Times Books Inc. Marx, K. (1867) Capital, Volume 1. London: Penguin. Mason, W. M. and Stephen E. F. (1985) Cohort Analysis in Social Research: Beyond the. - 56 -.
(18) 論 文:日本人の「夢」は変わってきたのか?. Identification Problem, Springer-Verlag, New York. Miller, T. (2017) China's Asian Dream: Empire Building along the New Silk Road. Zed Books. Mita, M. (1996) Kachiishiki no riron: yokubo to doutoku no shakaigaku (Theory of Value Orientation), Koubundou. NHK Broadcasting Culture Research Institute. (1973-2008) Survey of Japanese Value Orientation. NHK Broadcasting Culture Research Institute (2015) Gendai nihonjin no ishiki kouzo 8th edition (The Contemporary Japanese Consciousness), NHK. Nakamura, T. (2002) “Cohort analysis of data obtained using a multiple choice question”, Nishisato, S., Baba, Y., Bozdogan, H., and Kanefuji, K. Eds., Measurement and Multivariate Analysis, Springer-Verlag, 241-248. Nakamura, T. (2004) “A Bayesian logit age-period-cohort model”, ISM Research Memorandum, 922. Neitzel, L. L. (2016) The Life We Longed For: Danchi Housing and the Middle-Class Dream in Postwar Japan. Merwinasia. Vogel, E. F. (1963) Japan's New Middle Class: The Salary Man and His Family in a Tokyo Suburb, University of California Press. Vogel, E. F. (1979) Japan as number one: Lessons for America. Cambridge, MA: Harvard University Press. Xinhua English News. (2016) “Xinhua Insight: Chinese dream is a dream for all.” 3 Dec 2016, available at http://news.xinhuanet.com/english/201612/03/c_135878166.htm (accessed 12 Jan 2017). Yang, Y (2008) “Social Inequalities in Happiness in the United States 1972 to 2004: An Age-Period-Cohort Analysis,” American Sociological Review, 73: 204-26.. (Ng, Ka Shing / Nagasaki University) (Shimizu, Koki / Hokkaido University). - 57 -.
(19)
図

関連したドキュメント
The input specification of the process of generating db schema of one appli- cation system, supported by IIS*Case, is the union of sets of form types of a chosen application system
Laplacian on circle packing fractals invariant with respect to certain Kleinian groups (i.e., discrete groups of M¨ obius transformations on the Riemann sphere C b = C ∪ {∞}),
She reviews the status of a number of interrelated problems on diameters of graphs, including: (i) degree/diameter problem, (ii) order/degree problem, (iii) given n, D, D 0 ,
In this paper, we study the generalized Keldys- Fichera boundary value problem which is a kind of new boundary conditions for a class of higher-order equations with
Keywords: continuous time random walk, Brownian motion, collision time, skew Young tableaux, tandem queue.. AMS 2000 Subject Classification: Primary:
Then it follows immediately from a suitable version of “Hensel’s Lemma” [cf., e.g., the argument of [4], Lemma 2.1] that S may be obtained, as the notation suggests, as the m A
While conducting an experiment regarding fetal move- ments as a result of Pulsed Wave Doppler (PWD) ultrasound, [8] we encountered the severe artifacts in the acquired image2.
p≤x a 2 p log p/p k−1 which is proved in Section 4 using Shimura’s split of the Rankin–Selberg L -function into the ordinary Riemann zeta-function and the sym- metric square
