Observations of Sea-Salt Particles at the
Seashore of Hentona, Okinawa during the AMTEX
'75 I : On the Amount of Sea-Salt Particles at
the Seashore
著者
CHAEN Masaaki
journal or
publication title
鹿児島大学水産学部紀要=Memoirs of Faculty of
Fisheries Kagoshima University
volume
27
number
1
page range
231-238
別言語のタイトル
AMTEX '75における沖縄本島辺土名海岸での海塩粒
子の観測結果 I : 海岸における海塩粒子の存在量
URL
http://hdl.handle.net/10232/13128
Observations of Sea-Salt Particles at the
Seashore of Hentona, Okinawa during
the AMTEX 75—I*1
On the Amount of Sea-Salt Particles at the Seashore
Masaaki Chaen*2
Abstract
In order to obtain the amount of sea-salt particles at the seashore, as one of the
first study problem in AMTEX, mechanism of transfer of various physical quantities in the surface boundary layer, the observations of sea-salt particles were carried out at the seashore of Hentona, Okinawa, on Feb. 19 to 28, 1975. We compared the number concentration and the salt-mass distribution of sea-salt particles with those of the sea surface obtaind by Chaen. The amount of sea-salt particles is four or
five times higher than that of the sea surface in the salt-mass class of logw=2~3,
in wind force 3 and 4. The production rate of sea-salt particles at the seashore is estimated.
1. Introdution
It is a well-known fact that sea-salt particles is produced on the sea surface,
and it is an important parameter concerning the energy and mutter exchanges
between the air and the sea. The amount and the production rate of sea-salt
particles on the sea surface were obtained by Chaen (1973). The purpose in
the present study is to obtain the amount and the production rate of sea-salt
particles at the seashore, as one of the first study problem in AMTEX, mecha
nism of transfer of the various physical quantities in the surface boundary
layer. The observations of sea-salt particles were carried out at the seashore of Hentona, Okinawa, on Feb. 19 to 28, 1975. The observation site and the ob
serving spots of sea-salt particles, where the Kagoshima University station for
AMTEX situated, is shown in Fig. 1.
The summary of observations by the
Kagoshima University group at Hentona site during AMTEX is described in de
tail by Takahashi (1978).
2. Procedure of observation
The method of micro chemical analysis was used for the observation of
sea-salt particles.
This is extensively used in the case where the large number of
** This report was presented at IAGA/IAMAP Joint Assembly, Seattle USA.
232 Mem. Fac. Fish., Kagoshima Univ. Vol. 27, No. 1 (1978)
Open sea
-*s -z//////777
.///'A
Fig. 1. Map showing the seashore of Hentona and the observing spots of sea-salt particles.
observations of sea-salt particles. The sampling surface is a gelatin layer on the film containing silver dichromate gel, and the sampling instrument is a hand operated jet impactor desigened by Toba and Tanaka (1967). The proce dure of the method is described in detail in my previous work (Chaen, loc. cit.).
The surface meteorological data at the time of sampling, the wind, the dry and wet-bulb temperatures and sea-surface conditions were obtained. The wind speed was read from the indicator of a cup anemometer equipped at the 8 m level on the tower, 250 m apart from a low water shore line (Takahashi,
Tabata and Kanbara, 1976). The wind speed at the 10 m level was estima
ted from the 8 m level value by the use of the logarithmic law, with the fric tion coefficient, CD, of 1.6xl0~3. The wind dirction, the blowing angle to the
shore line was measured by a simple wind vane and the direction of wind
waves. The relative humidity was calculated from the values of the dry and
wet-bulb temperatures measured by use of an Assmann ventilated psychrometer
at the shore line. The concentration of sea-salt particles (number of particles
cm~3) and the surface meteorological data are tabulated in Table 1. The data at the observing spot 2 and 3 are to obtain the impaction effect of sea-salt par ticles by the groves for salt-damage prevention, discussed in part II (Chaen,
1978).
HENTONA—f
* In this article, the term "sea-salt particles" is used in £all meaning including all the
states of droplets of sea water, droplets of condensed sea-silt solution, and dry sea-salt particles.
Chaen: Observations of Sea-SaltParticles at the Seashore of Hentona Table1. Maindata ofthe observation. TheUl0 representsthe windspeed at10 mlevel, RHthe
relative (thesalt logm^l.0 particlesfor ofsea-salt numberconcentration 0the theseashore, humidityat
masscontained, »*,is in10-"gm unit). The wind direction indicates the arrowblowing tothe seashore and the groves (dashed lines). Date Uu RH Obs.St. 0 Wind
Sea-Surface Direction (lO-scm-a) No. (#) (msec"1) Feb*75 No. Run Condition ~~ 1 722 V- -V;- 519 2 72 11.8 15:00-15:20 19 1 whitecaps 1 196 k IV." 166 2 60 7.5 10:22-10:48 20 2 whitecaps _^,. 29.9 3 ~~~ 1 500 S,« <" 430 2 64 11.3 14:50-15:15 20 3 whitecaps "^47* 1 bo. 3 — ~T 826 ^ "V" 475 2 66 14.7 17:45-18:00 20 4 whitecaps ..«.-.. 283 3 ~~~ [ 84(3 j "T" 601 2 79 12.5 09:35-09:50 21 5 whitecaps — i 910 | "i"'" 637 2 81 10.1 14:40-14:55 21 6 whitecaps 1 597 j ""V"' 401 2- 75 10.9 17:45-17:58 21 7 whitecaps ...y.... 181 3 1 238 I ~f 71.8 2 61 11.6 11:40-12:03 22 8 whitecaps -J--" 149 3 __ 1 679 \ -y- 507 2 64 12.3 14:45-15:00 22 9 whitecaps •—V— 159 3 1 10 22 17:35-17:55 12.2 67 2 3 a 11 23 17:10-17:28 3.9 54 2 12 24 10:50-11:12 2.3 45 2 1 13 25 10:25-11:05 2.5 77 2 3 ^ ^ y 14 26 09:25-10:15 4.6 69 2 130 ""/" nowhitecaps ••"/-- 62.0 3 1 234 •/ ""/" 152 2 69 8.2 13:20-13:42 26 15 whitecaps .—-/.-. 68.6 3 1 274 / 190 2 66 6.5 16:25-16:45 26 16 * whitecaps —y— 79.5 3 17 28 09:40-10:00 7.6 72 2 354 ~t~ whitecaps ^ -—/— 98.4 3 18 28 H•: 22-11:45 7.9 66 2 313 ";?" whitecaps 1 269 / ~'f~ 184 2 71 8.1 12:50-13:15 28 19 whitecaps 233 241 150 84.5 -i—• •;••" whitecaps 218 154 62.4 y •••'•/" no whitecaps 23.4 18.4 4.35 / smooth sea 60.8 48.9 10.8 smooth sea
234 Mem. Fac. Fish., Kagoshima Univ. Vol. 27, No. 1 (1978)
3.
The mean salt-mass distribution of the concentration of sea-salt particles for
each wind force.
The mean salt-mass distribution of the concentration, 6, for each wind force
in Beaufort scale at the obs. spot 1 is shown in Fig. 2. The height of sampl
ing at the obs. spot 1 is about 3 m above the lower sea level. In Fig. 2 is also
shown the mean salt-mass distribution of 0 at the 3 m height above the sea
surface obtained by Chaen (loc. cit.). This is estimated from the 6 m level
values by the use of Toba's theory (Toba, 1965), in the case where sea-salt
particles equilibrate to the relative humidity of 95^ (Chaen, loc. cit.).
We
can easily find some features of the distribution of 0 at the seashore. The
distribution cannot be expressed by a straight-line for the salt-mass class of log
m>l. It was found that the distribution of 0 obtained above the sea surface was
close to a straight-line segment for the salt-mass class of log m>l, and expressed
by the well-known Junge's form concerning aerosols in the atmosphere (Chaen,
loc. cit.). The character of the mean salt-mass distribution of 0 at the
sea-10° to
§10"2
icr3 1(f AMTEX '75 ~ n Salt-mass distribution. Obs.spotK shore) Run.no. --0--W.F. 7 ( U --X-- - 6 ( 1 . 3.5.7. 8.9.10; --A-- ~ 5 ( 6,15.19.20 --0-- - t, ( 2.16.17. IB _-•--„ 3 ( M |4 _. + __ „ 2 ( ,2#,3 Chaen (1973) W.F.7 1 2 3 log m U 5 io-M 10'° 10-weight 10-8 10 gmFig. 2. Mean salt-mass distribution of the number concentration of sea-salt particles, 6, for the
shore may be regarded as always same with changing wind speed.
Compare the value of the concentration at the seashore with that of the sea surface, the former is a half of the latter in the salt-mass class smaller than
log m = l. 5. On the other hand, in the larger salt-mass class of log m=2~3, the former is in high concentration than that of the latter, especially, from two to five times in high concentration in wind force 3 and 4. The concentrations in wind force 5, 6 and 7 are about three times those of the sea surface. In the larger salt-mass class of log w = 3, the concentration at the seashore is
rather low compared with that of the sea surface, this may be not truth be
cause of no sampling by the rod sampler (Chaen, loc. cit.). From the results mentioned above, the production of the sea-salt particles in the salt-mass class larger than log m = 2 at the seashore is larger than that of sea surface, under
the condition of wind force larger than 3. This seems to be caused by the
breaking waves on reef and shore. Blanchard (1969) reported that salt nuclei
generated by the local surf did not reach the height of 15 m above the sea
level at the seashore.
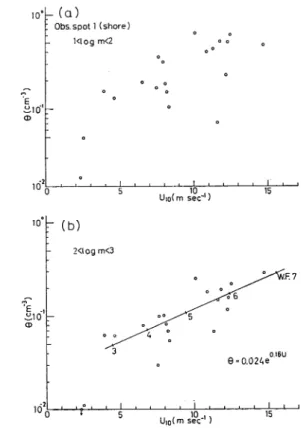
Obs. spot 1 (shore) Klog m<2 iicf' _1 i i i i L 5 , 10 ,, Uio(m sec"1; 101 (b) 2<logm<3 e -i 0 = O.O24e ' U|0(m sec"')
Fig. 3. Relation between the number concentration
of sea-salt particles, 6, at 3-m level and wind speed, ftio, salt-mass class l<log m<2(a>), 2<logm<3(b).
236 Mem. Fac. Fish., Kagoshima Univ. Vol. 27, No. 1 (1978)
4. Relation between the concentration of sea-salt particles and wind speed. According to Chaen (loc. cit.), Toba and Chaen (1973), there is a clear relation between the concentration of sea-salt particles and the demensionless variable u*L/v, which represents the overall degree of the breaking of wind
waves. In the present paper, the relation between 0 and wind speed, U10, is
examined because of the difficulty of the observation of wind waves at the
seashore. Fig. 3 shows the relation between 0 and U10, for the salt-mass class
of log ra=l~2 and 2—3. It is seen in the figures that 0 increases linearly with
U10 on the log 0-Ulo diagram. The relation between the two is clearer in the larger salt-mass class than in the smaller one. The following empirical formula for the larger salt-mass class of sea-salt particles is proposed concerning the value of 0 at a height of 3m:
0 = O.O24eol6t/1°
The value of wind factor is almost same of that of the sea surface (Chaen,
1971).
5. Estimation of the production rate of sea-salt particles at the seashore. For the estimation of the production rate of sea-salt particles (particles nu mber cm-2 sec-1), or upward flux of the particles which balances with downward flux at the sea surface, firstly, the value of concentration of sea-salt particles
at the sea surface must be obtained. It is estimated from the 3 m level value
by the use of Toba's theory (loc. cit.), in the cace where sea-salt particles
equilibrate to RH of 95 %, because of there was no observation of the vertical
distribution of sea-salt particles. Secondly, the reference level of the production of sea-salt particles, the ^-surface is also introduced as the production surface.
The production rate, Fu at the Zi-surface, or the acutual sea surface, or the
upward flux of the droplets, which balances with the downward flux, is unders
tood as
Fx = ws 0zx
where ws represents the terminal velocity of sea-water droplet, 0zx the con centration of sea-salt particles at the zx surface. The practical procedure for obtaining the value of Fx is described in detail by Chaen (loc. cit.).
Since the character of the salt-mass distribution curve of 0 may be regard ed as always same for each wind force, the Fx curve may be also regarded as
always same for each wind force. Therefore, the Fx curve in wind force 5 is
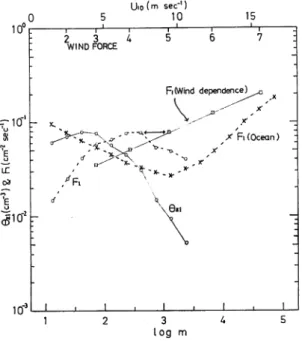
( in<> D Uio (m sec"') 5 10 15 i i > 10 1 r~ i i i i -2 3 k 5 6 7 : WIND FORCE R(Wind dependence) « riff' » \ r
A^JT^X * ' °"" "* v^-^ XFi (Ocean)
-/F-
\
"•
\
1
in"3 -1 , -1 , -1 , -1 , -1 1 2 3 U 5 log mFig. 4. Representative curves for the production rate, Fv the number concentration, 0zl, at the zY surface and wind dpendence of Fv Values of Fx and 0zl are enterd for wind
force 5, and the values of wind dependence
of Fx are entered for logw=2-3. The Fx
curve of the sea surface is also entered.
entered in the figure, in order to compared with the two Fx curves. As clearly seen in Fig. 4, the salt-mass distribution of Fx at the seashore has a maximum value at log m=2. 5, and from this point, it decreases with the decreasing and the increasing salt mass. This is the most conspicuous feature in the Fi curve at the seashore, though the values of F1 for the salt-mass class larger than log
m=2. 75 are doubtful, because of no sampling by the rod sampler. The impor
tant result in the present study is the high production rate in the salt-mass class of log m = 2~~3. By the use of Fig. 4, the salt-mass distribution of 0zx and
Fx for wind force 3—7 can be predicted by the parallel translation of the curves
for wind force 5, on the basis of the intervals among wind forces on the curve
of wind dependence.
6. Conclusion
Observations of sea-salt particles were carried out at the seashore, in order to obtain the amount of sea-salt particles at the seashore. The result is com pared with that of the sea surface.
238 Mem. Fac. Fish., Kagoshima Univ. Vol. 27, No. 1 (1978)
of the sea surface in the salt-mass class of log w=2—3.
The character of the
salt-mass distribution curve of 0 may be also regarded as always same for each
wind force at the seashore (Fig. 2).
The production rate of sea-salt particles
at the seashore is estimated by the use of the procedure of Chaen (loc. cit.),
though the materials are not complete.
The high production rate is obtained in
the salt-mass class of log tn=2~3 (Fig. 4).
For the obtainning the more reason
able value of Fx at the seashore, it is necessary to observe the vertical distri
bution of 0 and wind waves.Acknowledgments
The author wishes to express his sincere thanks to Prof. Tadao Takahashi of
Kagoshima University for his advice and encouragement throughout this study.
He thanks Messrs. Takanori Tsruno and Kimio Mouri for their assistance in the observation. He also thanks Miss Rieko Wago for her assistance in the
drawing.
References
Blanchard, D. C. (1969): The oceanic prodution rate of cloud nuclei. /. Rech. Atmos., 4, 1-6. Chaen, M. (1971): Observations of giant sea-salt particles in the sea-surface boundary layer.
Mem. Fac. Fish. Kagoshima Univ., 20, 55-72.
Chaen, M. (1973) : Studies on the production of sea-salt particles on the sea surface. Mem.
Fac. Fish. Kagoshima Univ., 22, 49-107.
Chaen, M. (1978) : Observations of sea-salt particles at the seashore of Hentona, Okinawa
during the AMTEX '75-11. Impaction effect of sea-salt particles by groves for salt-damage
prevention. Mem. Fac. Fish. Kagoshima Univ., 27, 239-248 (in Japanese).
Takahashi, T. (1978): Observations in atmospheric surface boundary layer at Hentona site
during AMTEX. Mem. Fac. Fish. Kagoshima Univ., 27, 225-229.
Takahashi, T., M. Tabata and H. Kanbara (1976): An observation tower for atmospheric
boundary layer next to the sea surface in AMTEX. Mem. Fac. Fish. Kagoshima Univ., 25,
1-5.
Toba, Y. (1965) : On the giant sea-salt particles in the atmosphere. II. Theory of the ver tical distribution in the 10-m layer over the ocean. Tellus, 17, 356-382.
Toba, Y. and M. Chaen (1973) : Quantitative expression of the breaking of wind waves on
the sea surface. Records Oceano. works in Japan, 12, 1-11.
Toba, Y. and M. Tanaka (1967) : Simple technique for the measurement of giant sea-salt particles by use of a hand-operated impactor arid a chloride reagent film. Special Contr