富山県立大学機関リポジトリ
112
0
0
全文
(2)
(3) Contents CHAPTER 1 INTRODUCTION....................................................................................................1 1-1 Resources of Natural Products..............................................................................................3 1-2 Unexplored Microbial Species............................................................................................. 5 1-3 Polyketides are Structurally Diverse.................................................................................... 7 1-4 Screening Methodology........................................................................................................9 1-4-1 ‘Culture-Dependent’ Screening...............................................................................10 1-4-2 ‘Culture-Independent’ Screening............................................................................ 12 CHAPTER 2 Akaeolide, a Carbocyclic Polyketide from Marine-Derived Streptomyces sp. NPS554..............................................................................................................................................17 2-1 Background......................................................................................................................... 18 2-2 Results and Discussion....................................................................................................... 21 2-2-1 Fermentation and Isolation......................................................................................21 2-2-2 Structure Determination of Akaeolide.................................................................... 23 2-2-3 Bioactivity............................................................................................................... 27 2-3 Experimental Section..........................................................................................................27 2-4 Spectral Data.......................................................................................................................31 CHAPTER 3 Biosynthesis of Akaeolide and Lorneic Acids and Annotation of Type I Polyketide Synthase Gene Clusters in the Genome of Streptomyces sp. NPS554............................................. 55 3-1 Background......................................................................................................................... 56 3-2 Results and Discussion....................................................................................................... 58 3-2-1 Incorporation of 13C-Labeled Precursors................................................................ 58 3-2-2 Genome Analysis and Annotation of Biosynthetic Genes...................................... 62 3-3 Materials and Methods........................................................................................................70 3-4 Spectral Data and Genomic Information............................................................................ 74 CHAPTER 4 Bioinformatics-Inspired Isolation of Akaemycin...................................................81 4-1 Background......................................................................................................................... 82 4-2 Results and Discussion....................................................................................................... 82 4-2-1 Fermentation and Isolation......................................................................................82 4-2-2 Structure Determination of Akaemycin.................................................................. 84 4-2-3 Bioactivity............................................................................................................... 89 4-3 Experimental Section..........................................................................................................89 4-4 Spectral Data.......................................................................................................................92 CHAPTER 5. CONCLUSION.................................................................................................... 103. Acknowledgements......................................................................................................................... 107.
(4)
(5) CHAPTER 1. INTRODUCTION. 1.
(6) Natural products refer to the organic compounds isolated from natural sources that are produced from the pathways of metabolisms. In the field of organic chemistry, the definition of natural products is often further restricted to secondary metabolites. Unlike primary metabolites such as amino acids, nucleotides, lipids and carbohydrates, which are basic cellular components and required for life, secondary metabolites are dispensable and not absolutely required for survival. Nevertheless, the variety of functions that secondary metabolites possess provides the producers evolutionary advantages. Though not all of the secondary metabolites can be explained how they benefit their producers yet, some of these compounds are produced for obvious purposes such as pheromones that act as social signaling molecules, agents that solubilize and transport nutrients, and cytotoxic materials used as “chemical warfare” against competitors, prey, and predators.. Figure 1-1. Representative natural products with pharmaceutical value. We have used these bioactive compounds as traditional medicines for hundreds of years, even not knowing the active components and their potential. Discovery and subsequent clinical success of application of penicillin prompted a large-scale search for other environmental microorganisms that might produce anti-infective natural products: the total number of discovered compounds kept increasing exponentially in the following decades, and by the end of 2002 about 22000 bioactive 2.
(7) secondary metabolites were reported.1 These natural products are widely used in drug design and development, not only as antibiotics such as penicillin, erythromycin, and streptomycin, but also for various biological activities: acarbose, an inhibitor of α-glucosidase used to treat type 2 diabetes mellitus; FK506, an immunosuppressive drug lowering the risk of organ rejection after allogeneic organ transplant; paclitaxel, interfering with the normal breakdown of microtubules during cell division that used to treat cancer (Figure 1-1).. 1-1 Resources of Natural Products The source of natural products covers prokaryotes and eukaryotes, which are almost all the living organisms, and among which actinomycetes have made magnificent contribution in producing compounds with pharmaceutical potential: about half of the naturally generated antibiotics were found from actinomycetes, and 70% of them are from Streptomyces (Table 1-1).1 Table 1-1. Number of antibiotics from microorganisms.1 Bacteria Actinomycetales Streptomyces Rare actinomycetes Fungi Total. Antibiotics. Bioactive. Total. 2900. 900. 3800. 6550 2250 4900. 1080 220 3700. 7630 2470 8600. 16500. 6000. 22500. Streptomyces is the largest genus of Actinobacteria with over 500 known species belonging to the family Streptomycetaceae. Streptomyces are Gram-positive and grow in various environments, with a filamentous form resembling fungi. The formation of hyphae and their differentiation into spores is unique among Gram-positives. The most interesting property of Streptomyces is the ability of producing diverse secondary metabolites.2-4 The discovery of antibiotics derived from Streptomyces began with streptothricin found in 1942, and in the following decades, over 7500 bioactive compounds have been found from this genus, such as erythromycin (S. fradiae), neomycin (S. griseus), tetracycline (S. rimosus), vancomycin (S. orientalis), daptomycin (S. rosesporus), rifamycin (S. mediterranei), chloramphenicol (S. venezuelae), promycin (S. alboniger), lincomycin (S. lincolnensis), cefoxin (S. lactamdurans), etc (Figure 1-2).5 We have been benefited from natural product research since the discovery and medicinal use of antibiotics in the 1950s, and in the following decades the average lifetime of the population increased significantly with many infectious diseases almost disappeared or controllable. The upcoming technological improvements of isolation and structure determination methods increased the number of newly isolated metabolites, from which a lot of new applications in non-medical areas were developed. However, after the ‘golden age’ from the sixties, the scientific field has changed continuously, and by the nineties, these changes became significant. The efficiency of antibiotic research decreased, productivity of classical screening methods failed and rediscovery became more frequent than ever. Only a few new chemical structures were discovered, and the majority of new compounds were analogues of known compounds.6,7 The continuously increasing research costs and less promising leads have resulted in the decreasing activity and productivity of 3.
(8) pharmaceutical industry: the introduction of new compounds into therapy and the marketing of new products have significantly decreased from 20-30 new drugs per decade to 3-4 newly marketed drugs over the past years.8 a). b). c). d). Figure 1-2. Antibiotic-producing Streptomyces strains.9 a) S. fradiae b) S. rimosus c) S. griseus d) S. coelicolor On the other hand, combinatorial synthesis that fast developed in 1990s provides methods of preparing a large number of compounds in a single process. This strategy was once believed to be capable of replacing natural products as main resource for drug development. However, despite the increased speed of synthesis, the combinatorial synthesis has not yielded any real increase in the number of lead optimization candidates or drugs. This is probably because compared with natural products, randomly synthesized compounds lack structure variety and biological meaning. Therefore, it is believed that natural products are still the most promising source for new drug leads.10 From a pharmaceutical point of view, natural products are still important resource for screening bioactive compounds. Based on the statistical numbers,11,12 the total number of marketed drugs used in human therapy is estimated to be ~3500 compounds, representing less than 0.01% of all known chemical compounds. Approximately 50% of drugs are direct natural products or derivatives of natural product scaffolds, which represent a high success rate. Of all the antimicrobial-antitumor drugs, natural product-derived drugs represent the majority. The percentage of natural antibiotic drugs among all known natural products is 0.6%, and for microbial products it is 1.6%. Approximately half (47%) of the microbial metabolites (~33000 compounds) exhibit some kind of biological activity, including antibiotic and ‘other’ effects, and ~40% (~28000 metabolites) are conventional antibiotics (Table 1-2).. 4.
(9) Table 1-2. Approximate number of known synthetic compounds, all natural products and microbial products. Numbers Drugs Percentage. Synthetic chemical compounds. Natural products. Microbial products. 8-10 millions 2000-2500 0.005. ~500000 1200-1300 0.6. ~70000 450-500 1.6. However, in contrast to this situation, the need for new bioactive compounds is never decreasing. In fact, the situation is very serious. Today, more than 70% of pathogenic bacteria are resistant to most antibiotics on the market. Reappearing ‘old’ pathogens such as mycobacteria and along with the new emerging ones will potentially threaten public health and bring human society back to pre-antibiotic era. The mortality of some multi-resistant infections has reached to 50%-80%. Over two million fatalities per year are due to bacterial infections. Close to two billion people carry Mycobacterium tuberculosis, and according to the WHO, by 2020, about 35 million people will die of tuberculosis. Malaria and HIV account for 300 million illnesses and more than five million deaths each year. It seems that the research of natural products is trapped in a difficult position: it is quite possible that valuable discoveries are hidden deeply within the mine of natural products, but for some economic and scientific reasons the development is not prosperous. To stop the decline of microbial metabolite research and increase the effectiveness of the discoveries, the following two directions are probably the best choices for researchers:13 unexplored new species and screening of microbial genome for new secondary metabolites.. 1-2 Unexplored Microbial Species Unexplored new microbial species are important resources for discovery of novel secondary metabolites. Since new microbial species are genetically different from the known ones, it is possible that they may carry different gene clusters for production of secondary metabolites. According to the 16S rRNA gene that is used as the standard for classification and identification of microbes, the newly isolated microbe strains can be compared within public database such as NCBI. The strains with gene similarity below 97% are very possible to be new species, and also good candidates for screening of novel natural products. Acquiring new microbial species is an important way to approach novel products. Although a large number of actinomycetes have been isolated and screened from soil in the past few decades, recent efficiency of discovery of new metabolites from terrestrial actinomycetes has decreased.14 Thus, it is a crucial moment that new groups of actinomycetes from unexplored habitats should be developed as sources of novel secondary metabolites, such as marine and physically or geochemically extreme environments. The diversity of life in the terrestrial environment is extraordinary, but the greatest biodiversity occurs in the oceans.15 The oceans cover 70% of the Earth’s surface and harbor most of the planet’s biodiversity. Although marine plants and invertebrates have received considerable attention as a resource for natural product discovery, the microbiological component of this diversity remains relatively unexplored. Marine sources, such as deep-sea sediments, from the seashore mud to the depths of 10000 meters are rich sources of microbes as same as soil samples. 5.
(10) Indeed, the marine environment is a basically untapped source of novel actinomycete diversity,16,17 and therefore, of new metabolites.18,19 Although the exploitation of marine actinomycetes as a source for discovery of novel secondary metabolites is at an early stage, numerous novel metabolites have been isolated in the past few years.20 Among them, a few compounds such as sporolides, salinosporamide A, lodopyridone, arenimycin, marinomycins and proximicins (Figue 1-3) are of particular interest due to their rarity and potent and diverse bioactivity.. Figure 1-3. Some new secondary metabolites produced by marine actinomycetes. Sporolides are novel polycyclic macrolides from the obligate marine bacterium Salinispora tropica, which is found in ocean sediment, that are composed of a chlorinated cyclopenta[a]indene ring and a cyclohexenone moiety.21 Salinosporamide A is a novel bicyclic β-lactone γ-lactam isolated from an obligate marine actinomycete, Salinispora tropica.22,23 This compound is a potent proteasome inhibitor being studied as a potential anticancer agent.24 Lodopyridone is a unique alkaloid produced by a marine Saccharomonospora sp. isolated from marine sediment collected at the mouth of the La Jolla Submarine Canyon.25 Lodopyridone possesses activity against the human colon adenocarcinoma cell line HCT-116 with an IC50 of 3.6 μM. Arenimycin is a new antibiotic belonging to the benzo[α]naphthacene quinone class produced by the obligate marine actinomycete, Salinispora arenicola.26 Arenimycin has effective antibacterial activity against rifampin- and methicillin-resistant Staphylococcus aureus and exhibits potent antimicrobial activities against drug-resistant Staphylococci and other Gram-positive human pathogens. Marinomycins were isolated from a marine actinomycete, Marinispora sp., which are unusual 6.
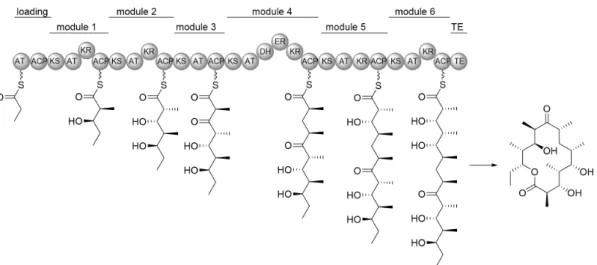
(11) macrodiolides composed of dimeric 2-hydroxy-6-alkenyl-benzoic acid lactones with conjugated tetraene-pentahydroxy polyketide chains.27 Marinomycins show significant antimicrobial activities against drug resistant bacterial pathogens and demonstrate impressive and selective cancer cell cytotoxicities against six melanoma cell lines. Proximicins were isolated from the marine Verrucosispora strain MG-37 with characteristic structural element of 4-amino-furan-2-carboxylic acid.28 Proximicins show a weak antibacterial activity but a strong cytostatic effect to various human tumor cell lines. Considering the immense biological diversity in the sea, it is increasingly recognized that a large number of novel chemical entities exists in the oceans. As marine microorganisms, particularly actinomycetes, have evolved with great genomic and metabolic diversity,29 more efforts should be focused on exploring marine actinomycetes as a source of novel secondary metabolites.. 1-3 Polyketides are Structurally Diverse According to the characterization of biosynthetic pathways, microbial secondary metabolites can be divided into different types, such as polyketides, polypeptides, terpenoids, and glycosides. Polyketides are structurally characterized as modified fatty acids or aromatic compounds, which are widely used in pharmaceutical products, such as clarithromycin, an effective antibiotic against pylori infection; avermectin for treatment of parasitic worms; tacrolimus as an immunosuppressive drug. Polyketides are structurally special for their high diversity in functional groups, chiral centers, and ring systems, which are considered as a leading resource for discovery of pharmaceutical compounds. The variety of bioactivity of secondary metabolites essentially rises their diversity in chemical structures. Polyketides represent a highly diverse group of natural products with chemical diversity, and carbon skeletons of which can be basically classified into polyphenols, macrolides, polyenes, enediynes, and polyethers. From a pharmacological point of view, polyketide is a wealthy source of novel therapeutics:30 antibiotics, immunosuppressants, antiparasitics, cholesterol-lowering, and antitumoral agents, particularly.31 It is astonishing that the vast structural and functional diversity is derived from the controlled assembly of some of the simplest biosynthetic building blocks: acetate and propionate. In general, polyketides are constructed by repetitive decarboxylative Claisen thioester condensations of an activated acyl starter unit with (methyl)malonyl-CoA-derived extender units.32 Usually, this process involves a β-ketoacylsynthase (KS), an optional (malonyl)acyl transferase (MAT/AT), and a phosphopantethienylated acyl carrier protein (ACP) or coenzyme A (CoA) which fixes the growing chain. At the end of each elongation step, the β-oxo functionality is processed by a set of optional reductive steps, such as ketoreductase (KR), dehydratase (DH), and an enoyl reductase (ER), which give rise to a complex pattern of functionalization of polyketides. (Figure 1-4) From the aspect of biosynthetic architecture and the pattern of processing biosynthesis of the enzymatic assembly lines, PKSs can be classified into different types (Table 1-3).33,34 Type I refers to large multifunctional enzymes composed of linearly arranged and covalently linked catalytic domains, whereas the term type II indicates individual enzymes produced discretedly and usually monofunctional. Furthermore, a third group of multifunctional enzymes of the chalcone synthase type is denoted as type III PKS. 7.
(12) Figure 1-4. Basic mechanisms involved in polyketide biosynthesis. Table 1-3. Representative types of PKSs. PKS type. Building blocks. Organisms. Modular type I (non-iterative); subtypes:cis-AT, trans-AT. ACP, various extender units; (in situ methylation possible). bacteria (protists). Iterative type I subtypes: NR-, PR-, HR-PKS. ACP, only malonyl-CoA extenders (in situ methylation possible). mainly bacteria. (Iterative) type II. ACP, only malonyl-CoA extenders. exclusively bacteria. (Iterative) type III. Acyl-CoA, extenders. PKS-NRPS hybrid. ACP, malonyl-CoA, amino acids. only. fungi,. malonyl-CoA mainly plants, bacteria and fungi. some. some. bacteria (modular) fungi (iterative). Apart from the type I to III classification by the enzymes or enzyme complexes, the PKSs are further categorized as iterative or non-iterative, that is, whether the KS domain catalyzes more than one round of elongation. Non-iterative type I PKSs, such as the archetypal erythromycin PKS, 6-deoxyerythronolide (6-dEB) synthase (DEBS) are giant multimodular megasynthases which are mainly found in prokaryotes (Figure 1-5).35 It is only recently that non-iterative PKSs have been reported in protozoans, such as dinoflagellates.36-38 In non-iterative PKSs, KS, AT, and ACP domains, along with optional β-keto processing domains constitute a module. Generally, each module is responsible for only a single elongation cycle. Therefore, the number of the modules is consistent with the number of extension cycles executed by the PKS, and the presence of KR, DH, and ER domains determines the degree of β-keto processing.39-41 Iterative type I PKSs is a distinctive character of fungal polyketide biosynthesis, such as the lovastatin synthase (Figure 1-6).42,43 Although the chain elongation is processed as an iterative way, the degree of reduction in each extension unit can be different, because the KR, DH, ER, and even methyl transferase (MT) domains are optionally applied in every elongation step.. 8.
(13) Figure 1-5. The deoxyerythronolide-B-synthase (DEBS) required for erythromycin biosynthesis as an example of a modular type I PKS.. Figure 1-6. Iterative PKSs involved in the biosynthesis of lovastatin. SAM: S-adenosylmethionine. Type II PKSs are mainly found in actinomycetes, and only two examples from Gram-negative bacteria are known.44,45 In type II PKS, the enzymes for polyketide assembly are expressed from a distinct gene and compose a minimal set of PKS, such as doxorubicin (Figure 1-6). This system is composed by two ketosynthase units (KSα and KSβ), an ACP that serves in tethering the growing chain, and additional PKS subunits, including ketoreductases, cyclases (CYC), and aromatases (ARO).46 It is impressive that based on the sophisticated logic of PKSs, numerous structurally complicated compounds are synthesized. Therefore in this thesis, I selected polyketides as target compounds for study.. 1-4 Screening Methodology There are in principle two approaches of screening for new bioactive compounds from natural resource, which are referred to ‘culture-dependent’ and ‘culture-independent’ methods. Literally, in a ‘culture-dependent’ screening process, the cultivation of the candidate microbial strains have to be finished first, while in a ‘culture-independent’ screening it is not necessary.. 9.
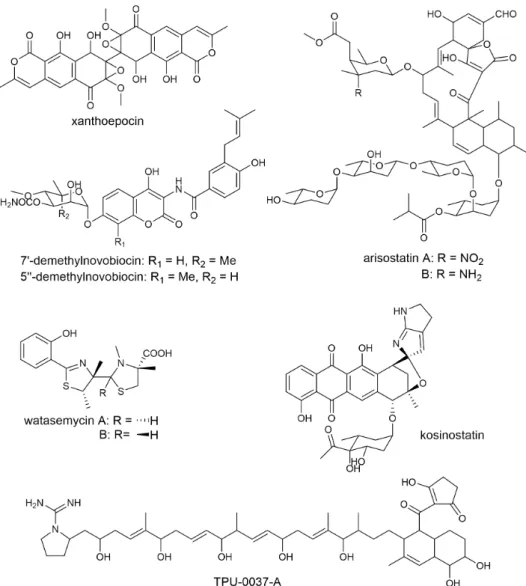
(14) 1-4-1 ‘Culture-Dependent’ Screening The conventional biological screening can be classified to ‘culture-dependent’ screening, which traces biological activity for isolation. This method has worked well in history and led to the discovery of thousands of natural products. By using biological screening, various bioactive compounds were found in our laboratory, such as xanthoepocin, arisostatins, novobiocin, watasemycins, kosinostatin, and TPU-0037-A (Figure 1-7).47-52 This screening has been proved successful in the past fifty years, especially in the discovery of antibiotics. The compounds isolated by this method are guaranteed with certain biological activities, which is an obvious advantage. However, the effectiveness of this method seems to be getting unsatisfactory with higher rate of re-discovery than before. It is mostly because that in this method, little structural information is known before the pure compound is obtained. Since the cultivation and isolation processes are time-consuming and fund-costing, continuous re-discoveries of new compounds are unacceptable for the researchers.. Figure 1-7. Bioactive compounds found by biological screening in our laboratory.. 10.
(15) In order to obtain higher efficiency in discovering new compounds, it is proposed that if certain spectroscopic properties of a compound are available before isolation, the screening can be very much fastened. This is the basic principle of another ‘culture-dependent’ screening, which is defined as spectroscopic screening. The development of HPLC technology has made it possible to fast separate compounds from a mixture by their retention times. The down-flow can be attached to an equipment for testing their spectroscopic properties, such as UV, MS, or even NMR. In this strategy, each compound can be described by its retention time and spectroscopic properties, and these records can be used to build up a library of natural products. By comparing with the known compounds in this library, the screening process can be more efficient to select potent new compounds before isolation. Although this method is advantageous for fast screening for new compounds, it has to be mentioned that the isolated compounds are not guaranteed for activities. The activity of the isolated compounds is unknown until the compounds were purified and tested by different assays, and sometimes no strong activities are found within them. Nevertheless, this strategy is still a powerful method that leads to the discovery of a large amount of novel natural products. Using spectroscopic screening our laboratory has successfully discovered many new microbial secondary metabolites, such as campechic acids, abyssomicin I, and jomthonic acids.53-56. Figure 1-8. Comparison of UV absorption wavelength and conjugated system.57. 11.
(16) In this thesis I used UV-spectroscopic screening, because the UV absorption of an organic compound is closely related to its structure. Among the several classes of natural products, polyketides have a great chemical diversity.58,59 In particular, compounds synthesized by bacterial type I polyketide synthases (PKSs) are attractive as a source of drug discovery because these enzymes utilize various starter and extender units to build highly branched and functionalized carbon skeletons. In contrast, type II and type III PKSs incorporate malonates as a sole substrate for chain elongation, which essentially finalize the formation of polyaromatic cores.60-62 Most of the metabolites produced by type I PKS, except for polyenes, contain relatively small conjugated systems that display UV absorption bands around 230-300 nm, distinguishable from metabolites containing highly conjugated systems (Figure 1-8). Therefore this strategy can fast distinguish type I PKS products from other compounds. 1-4-2 ‘Culture-Independent’ Screening Since the relationships between polyketide compounds and gene clusters are revealed as described above, it is possible to predict the structure of the compounds from genomic information, which is the basic concept of genome mining. In this way, the screening process is mostly based on the gene sequences, which requires no cultivation of the candidate microbial strains. Therefore it is defined as ‘culture-independent’ strategy in this thesis. Analyses of microbial genome sequences have revealed numerous examples of biosynthetic gene clusters with the potential to direct the production of novel, structurally complex natural products. Although microbes have great potential of producing novel compounds, it seems to be impossible to discover all of them only by ‘culture-dependent’ screening, because the production of secondary metabolites is controlled by gene expression regulation, which is further effected by environment. Therefore, in a ‘culture-dependent’ screening, one should try as many culture conditions as possible to acquire higher possibility of natural product gene expression, which is ineffective and uneconomical. It is always possible that during the ‘culture-dependent’ screening, some products may escape from being found. To obtain overall perspective of microbial secondary metabolites, genome mining seems to be the best choice. The initiation of large scale microbial whole genome sequencing projects in the mid 1990s triggered a revolution in the genetics and biochemistry of natural product biosynthesis. Analyses of microbial genome sequences currently in the publicly-accessible databases have revealed numerous examples of gene clusters encoding enzymes similar to those known to be involved in the biosynthesis of many important natural products.63 Many of these gene clusters are hypothesized to assemble novel natural products, while some others have been suggested or shown to direct assembly of known compounds via previously unexplored mechanisms. Numerous novel metabolites have been discovered as the products of such so-called ‘cryptic’ or ‘orphan’ biosynthetic gene clusters.64-66 The approach for discovery of the metabolic products of cryptic biosynthetic gene clusters is shown in Scheme 1-1.. 12.
(17) Genome scanning & whole genome sequencing. Prediction of putative function of biosynthetic genes. Partial or complete natural product structure predicted. bioassay LC-MS. -guided fractionation. LC-DAD NMR. New natural products from cryptic pathways. Scheme 1-1. Strategies for discovery of novel natural products by genome mining. Genome mining is an important prospect of the process of secondary metabolite discovery, which has the theoretical potential to eliminate chance-dependence from secondary metabolite discovery. In comparison to the historical ‘grind and find’ mode of natural product discovery, the genome mining methods will be defined by the degree to which they unleash secondary metabolic gene clusters within a given system and identify encoded metabolites. In recent years, genome mining has been facilitated by the development of next generation sequencing technology.67 Moreover, automated bio-informatics platforms now actualized the semi-automated prediction of natural products encoded by secondary metabolic blueprints.68,69 The importance of genome mining is more than its potential in the process of secondary metabolite discovery. Understanding the connection between metabolites and the gene sequences that encode them, can provide insight into the basic biology of producing organisms. As a relatively recent example, progress in understanding the biosynthesis of ribosomally synthesized and post-translationally modified peptides (RiPPs) has started a trend of identification of gene clusters encoding this previously barely understood class of compounds, and created an entire new category of genome mining and synthetic biology efforts.70 There are undoubtedly many such uninvestigated systems for secondary metabolites that create new domains for biosynthesis pathways. Many investigations of cryptic biosynthetic gene clusters have revealed that new enzymology is involved in assembly of the novel metabolic products of the clusters. Such discoveries are contributing significantly to increasing our understanding of the mechanisms for natural product biosynthesis and how such mechanisms bring about the extraordinary and still-expanding structural diversity of natural products.. 13.
(18) References 1 Bérdy J. J. Antibiot. 2005, 58, 1-26. 2 Omura S, Ikeda H, Ishikawa J, et al. PNAS, 2001, 98, 12215-12220. 3 Khan ST, Komaki H, Motohashi K, et al. Environ. Microbiol. 2011, 13, 391-403. 4 Patzer S, Braun V. J. Bacteriol. 2010, 192, 426-435. 5 Procópio RE, Silva IR, Martins MK, et al. Braz. J. Infect. Dis. 2012, 16, 466-471. 6 Demain AL, Sanchez S. J. Antibiot. 2009, 62, 5-16. 7 Fernandes P. Nat. Biotechnol. 2006, 24, 1497-1503. 8 Bérdy J. J. Antibiot. 2012, 65, 385-395. 9 Available from http://lv-microbcollect.lviv.ua/en/ 10 Feher M, Schmidt J. J. Chem. Inf. Comput. Sci. 2003, 43, 218-227. 11 Handbook of Antibiotic Compounds. 12 Dictionary of Natural Products. 13 Baltz RH. Curr. Opin. Pharmacol. 2008, 8, 557-563. 14 Fenical W, Jensen PR. Nat. Chem. Biol. 2006, 2, 666-673. 15 Donia M, Hamann MT. Lancet. Infect. Dis. 2003, 3, 338-348. 16 Stach JE, Maldonado LA, Ward AC, et al. Environ. Microbiol. 2003, 5, 828-841. 17 Magarvey NA, Keller JM, Bernan V, et al. Appl. Environ. Microbiol. 2004, 70, 7520-7529. 18 Bull AT, Stach JE, Ward AC, et al. Antonie Van Leeuwenhoek. 2005, 87, 65-79. 19 Fiedler HP, Bruntner C, Bull AT, et al. Antonie Van Leeuwenhoek. 2005, 87 37-42. 20 Lam KS. Curr. Opin. Microbiol. 2006, 9, 245-251. 21 Buchanan GO, Williams PG, Feling RH, et al. Org. Lett. 2005, 7, 2731-2734. 22 Feling RH, Buchanan GO, Mincer TJ, et al. Angew. Chem. Int. Ed. Engl. 2003, 42, 355-357. 23 Jensen PR, Williams PG, Oh DC, et al. Appl. Environ. Microbiol. 2007, 7, 1146-1152. 24 Chauhan D, Catley L, Li G, et al. Cancer Cell. 2005, 8, 407-419. 25 Maloney KN, MacMillan JB, Kauffman CA, et al. Org. Lett. 2009, 11, 5422; 26 Asolkar RN, Kirkland TN, Jensen PR, et al. J. Antibiot. 2010, 63, 37-39. 27 Kwon HC, Kauffman CA, Jensen PR, et al. J. Am. Chem. Soc. 2006, 128, 1622-1632. 28 Fiedler HP, Bruntner C, Riedlinger J, et al. J. Antibiot. 2008, 61, 158-163. 29 Jensen PR. J. Ind. Microbiol. Biotechnol. 2010, 37, 219-224. 30 Hertweck C. Angew. Chem. Int. Ed. Engl. 2009, 48, 4688-4716. 31 David O’Hagan. The Polyketide Metabolites, Ellis Horwood Series in Organic Chemistry, 1991. 32 Rawlings BJ. Nat. Prod. Rep. 1998, 15, 275-308. 33 Hopwood DA. Chem. Rev. 1997, 97, 2465-2498. 34 Staunton J, Weissman KJ. Nat. Prod. Rep. 2001, 18, 380-416. 35 Rawlings BJ. Nat. Prod. Rep. 2001, 18, 190-227. 36 Zhu G, LaGier MJ, Stejskal F, et al. Gene. 2002, 18, 79-89. 37 Snyder RV, Gibbs PD, Palacios A, et al. Mar. Biotechnol. 2003, 5, 1-12. 38 Monroe EA, Van Dolah FM. Protist, 2008, 159, 471-482 39 Cane DE, Walsh CT. Chem. Biol. 1999, 6, R319-R325. 40 Walsh CT. Science. 2004, 19, 1805-1810. 41 Fischbach MA, Walsh CT. Chem. Rev. 2006, 106, 3468-3496. 42 Schümann J, Hertweck C. J. Biotechnol. 2006, 124, 690-703. 14.
(19) 43 44 45 46 47 48 49 50 51 52 53 54 55 56 57 58 59 60 61 62 63 64 65 66 67 68 69 70. Cox RJ. Org. Biomol. Chem. 2007, 5, 2010-2026. Sandmann A, Dickschat J, Jenke-Kodama H, et al. Angew. Chem. Int. Ed. Engl. 2007, 46, 2712-2716. Brachmann AO, Joyce SA, Jenke-Kodama H, et al. Chembiochem. 2007, 24, 1721-1728. Rawlings BJ. Nat. Prod. Rep. 1999, 16, 425-484. Igarashi Y, Kuwamori Y, Takagi K, et al. J. Antibiot. 2000, 53, 928-933. Furumai T, Takagi K, Igarashi Y, et al. J. Antibiot. 2000, 53, 227-232. Sasaki T, Igarashi Y, Saito N, et al. J. Antibiot. 2001, 54, 441-447. Sasaki T, Igarashi Y, Saito N, et al. J. Antibiot. 2002, 55, 249-255. Furumai T, Igarashi Y, Higuchi H, et al. J. Antibiot. 2002, 55, 128-133. Furumai T, Eto K, Sasaki T, et al. J. Antibiot. 2002, 55, 873-880. Igarashi Y, Yu L, Miyanaga S, et al. J. Nat. Prod. 2010, 73, 1943-1946. Igarashi Y, Yu L, Ikeda M, et al. J. Nat. Prod. 2012, 75, 986-990. Yu L, Oikawa T, Kitani S, et al. J. Antibiot. 2014, 65, 345-347. Yu L, Trujillo ME, Miyanaga S, et al. J. Nat. Prod. 2014, 77, 976-982. Ben Faust. Modern Chemical Techniques : An Essential Reference for Students and Teachers. 1997. Shen B. Curr. Opin. Chem. Biol. 2003, 7, 285-295. Staunton J, Weissman K. J. Nat. Prod. Rep. 2001, 18, 380-416. Dalby SM, Paterson I. Curr. Opin. Drug. Devel. 2010, 13, 777-794. Jenke-Kodama H, Dittmann E. Nat. Prod. Rep. 2009, 26, 874-883. Van Lanen SG, Shen B. Curr. Opin. Drug. Devel. 2008, 11, 186-195. Donadio S, Monciardini P, Sosio M. Nat. Prod. Rep. 2007, 24, 1073-1109. Challis GL. J. Med. Chem. 2008, 51, 2618-2628. Bode HB, Müller R. Angew. Chem. Int. Ed. 2005, 44, 6828-6846. Gross H. Appl. Microbiol. Biotechnol. 2007, 75, 267-277. Didelot X, Bowden R, Wilson DJ, et al. Nat. Rev. Genet. 2012, 13, 601-612. Blin K, Medema MH, Kazempour D, et al. Nucleic Acids Res. 2013, 41, W204-212. Boddy CN. J. Ind. Microbiol. Biotechnol. 2014, 41, 443-450. Maksimov MO, Link AJ. J. Ind. Microbiol. Biotechnol. 2014, 41, 333-344.. 15.
(20) 16.
(21) CHAPTER 2. Akaeolide, a Carbocyclic Polyketide from Marine-Derived Streptomyces sp. NPS554. 17.
(22) 2-1 Background Because of the declining efficiency in terrestrial microbial metabolite research in recent years, marine is attracting more attention for a vast reservoir of biological and chemical diversity than ever.1 In particular, marine Streptomyces, widely spread in oceanic ecosystems, has been recognized as an emerging source of new bioactive compounds.2 In this study, a set of marine-derived actinomycetes supplied by Nippon Suisan Kaisha Ltd. was used to verify the first hypothesis that new species produce new compounds. These strains have relatively low 16S rRNA gene sequence similarity to known species, thereby being defined as a potential producer of new chemical entities as discussed in Chapter 1 (Table 2-1). Table 2-1. Strains provided by Nippon Suisan Kaisha Ltd. with low gene similarity (<98%). 16S rDNA similarity (%). strain. collection site. year. 92 92 94 96 96 96 96 96 96 96 97 97 97 97 97 97 97 97 97 97 97 97 97 97 97 97 97. Thermomonospora sp. NPS595 Thermomonospora sp. NPS954 Sacchropolyspora sp. NPS2051 Sacchropolyspora sp. NPS569 Streptomyces sp. NPS568 Streptomyces sp. NPS857 Streptomyces sp. NPS601 Streptomyces sp. NPS2057 Streptomyces sp. NPS643 Streptomyces sp. NPS2059 Streptomyces sp. NPS553 Streptomyces sp. NPS561 Streptomyces sp. NPS562 Streptomyces sp. NPS554 Streptomyces sp. NPS606 Streptomyces sp. NPS544 Gordonia sp. NPS641 Nonomuraea sp. NPS642 Streptomyces sp. NPS610 Actinomodura sp. NPS664 Streptomyces sp. NPS644 Nocardiopsis sp. NPS640 Pseudonocardia sp. NPS639 Nonomuraea sp. NPS2070 Sacchropolyspora sp. NPS2072 Nocardiopsis sp. NPS887 Catellatospora sp. NPS2073. Kochi, -28 m Kochi, -28 m Kochi, -20 m Kochi (sediment) Kochi, -3 m Kochi, -18 m Kochi, -23 m Fukui, -9 m Kochi, -18 m Fukui, -13 m Nobeoka, -38 m Okinawa (sponge) Nobeoka, -16 m Nobeoka, -38 m Nobeoka, -20 m Kochi, -15 m Kochi, -17 m Kochi (sponge) Ehime (sponge) Kochi, -13 m Fukui, -11 m Kochi, -20 m Kochi, -2 m Kochi, -21 m Kochi (sponge) Kochi, -26 m Kagoshima, -52 m. 2007 2007 2007 2006 2007 2007 2007 2007 2007 2007 2006 2006 2006 2006 2006 2007 2007 2007 2007 2007 2007 2007 2007 2007 2007 2007 2007. 18.
(23) In this study, I designed the screening program to use HPLC/UV-based spectroscopic analysis targeted to structurally novel type I PKS products produced from a group of bacterial species.3-5 From the actinomycete strains listed in Table 2-1, Streptomyces sp. NPS554 was thus selected as a candidate strain through spectroscopic screening using HPLC/DAD (diode array detector) analysis in combination with our in-house UV database dereplication (Figure 2-1). This strain was originally isolated from a sediment sample collected at a depth of 38 m near Miyazaki Harbor (previously known as Akae Harbor), Miyazaki, Japan. In the solvent extract of strain NPS554 cultured in A16 medium, three distinguishable peaks were detected at 9.2 min, 16.1 min, and 23.4 min (Figure 2-2). The UV-vis spectrum of each peak showed absorption maximum at 242 nm for 9.2 min peak, 330 nm for 16.1 min peak, and 240 nm for 23.4 min peak (Figure 2-3). It is already known that this strain produces lorneic acids A and B, linear polyketides bearing a benzene ring (Figure 2-4).6 According to the UV spectral comparison and LC/MS analysis, the peak at 23.4 min was assigned as lorneic acid A.. Figure 2-1. Streptomyces sp. NPS554 growing on Bn-2 medium.. mAU. 23.4 min. 254 nm 290 nm. 1200. MeCN (%) 80. 1000. 70. 800. 60. 600. 50. 400. 9.2 min. 40. 16.1 min. 30. 200. 20 0 0. 5. 10. 15. 20. 25. Figure 2-2. HPLC analysis of crude extract of strain NPS554.. 19. 30 min.
(24) a). b). *DAD1, 9.215 (260 mAU, - ) Ref=4.408 & 9.675 of 041-0201.D. *DAD1, 16.122 (766 mAU, - ) Ref=9.808 & 18.928 of 041-0201.D. mAU 250. mAU. 200. 600. 700. 500 150 400 300. 100. 200 50 100 0. 0 250. c). 300. 350. 400. 450. 500. 550. nm. 550. nm. 250. 300. 350. 400. 450. 500. 550. nm. *DAD1, 23.328 (1480 mAU, - ) Ref=20.568 & 26.462 of 041-0201.D. mAU 1400 1200 1000 800 600 400 200 0 250. 300. 350. 400. 450. 500. Figure 2-3. UV spectrum of the peak at a) 9.2 min; b) 16.1 min; c) 23.4 min.. Figure 2-4. Structures of lorneic acids A and B. Of the two unknown components with UV absorption maximum at 242 nm (9.2 min) and 330 nm (16.1 min), both of which are not present in our in-house natural product database, the compound with UV absorption at 330 nm was proposed to have a polyene structure while the one at 242 nm could possibly be a polyketide derived from type I PKS, as discussed in Chapter 1. Therefore, I selected the compound with UV absorption maximum at 242 nm as my target compound. The extract was subjected to HPLC/UV-guided purification which resulted in the isolation of akaeolide (1), a carbocyclic polyketide with novel carbon framework (Figure 2-5). In this chapter, the isolation, structure determination, and biological activity of 1 are described.. Figure 2-5. Structure of akaeolide (1).. 20.
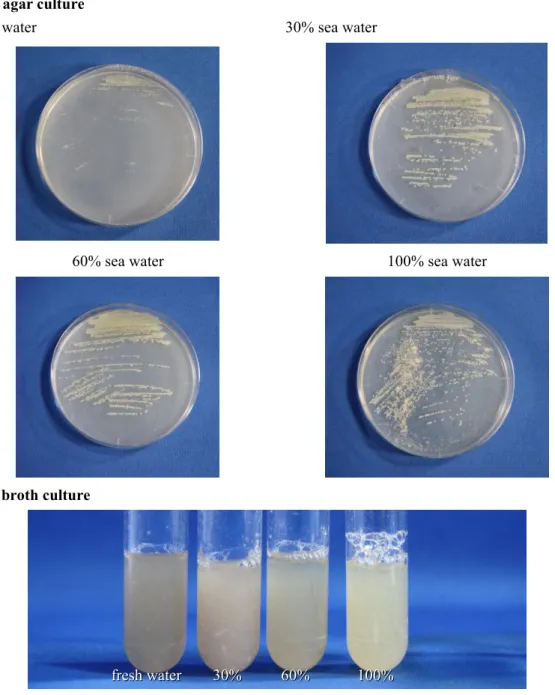
(25) 2-2 Results and Discussion 2-2-1 Fermentation and Isolation Since Streptomyces sp. NPS554 was isolated from marine environment, it was first tested by mediums with different salt concentration to acquire the best culture condition. Bn-2 medium was used for solid agar cultivation, and V-22 was used for broth. Both mediums were prepared by different concentration of sea water, including 0%, 30%, 60%, and 100%, and the photos were taken after 72 hours for agar culture and 48 hours for liquid culture (Figure 2-6). This strain grew well in all mediums with no obvious difference in growing speed or appearance according to salinity, except for Bn-2 fresh water agar medium culture, which showed slower growing speed than the other three. Bn-2 agar culture fresh water. 30% sea water. 60% sea water. 100% sea water. V-22 broth culture. fresh water. 30%. 60%. 100%. Figure 2-6. The growth of Streptomyces sp. NPS554 in different medium. 21.
(26) To check the production under different salinity, Streptomyces sp. NPS554 was cultured in A-16 medium prepared by fresh water and sea water respectively. The BuOH extract of the culture was analyzed by HPLC (Figure 2-7), which indicates that the production of this strain is more active in the medium prepared by sea water than fresh water. Considering the growth and product conditions, in the following experiments of this study, all mediums were prepared by sea water.. cultured in A-16 fresh water medium. 5. 0. 10. 15. 20. 25. 30. min. cultured in A-16 sea water medium. 0. 5. 15. 10. 20. 30 min. 25. Figure 2-7. HPLC results of products from strain NPS554 cultured in different salinity. (detection at 254 nm wavelength) main culture A16, sea water. BuOH extract silica gel chromatography (CHCl3/MeOH). 1:0. 20:1. 10:1. 4:1. 2:1. ODS chromatography (MeCN / %0.1 HCO2H buffer). 2:8. 3:7. 4:6. 5:5. 6:4. 7:3. 8:2. HPLC purification 5C18-AR-II 10×25 mm (MeCN / %0.1 HCO2H buffer) Akaeolide (3~4 mg/L). Scheme 2-1. Isolation of akaeolide. 22. 1:1. 0:1.
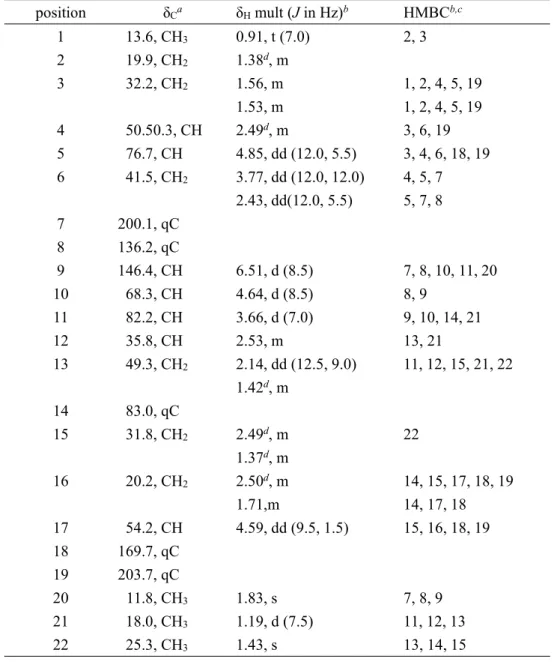
(27) To screen for new compounds from Streptomyces sp. NPS554, it was first seed cultured in V-22 medium and then be transferred into A-16M medium for production. The whole culture broth was extracted with 1-butanol and the crude extract was subjected to silica gel and ODS column chromatography. The HPLC purification gave akaeolide (1) with the yield of 3~4 mg from 1 L culture (Scheme 2-1). 2-2-2 Structure Determination of Akaeolide 2-2-2-1 Planar Structure Akaeolide (1) was isolated as an optically active colorless solid ([α]D +33, c 0.10, CHCl3). The molecular formula of 1 was determined as C22H32O6 by high-resolution ESITOFMS analysis that showed a pseudomolecular ion at m/z 391.2127 [M-H]- (Δ +0.1 mmu, calcd for C22H31O6). The existence of carbonyl groups were confirmed by IR spectrum, which displayed the absorption bands at 1712 and 1660 cm-1. An absorption band of bathochromic shift at 393 nm was observed on the UV spectrum measured in alkaline solution but not in acidic or neutral solution, suggesting the presence of a phenolic or enolic functional group.7 From the 1H and 13C NMR spectra along with the HSQC analysis, the presence of 22 carbons were confirmed, which accounts for three oxygen-bearing quaternary sp2 carbons, one quaternary sp2 carbon, one sp2 methine, one oxygenated quaternary sp3 carbon, six sp3 methylene, six sp3 methine (three are oxygenenated), and four methyl groups. The degree of unsaturation was calculated as seven, whereas three carbonyls and one C-C double bond accounted four equivalently. Therefore 1 must possess three rings to satisfy the molecular formula. Interpretation of 2D NMR spectroscopic data allowed the assemble of three partial structures: a β-keto-δ-lactone, an α,β-unsaturated ketone, and a tetrahydrofuran unit (Figure 2-8, Table 2-2). A four-carbon fragment, deduced from a series of COSY correlations from the methyl proton triplet H-1 to a methine H-4, was joined with an another COSY-defined fragment H-5/H-6 by HMBC correlations from H-5 and H-6 to C-4, H-4 to C-6, and H-3 to C-5 to provide a six-carbon fragment with an oxygen substitution at C-5. A COSY-cross peak was observed between H-15 and H-16, and the latter protons were further correlated to H-17. This three-carbon fragment was expanded to include two carbonyl carbons C-18 (δC 169.7) and C-19 (δC 203.7), each connecting at C-17 on the basis of HMBC correlations from H-16 and H-17 to these carbons. This fragment and the aforementioned six-carbon fragment were joined on the basis of HMBC correlations from H-5 to C-18 and H-5 and H-3 to C-19, establishing a β-keto-δ-lactone substructure bearing three aliphatic substituents.. Figure 2-8. COSY and key HMBC correlations for 1. 23.
(28) Table 2-2. 1H and 13C NMR Data for Akaeolide (1) in CDCl3. position. δCa. 1 2 3. 13.6, CH3 19.9, CH2 32.2, CH2. 4 5 6. 50.50.3, CH 76.7, CH 41.5, CH2. 7 8 9 10 11 12 13. 200.1, qC 136.2, qC 146.4, CH 68.3, CH 82.2, CH 35.8, CH 49.3, CH2. 14 15. 83.0, qC 31.8, CH2. 16. 20.2, CH2. 17 18 19 20 21 22. 54.2, CH 169.7, qC 203.7, qC 11.8, CH3 18.0, CH3 25.3, CH3. δH mult (J in Hz)b. HMBCb,c. 0.91, t (7.0) 1.38d, m 1.56, m 1.53, m 2.49d, m 4.85, dd (12.0, 5.5) 3.77, dd (12.0, 12.0) 2.43, dd(12.0, 5.5). 2, 3. 6.51, d (8.5) 4.64, d (8.5) 3.66, d (7.0) 2.53, m 2.14, dd (12.5, 9.0) 1.42d, m. 7, 8, 10, 11, 20 8, 9 9, 10, 14, 21 13, 21 11, 12, 15, 21, 22. 2.49d, m 1.37d, m 2.50d, m 1.71,m 4.59, dd (9.5, 1.5). 22. 1.83, s 1.19, d (7.5) 1.43, s. 7, 8, 9 11, 12, 13 13, 14, 15. 1, 2, 4, 5, 19 1, 2, 4, 5, 19 3, 6, 19 3, 4, 6, 18, 19 4, 5, 7 5, 7, 8. 14, 15, 17, 18, 19 14, 17, 18 15, 16, 18, 19. a. Recorded at 125 MHz. Recorded at 500 MHz. c HMBC correlations are from proton(s) stated to the indicated carbon. d Overlapping signals. b. Structure elucidation of the second partial structure was started from the vinylic methyl proton singlet H-20 that showed HMBC correlations to the carbonyl carbon C-7 (δC 200.1) and olefinic carbons C-8 and C-9. The proton attached to this latter carbon C-9 showed a COSY correlation to the oxymethine proton H-10, establishing this partial structure as an α,β-unsaturated ketone with a methyl and an oxygenated methine substitutions at the α- and β-positions, respectively. An HMBC correlation from H-6 to C-7 allowed this fragment to be connected to the δ-lactone unit through C-6. The tetrahydrofuran unit was elucidated starting from the tertiary methyl proton singlet (H-22) that showed HMBC correlations to C-13, C-14, and C-15. The proton attached to C-13 showed a COSY correlation to a methine proton H-12, which was in turn correlated to a methyl proton 24.
(29) doublet (H-21) and an oxygenated methine (H-11). Finally, an HMBC correlation from H-11 to C-14 established a tetrahydrofuran ring being connected to the δ-lactone unit at C-15. Further HMBC correlations observed from H-10 and H-11 to C-9 and from the olefinic proton attached to this carbon back to C-10 and C-11 completed the structure assignment of 1. The planar structure of 1 revealed that the methine proton H-17 flanked by two carbonyl carbons can be dissociated giving the enolized isomer. This explains that the 1H NMR spectrum of 1 in CDCl3 displayed the resonances for at least three distinct isomers, and during the overnight NMR measurement at 27 ˚C, these isomers converged into one dominant isomer although small peaks for minor isomers were still remaining (Figure S1). Further detailed analysis on tautomerizaion using NMR revealed that the enol-form was the major isomer in pyridine-d5 (Figure 2-9). In fact more than three isomers were recognized in the 1H and 13C-NMR spectra of 1. In addition to the two keto-enol tautomers defined in this study, other isomeric forms possibly including conformational isomers may exist.. Figure 2-9. Structures of dominant tautomers of akaeolide (1) in CDCl3 and pyridine-d5. 2-2-2-2 Absolute Configuration In order to establish the relative configuration of 1, crystallization was attempted in various solvents but failed to give crystalline solid. As the tautomeric characteristic of this molecule was likely affecting negatively the crystal formation, the configuration of the enolizable carbon C-17 was fixed by chlorinating this carbon by the treatment with N-chlorosuccinimide in CH2Cl2.8,9 The reaction completed in 10 min at room temperature to give a derivative (2) selectively chlorinated at C-17 as a single product. After purification by flash chromatography, 2 was crystallized from a mixture of diisopropyl ether and methanol to give plate crystals suitable to X-ray crystallographic analysis. On the basis of the diffraction anisotropy of the chlorine atom the absolute configurations of all seven asymmetric centers in 2 were determined as 4R, 5R, 10R, 11R, 12S, 14S, 17R, defining the absolute configuration of 1 except for the chlorinated carbon C-17 (Figures 2-10 and 2-11).. Figure 2-10. Chlorination of akaeolide (1) to yield 17-chloroakaeolide (2). 25.
(30) Figure 2-11. ORTEP drawing of crystal structure of 2. The relative configuration at C-17 of 1 in CDCl3 was determined by analyzing NOESY spectrum that gave cross peaks for H-17/H-6 (δH 3.77), H-17/H-9, H-6 (δH 3.77)/H-9. These correlations allowed the placement of the H-17 methine proton and the carbon chain branched at C-5 on the same side of the δ-lactone ring, establishing the C-17 configuration of 1 as R (Figure 2-12).. Figure 2-12. Key NOEs observed for 1 in CDCl3.. Figure 2-13. Structures of macquarimicin, cochleamycin, and lankacidin.. 26.
(31) Akaeolide (1) is featured by its 15-membered carbocyclic structure functionalized with a five-membered cyclic ether and a β-keto-δ-lactone unit. As I searched for structurally related compounds of 1 in SciFinder database, mangromicin B was found to have a similar planar structure with compound 1, which is recorded in a patent.10 However, according to the opposite optical rotation (mangromicin B: [α]D -24, c 0.1, MeOH vs 1: [α]D +35, c 0.1, MeOH) and different NMR spectral data of mangromicin B, I concluded that akaeolide and mangromicin B are different compounds. Besides mangromicin B, only limited number of carbocyclic polyketide compounds were reported to have a β-keto-δ-lactone unit in their structures, including macquarimicin, cochleamycin, FR182877, and lankacidin (Figure 2-13).11-15 These compounds might have a close biosynthetic relationship to 1. 2-2-3 Bioactivity Limited biological testing has shown that 1 is active against Micrococcus luteus with an MIC value of 25 μg/mL but is inactive to Escherichia coli and Candida albicans. In addition, 1 displayed modest cytotoxicity to 3Y1 rat fibroblasts with an IC50 value of 8.5 ± 1.5 μM. 1 was not active in adipocyte differentiation assay16 and also did not show inhibitory effects on Staphylococcus aureus and Enterococcus faecalis quorum sensing signaling.17. 2-3 Experimental Section General experimental procedures. Optical rotation was measured using a JASCO DIP-3000 polarimeter. UV spectrum was recorded on a Hitachi U-3210 spectrophotometer. IR spectrum was measured on a Perkin Elmer Spectrum 100. NMR spectra were obtained on a Bruker AVANCE 500 spectrometer, using the signals of the residual solvent protons (δ 7.26 for CDCl3; δ 7.22 for pyridine-d5) and carbons (δ 77.0 for CDCl3; δ 123.9 for pyridine-d5) as internal standards. High-resolution ESITOFMS was recorded on a Bruker microTOF focus. X-ray crystallographic analysis was performed on a Rigaku VariMax-DW with RAPID system. Silica gel 60-C18 (Nakalai Tesque 250-350 mesh) was used for ODS column chromatography. HPLC separation was performed using a Cosmosil 5C18-AR-II (Nacalai Tesque Inc., 20 × 250 mm) with a photodiode array detector. Isolation of akaeolide (1). Strain NPS554 cultured on a Bn-2 slant [soluble starch 0.5%, glucose 0.5%, meat extract (Kyokuto Pharmaceutical Industrial Co., Ltd.) 0.1%, yeast extract (Difco Laboratories) 0.1%, NZ-case (Wako Chemicals USA, Inc.) 0.2%, NaCl 0.2%, CaCO3 0.1%, agar 1.5%] was inoculated into 500 mL K-1 flasks each containing 100 mL of the V-22 seed medium consisting of soluble starch 1%, glucose 0.5%, NZ-case 0.3%, yeast extract 0.2%, Tryptone (Difco Laboratories) 0.5%, K2HPO4 0.1%, MgSO4·7H2O 0.05%, and CaCO3 0.3% (pH 7.0) in natural seawater. The flasks were placed on a rotary shaker (200 rpm) at 30 ˚C for 4 days. The seed culture (3 mL) was transferred into 500 mL K-1 flasks each containing 100 mL of the A-16 production medium consisting of glucose 2%, Pharmamedia (Traders Protein) 1%, and CaCO3 0.5% in natural seawater. The inoculated flasks were placed on a rotary shaker (200 rpm) at 30 ˚C for 6 days. At the end of the fermentation period, 100 mL of 1-butanol was added to each flask, 27.
(32) and the flasks were allowed to shake for 1 h. The mixture was centrifuged at 5000 rpm for 10 min, and the organic layer was separated from the aqueous layer containing the mycelium. Evaporation of the solvent gave 7.6 g of extract from 2.3 L of culture. The crude extract (7.6 g) was subjected to silica gel column chromatography with a step gradient of CHCl3/MeOH (1:0, 20:1, 10:1, 4:1, 2:1, 1:1, and 0:1 v/v). Fraction 2 (CHCl3/MeOH = 20:1) was concentrated to provide 0.22 g of brown solid, which was further purified by repeated reverse phase preparative HPLC using a Cosmosil 5C18-AR-II column (Nacalai Tesque Inc., 10 × 250 mm) with MeCN in 0.1% HCO2H (35:65, flow rate 4 mL/min), followed by evaporation and extraction with EtOAc to give akaeolide (1, 9.7 mg, tR = 19.7 min). HPLC analysis condition for broth extract. Instrument: Agilent HP-1100 HPLC system Column: Microsorb-MVTM (Rainin Instrument Company Inc.) C-18 3 μm (4.6 × 75 mm) Solvent: MeCN-0.15% KH2PO4 buffer (pH 3.5) MeCN: 0-3 min: 15-15%, 3-6 min: 15-40%, 6-12 min: 40-40%, 12-19 min: 40-45%, 19-22 min: 45-85%, 22-29 min: 85-85%, 29-32 min: 85-15% Flow rate: 1.2 mL/min Absorbance read by photodiode array detector at 200-600 nm Akaeolide (1): colorless amorphous solid; [α]D23 +35 (c 0.10, MeOH); [α]D22 +33 (c 0.10, CHCl3); UV (MeOH) λmax (log ε) 234 (4.61), 283 (4.31) nm; (0.01 N HCl-MeOH) 235 (4.62); (0.01 N NaOH-MeOH) 234 (4.54), 283 (4.61), 393 (4.32); IR (ATR) νmax 1712, 1660 cm-1; For 1H and 13C NMR data, see Table 1; high-resolution ESITOFMS m/z 391.2127 [M-H]- (calcd for C22H31O6, m/z 391.2126). Chlorination of 1 to yield 17-chloroakaeolide (2). To a solution of 1 (5.2 mg, 13.3 μmol) in CH2Cl2 (1 mL) were added 2,6-lutidine (0.82 μL, 7.1 μmol) and N-chlorosuccinimide (3.6 mg, 26.8 μmol) at room temperature. After stirring for 2 h, the reaction mixture was diluted with diethyl ether (2.5 mL) and washed with sat. NaCl solution (1 mL). The organic layer was separated and concentrated in vacuo to give 5.8 mg of crude residue. Purification by silica gel chromatography (n-hexane/EtOAc = 10:1~1:1) yielded 17-chloroakaeolide (2, 2.2 mg, 39% yield) as a white powder. A portion of 2 was recrystallized from a mixture of CH2Cl2 and diisopropyl ether to afford plate crystals for X-ray crystallographic analysis. 17-Chloroakaeolide (2): colorless plates; mp >150 ˚C (dec); [α]D22 -118 (c 0.10, MeOH); UV (MeOH) λmax (log ε) 235 (3.77) nm; IR νmax 3459, 1722 cm-1; for 1H and 13C NMR data, see Table S2; high-resolution ESITOFMS m/z 449.1701 [M+Na]+ (calcd for C22H31O635ClNa, m/z 449.1701). Antimicrobial assay. Antimicrobial assay was carried out according to the procedures previously described.18 Cytotoxicity evaluation. The cytotoxicity of 1 against 3Y1 rat embryonic fibroblasts was evaluated by a microculture-scale colorimetric assay using 3-(4,5-dimethylthiazol-2-yl)-2,5diphenyltetrazolium bromide (MTT) as a bioreduction dye. Cells were maintained in a 5% 28.
(33) CO2-95% air atmosphere at 37 ˚C in low glucose-type (1 g/L) Dulbecco’s modified Eagle medium (DMEM) supplemented with 10%v/v fetal bovine serum, 584 mg/L L-glutamine, 20 mg/mL gentamycin sulfate, and 105 unit/L penicillin, 100 mg/L streptomycin sulfate, and 250 μg/L amphotericin B. To each well of a 96-well culture plate was seeded a 100 μL of cell suspension prepared at a density of 6 × 10³ cells/mL. After 24 h-incubation to settle the cells, serial half-log dilutions of drugs in DMEM medium were made in a separate culture plate, and 100 μL aliquots from this were added to the microcultures in triplicate. Along with 1 was tested doxorubicin hydrochloride as a positive control and dilutions of vehicle (DMSO) in DMEM as a negative control. After 72 h-incubation, 100 μL of 1 mg/mL MTT solution in PBS without Ca2+ and Mg2+ was added to each well, and the culture were incubated for 4 h. Medium was then removed by aspiration and dyed cells were solubilized with 100 μL DMSO to measure the absorbance of the solution at 540 nm. The IC50 value was deduced by fitting a regression curve on growth inhibitory ratios plotted along the axis of logarithmic drug concentration.. 29.
(34) References 1 Debbab A, Aly AH, Lin WH. Microb. Biotechnol. 2010, 3, 544-563. 2 Manivasagan P, Venkatesan J, Sivakumar K, et al. Microbial. Res. 2014, 169, 262-278. 3 Igarashi Y, Yu L, Miyanaga S, et al. J. Nat. Prod. 2010, 73, 1943-1946. 4 Igarashi Y, Kim Y, In Y, et al. Org. Lett. 2010, 12, 3402-3405. 5 Igarashi Y, Asano D, Furihata K, et al. Tetrahedron Lett. 2012, 53, 654-656. 6 Iwata F, Sato S, Mukai T, et al. J. Nat. Prod. 2009, 72, 2046-2048. 7 Silverstein RM, Bassler GC, Morrill TC. Spectrometric Identification of Organic Compounds, 5th ed. John Wiley & Sons, Inc.:New York, 1991. 8 Rahn N, Kalesse M. Angew. Chem. Int. Ed. 2008, 47, 597-599. 9 Hoffman, RV, Weiner WS, Maslouh N. J. Org. Chem. 2001, 66, 5790-5795. 10 Omura S, Takahashi Y, Nakashima T, et al. Patent WO2013031239 A8. Dec 12, 2013. 11 Hochlowski JE, Mullally MM, Henry R, et al. J. Antibiot. 1995, 48, 467-470. 12 Shindo K, Matsuoka M, Kawai H. J. Antibiot. 1996, 49, 241-243. 13 Shindo K, Iijima H, Kawai H. J. Antibiot. 1996, 49, 244-248. 14 Sato B, Muramatsu H, Miyauchi M, et al. J. Antibiot. 2000, 53, 123-130. 15 Uramoto M, Otake N, Ogawa Y, et al. Tetrahedron Lett. 1969, 2249-2254. 16 Kunimasa K, Kuranuki S, Matsuura N, et al. Med. Chem. Lett. 2009, 19, 2062-2064. 17 Desouky SE, Nishiguchi K, Zendo T, et al. Biosci. Biotechnol. Biochem. 2013, 77, 923-927. 18 Igarashi Y, Yu L, Miyanaga S, et al. J. Nat. Prod. 2010, 73, 1943-1946.. 30.
(35) 2-4 Spectral Data Table of Contents Table S1. NMR data for akaeolide (1) (pyridine-d5) Table S2. NMR data for 17-chloroakaeolide (2) (CDCl3) Figure S1. 1H NMR Spectrum of Akaeolide (1) at 500 MHz in CDCl3 Figure S2. 13C NMR Spectrum of Akaeolide (1) at 125 MHz in CDCl3 Figure S3. 1H-1H COSY Spectrum of Akaeolide (1) at 500 MHz in CDCl3 Figure S4. HSQC Spectrum of Akaeolide (1) at 500 MHz in CDCl3 Figure S5. HMBC Spectrum of Akaeolide (1) at 500 MHz in CDCl3 Figure S6. NOESY Spectrum of Akaeolide (1) at 500 MHz in CDCl3 Figure S7. 1H NMR Spectrum of Akaeolide (1) at 500 MHz in pyridine-d5. Figure S8. 13C NMR Spectrum of Akaeolide (1) at 125 MHz in pyridine-d5 Figure S9. 1H-1H COSY Spectrum of Akaeolide (1) at 500 MHz in pyridine-d5 Figure S10. HSQC Spectrum of Akaeolide (1) at 500 MHz in pyridine-d5 Figure S11. HMBC Spectrum of Akaeolide (1) at 500 MHz in pyridine-d5 Figure S12. NOESY Spectrum of Akaeolide (1) at 500 MHz in pyridine-d5. Figure S13. UV Spectra of Akaeolide (1) Figure S14. IR Spectrum of Akaeolide (1) Figure S15. 1H NMR Spectrum of Chloroakaeolide (2) at 500 MHz in CDCl3 Figure S16. 13C NMR Spectrum of Chloroakaeolide (2) at 125 MHz in CDCl3 Figure S17. 1H-1H COSY Spectrum of Chloroakaeolide (2) at 500 MHz in CDCl3 Figure S18. HSQC Spectrum of Chloroakaeolide (2) at 500 MHz in CDCl3 Figure S19. HMBC Spectrum of Chloroakaeolide (2) at 500 MHz in CDCl3 Figure S20. NOESY Spectrum of Chloroakaeolide (2) at 500 MHz in CDCl3. 31.
(36) Table S1. NMR data for akaeolide (1) (pyridine-d5) position. δCa. 1 2. 14.3, CH3 20.3, CH2. 3 4 5 6. 35.8, CH2 43.3, CH 77.0, CH 43.2, CH2. 7 8 9 10 11 12 13. 203.7, qC 134.2, qC 150.5, CH 69.6, CH 84.0, CH 36.8, CH 50.1, CH2. 14 15. 81.5, qC 33.9, CH2. 16. 20.6, CH2. 17 18 19 20 21 22. 104.0, qC 165.8d, qC 165.8d, qC 12.3, CH3 17.1, CH3 25.6, CH3. δH mult (J in Hz)b. HMBCb,c. 0.66, t (7.3) 1.35, m 1.19, m 1.68, m 2.58e, m 4.93, dd (11.7, 4.8) 4.33, dd (11.6, 11.7) 2.31, dd (11.6, 4.8). 2, 3 1 1 2, 4, 5 2, 3, 6 3, 4, 6, 18, 19 4, 5, 7 5, 7, 8. 7.28, dd (8.4, 0.7) 4.96, d (8.4) 4.20, dd (8.3, 1.4) 2.64e, m 2.04, dd (11.9, 8.1) 1.62e, m. 7, 20 8, 9 10, 21 13, 14, 21 11, 12, 15, 21 12, 14, 15, 21, 22. 3.13, ddd (13.3, 13.0, 3.0) 1.47e, m 3.43, ddd (13.0, 12.6, 3.2) 2.62e, m. 14, 17 16, 17 14, 17, 18, 19 14, 15, 17, 18, 19. 2.08, d (0.7) 1.48, d (7.1) 1.62, s. 7, 8, 9 11, 12, 13 13, 14, 15. a. Recorded at 125 MHz, referenced to the solvent carbon (123.9 ppm). Recorded at 500 MHz, referenced to the residual solvent proton (7.22 ppm). c HMBC correlations are from proton(s) stated to the indicated carbon. d Interchangeable. e Overlapping signals. b. 32.
(37) Table S2. NMR data for 17-chloroakaeolide (2) (CDCl3) position. δCa. 1 2. 14.3d, CH3 18.7, CH2. 3. 28.6, CH2. 4 5 6. 46.6, CH 75.2, CH 43.2, CH2. 7 8 9 10 11 12 13. 202.9, qC 138.7, qC 140.4, CH 68.8, CH 83.9, CH 34.5, CH 48.9, CH2. 14 15. 82.8, qC 34.5, CH2. 16. 29.8, CH2. 17 18 19 20 21 22. 104.0, qC 164.3, qC 196.2, qC 14.3d, CH3 14.3d, CH3 24.9, CH3. δH mult (J in Hz)b. HMBCb,c. 0.95, t (7.3) 1.34, m 1.29, m 1.93, m 1.62, m 2.81, m 5.00, ddd (10.8, 5.1, 3.1) 3.31, dd (14.6, 3.1) 2.79, dd (14.6, 5.1). 2, 3. 5.78, dd (6.2, 1.3) 4.41, br.t (7.3) 3.79, d (8.9) 2.57, m 1.82, dd (12.2, 7.5) 1.48, dd (12.2, 12.0). 7, 20. 2.42, m 1.42, ddd (14.6, 5.6, 3.6) 3.08, ddd (14.7, 11.2, 5.6) 2.27, ddd (14.7, 6.1, 3.6). 14, 16 17 15, 17, 18, 19 14, 15, 17, 19. 1.98, s 1.17, d (7.0) 1.19, s. 7, 8, 9 11, 12, 13 13, 14, 15. a. 2, 3, 5, 6, 19 7 4, 5, 7 7, 8, 18. 10, 12, 13, 14, 21 11, 12, 14, 15 12, 14, 15, 21, 22. Recorded at 125 MHz, referenced to the solvent carbon (123.9 ppm). Recorded at 500 MHz, referenced to the residual solvent proton (7.22 ppm). c HMBC correlations are from proton(s) stated to the indicated carbon. d Interchangeable. b. 33.
(38) Figure S1. 1H NMR Spectrum of Akaeolide (1) at 500 MHz in CDCl3. 7.5. 7.0. 6.5. 6.0. 5.5. 5.0. 4.5. 4.0. 3.5. 34. 3.0. 2.5. 2.0. 1.5. 1.0. 0.5. 0.0. ppm.
(39) Figure S2. 13C NMR Spectrum of Akaeolide (1) at 125 MHz in CDCl3. 200. 190. 180. 170. 160. 150. 140. 130. 120. 110. 100. 35. 90. 80. 70. 60. 50. 40. 30. 20. 10. ppm.
(40) Figure S3. 1H-1H COSY Spectrum of Akaeolide (1) at 500 MHz in CDCl3. ppm 0.5. 1.0. 1.5. 2.0. 2.5. 3.0. 3.5. 4.0. 4.5. 5.0. 5.5. 6.0. 6.5. 7.0. 6.5. 6.0. 5.5. 5.0. 4.5. 4.0. 3.5. 36. 3.0. 2.5. 2.0. 1.5. 1.0. 0.5. 7.0 ppm.
(41) Figure S4. HSQC Spectrum of Akaeolide (1) at 500 MHz in CDCl3. ppm. 20. 40. 60. 80. 100. 120. 140. 160. 180. 200. 7.0. 6.5. 6.0. 5.5. 5.0. 4.5. 4.0. 3.5. 37. 3.0. 2.5. 2.0. 1.5. 1.0. 0.5. ppm.
(42) Figure S5. HMBC Spectrum of Akaeolide (1) at 500 MHz in CDCl3. ppm 0. 20. 40. 60. 80. 100. 120. 140. 160. 180. 200. 7.0. 6.5. 6.0. 5.5. 5.0. 4.5. 4.0. 3.5. 38. 3.0. 2.5. 2.0. 1.5. 1.0. 0.5. ppm.
(43) Figure S6. NOESY Spectrum of Akaeolide (1) at 500 MHz in CDCl3. ppm 0.5. 1.0. 1.5. 2.0. 2.5. 3.0. 3.5. 4.0. 4.5. 5.0. 5.5. 6.0. 6.5. 7.0. 6.5. 6.0. 5.5. 5.0. 4.5. 4.0. 3.5. 39. 3.0. 2.5. 2.0. 1.5. 1.0. 0.5. 7.0 ppm.
(44) Figure S7. 1H NMR Spectrum of Akaeolide (1) at 500 MHz in pyridine-d5. 8.5. 8.0. 7.5. 7.0. 6.5. 6.0. 5.5. 5.0. 4.5. 40. 4.0. 3.5. 3.0. 2.5. 2.0. 1.5. 1.0. 0.5. ppm.
(45) Figure S8. 13C NMR Spectrum of Akaeolide (1) at 125 MHz in pyridine-d5. 200. 190. 180. 170. 160. 150. 140. 130. 120. 110. 100. 41. 90. 80. 70. 60. 50. 40. 30. 20. 10. ppm.
(46) Figure S9. 1H-1H COSY Spectrum of Akaeolide (1) at 500 MHz in pyridine-d5. ppm. 0.5 1.0 1.5 2.0 2.5 3.0 3.5 4.0 4.5 5.0 5.5 6.0 6.5 7.0 7.5 8.0 8.5. 9.0. 8.5. 8.0. 7.5. 7.0. 6.5. 6.0. 5.5. 5.0. 4.5. 42. 4.0. 3.5. 3.0. 2.5. 2.0. 1.5. 1.0. 0.5. 9.0 ppm.
(47) Figure S10. HSQC Spectrum of Akaeolide (1) at 500 MHz in pyridine-d5. ppm. 20. 40. 60. 80. 100. 120. 140. 160. 180. 200. 9.0. 8.5. 8.0. 7.5. 7.0. 6.5. 6.0. 5.5. 5.0. 4.5. 43. 4.0. 3.5. 3.0. 2.5. 2.0. 1.5. 1.0. 0.5. ppm.
(48) Figure S11. HMBC Spectrum of Akaeolide (1) at 500 MHz in pyridine-d5. ppm. 20. 40. 60. 80. 100. 120. 140. 160. 180. 200. 9.0. 8.5. 8.0. 7.5. 7.0. 6.5. 6.0. 5.5. 5.0. 4.5. 44. 4.0. 3.5. 3.0. 2.5. 2.0. 1.5. 1.0. 0.5. ppm.
(49) Figure S12. NOESY Spectrum of Akaeolide (1) at 500 MHz in pyridine-d5. ppm. 0.5 1.0 1.5 2.0 2.5 3.0 3.5 4.0 4.5 5.0 5.5 6.0 6.5 7.0 7.5 8.0 8.5. 9.0. 8.5. 8.0. 7.5. 7.0. 6.5. 6.0. 5.5. 5.0. 4.5. 45. 4.0. 3.5. 3.0. 2.5. 2.0. 1.5. 1.0. 0.5. 9.0 ppm.
(50) Figure S13. UV Spectra of Akaeolide (1) (A) MeOH. (B) 0.01N HCl-MeOH. (C) 0.01N NaOH-MeOH. 46.
(51) Figure S14. IR Spectrum of Akaeolide (1) 100.0. 98. 96. 94. 92. 90. 88. 86. 84. 82. %T. 80. 78. 76. 74. 72. 70. 68. 66. 64. 62. 60.0 4000.0. 3600. 3200. 2800. 2400. 2000. 1800 cm-1. 47. 1600. 1400. 1200. 1000. 800. 650.0.
(52) Figure S15. 1H NMR Spectrum of Chloroakaeolide (2) at 500 MHz in CDCl3. 6.5. 6.0. 5.5. 5.0. 4.5. 4.0. 3.5. 48. 3.0. 2.5. 2.0. 1.5. 1.0. 0.5 ppm.
(53) Figure S16. 13C NMR Spectrum of Chloroakaeolide (2) at 125 MHz in CDCl3. 200. 190. 180. 170. 160. 150. 140. 130. 120. 110. 100. 49. 90. 80. 70. 60. 50. 40. 30. 20. 10. ppm.
(54) Figure S17. 1H-1H COSY Spectrum of Chloroakaeolide (2) at 500 MHz in CDCl3. ppm 0.5. 1.0. 1.5. 2.0. 2.5. 3.0. 3.5. 4.0. 4.5. 5.0. 5.5. 6.0. 6.5. 7.0. 6.5. 6.0. 5.5. 5.0. 4.5. 4.0. 3.5. 50. 3.0. 2.5. 2.0. 1.5. 1.0. 0.5. 7.0 ppm.
(55) Figure S18. HSQC Spectrum of Chloroakaeolide (2) at 500 MHz in CDCl3. ppm. 20. 40. 60. 80. 100. 120. 140. 160. 180. 200. 7.0. 6.5. 6.0. 5.5. 5.0. 4.5. 4.0. 3.5. 51. 3.0. 2.5. 2.0. 1.5. 1.0. 0.5. ppm.
(56) Figure S19. HMBC Spectrum of Chloroakaeolide (2) at 500 MHz in CDCl3. ppm. 20. 40. 60. 80. 100. 120. 140. 160. 180. 200. 7.0. 6.5. 6.0. 5.5. 5.0. 4.5. 4.0. 3.5. 52. 3.0. 2.5. 2.0. 1.5. 1.0. 0.5. ppm.
(57) Figure S20. NOESY Spectrum of Chloroakaeolide (2) at 500 MHz in CDCl3. ppm 0.5. 1.0. 1.5. 2.0. 2.5. 3.0. 3.5. 4.0. 4.5. 5.0. 5.5. 6.0. 6.5. 7.0. 6.5. 6.0. 5.5. 5.0. 4.5. 4.0. 3.5. 53. 3.0. 2.5. 2.0. 1.5. 1.0. 0.5. 7.0 ppm.
(58) 54.
(59) CHAPTER 3. Biosynthesis of Akaeolide and Lorneic Acids and Annotation of Type I Polyketide Synthase Gene Clusters in the Genome of Streptomyces sp. NPS554. 55.
(60) 3-1 Background As described in Chapter 2, Streptomyces sp. NPS554 is capable to produce two types of polyketides: akaeolide (1) and lorneic acids. Both of these compounds are structurally specific. Akaeolide (1) is featured by its 15-membered carbocyclic structure functionalized with a five-membered cyclic ether and a β-keto-δ-lactone unit. Usually, in macrolide-type polyketide compounds, the carbon chain is cyclized through an ester bond to form a ring structure (Figure 3-1). However, in akaeolide (1), the ring system is composed only by carbon atoms, which is quite uncommon in polyketides. Only several compounds might have close biosynthetic relationships to 1, including lankacidin,1 cochleamycin,2,3 and macquarimicin.4 In lankacidin biosynthesis, the polyketide chain extension begins from a glycine-derived C-18/C-17 unit and ends with the terminating propionate unit C-19/C-2/C-1 (Figure 3-2). The C-C bond between C-2 and C-18 is thought to be formed by a nucleophilic addition of the activated methine carbon C-2 to the N-acyl imine carbon C-18 with the catalysis of an amine oxidase.5 Biosynthetic origin of cochleamycin was elucidated by incorporation of 13C-labeled precursors.6 Starting from the C-5/C-6 acetate unit, the chain extension terminates with a C-4/C-3 acetate unit accompanied by the δ-lactone formation. The additional C-C bond formation is proposed to arise from the oxidation of C-5 methyl carbon to the aldehyde and the following intramolecular aldol reaction (Figure 3-3). However, unlike lankacidin, this biosynthetic pathway is not supported by any enzymatic or genomic evidence. Similar to these biosynthetic pathways, an extra C-C bond formation must take place for the construction of the macrocyclic structure of 1 in addition to the regular C-C bond formation by PKS.. Figure 3-1. Biosynthesis of deoxyerythronolide-B-synthase (DEBS) required for erythromycin as an example of a macrolide type I PKS.. 56.
(61) Figure 3-2. Proposed biosynthetic pathway of lankacidin.. Figure 3-3. Proposed biosynthetic pathway of cochleamycin. Lorneic acid A (3) is structurally characterized by a linear fatty acid chain bearing a benzene ring in the middle of the structure. Only limited natural products are known to have such molecular architecture, including lorneic acids B, C and D, lorneamides A and B, and BE52211 analogs (Figure 3-4).21,22 Although there are many polyketides bearing aromatic rings, most of them are found in type II PKSs (Figure 3-5). Even for the type I PKS compounds bearing aromatic ring, their resources are only known from starter units with aromatic ring, but not directly synthesized by PKS. Therefore, the compounds like lorneic acids (Figure 3-4) are biosynthetically special type I PKS. Since both akaeolide (1) and lorneic acid A (3) have biosynthetically unique features and their biosynthesis remains unknown, I next attempted to elucidate the biosynthetic pathway of these two types of polyketides.. 57.
(62) Figure 3-4. Structures of lorneic acids C and D, lorneamide A and B, and BE52211 analogs.. Figure 3-5. Aromatic rings synthesized by type II PKS.. 3-2 Results and Discussion 3-2-1 Incorporation of 13C-Labeled Precursors Inspection of the carbon connectivity and the position of carbon branches suggested that 1 was synthesized through the polyketide pathway. In order to elucidate the biosynthetic origin and incorporation pattern, strain NPS554 was cultured in the presence of plausible biosynthetic precursors labeled with carbon-13, namely [1-13C]acetate, [2-13C]acetate, and [1-13C]propionate, 58.
(63) which could be incorporated into the polyketide backbone via acyl CoA carboxylation (Scheme 3-1). According to the previous study described in Chapter 2, 1 exists as a mixture of several tautomeric isomers in NMR solvents caused by the enolization at C-17, consequently giving multiple 13C signals for each carbon. This was undesirable to the quantification of carbon intensity; therefore, the purified 13C-labeled 1 was converted to the chlorinated derivative 2 which could not undergo isomerization (Figure 2-9). main culture. 13C-labeled. precursors. (200 mg/L) × 4 times. 2nd day 3nd day 4nd day 5nd day. extraction and isolation (7nd day). Scheme 3-1. Feeding culture with 13C-labeled precursors. The relative enrichment of each carbon by the incorporation of 13C-labeled precursors was determined by 13C NMR measurement (Table 3-1). Enrichments at C-5, C-9, C-15, C-18, and C-19 were observed by the feeding of [1-13C]acetate while C-3, C-7, C-11, and C-13 were highly enriched by [1-13C]propionate feeding (Table 6, Figures S1 and S2). C-12 and C-15 were overlapped at 34.7 ppm in the 13C NMR spectrum, but the signal enhancement was ascribed to the incorporation of [1-13C]acetate into C-15 because the three-carbon fragment C-21/C-12/C-11 was derived from a propionate as proven by [1-13C]propionate incorporation into C-11 (Figure 3-6).. Figure 3-6. Incorporation of 13C-labeled precursors into akaeolide (1). C-16 and C-17 were labeled by [2-13C]acetate and C-15 and C-18 by [1-13C]acetate (Figure 3-6). This labeling pattern is inconsistent with normal polyketide chain elongation but could be explained by incorporation of succinate, which can be labeled by 13C-labeled acetates in TCA cycle (Figure 3-7).7,8. 59.
(64) Table 3-1. Incorporation of 13C-labeled precursors into 17-chloroakaeolide (2). Position. δC. Relative Enrichmentsα [1-13C]-acetate. [2-13C]-acetate [1-13C]-propionate. 1. 14.5. 1.0. 0.9. 0.8. 2. 19.0. 1.0. 1.0. 1.0. 3. 28.8. 1.0. 1.7. 32.9. 4. 46.8. 1.0. 4.4. 1.0. 5. 75.4. 5.0. 1.1. 0.8. 6. 43.5. 1.1. 4.8. 0.9. 7. 203.1. 1.2. 2.1. 40.3. 8. 138.9. 0.9. 0.8. 0.6. 9. 140.6. 4.6. 1.0. 0.8. 10. 69.0. 1.0. 4.5. 0.6. 11. 84.1. 1.0. 1.6. 30.2. 12. 34.7. 2.9. 1.0. 0.9. 13. 49.1. 1.0. 1.6. 31.6. 14. 83.1. 1.0. 0.9. 0.9. 15. 34.7. 2.9. 1.0. 0.9. 16. 30.1. 1.0. 4.3. 1.0. 17. 63.7. 1.0. 3.8. 1.1. 18. 164.5. 4.8. 0.9. 0.8. 19. 196.4. 4.4. 1.0. 1.1. 20. 14.5. 1.0. 0.9. 0.8. 21. 25.1. 1.0. 0.8. 1.0. 22. 14.6. 1.0. 0.9. 0.8. α 13C. signal intensity of each peak in the labeled 17-chloroakaeolide divided by that of the corresponding signal in the unlabeled, normalized to give an enrichment ratio of 17-chloroakaeolide for enriched peak. The numbers in bold type indicate 13C-enriched atoms from 13C-labeled precursors.. 60.
(65) Figure 3-7. Acetate-labeled succinic acid incorporation into polyketide. Table 3-2. Incorporation of 13C-labeled precursors into lorneic acid A (3). Position. δC. relative enrichmentsα [1-13C]-acetate. [1-13C]-propionate. 1. 177.7. 7.3. 0.9. 2. 38.3. 1.0. 1.0. 3. 121.8. 6.7. 1.0. 4. 131.9. 1.0. 1.0. 5. 131.7. 6.5. 0.8. 6. 126.4. 1.0. 1.0. 7. 127.8. 1.0. 42.6. 8. 137.3. 0.9. 0.7. 9. 127.0. 6.5. 1.1. 10. 136.1. 0.8. 0.8. 11. 127.4. 6.1. 1.1. 12. 133.7. 0.9. 1.0. 13. 33.0. 6.4. 1.1. 14. 31.6. 1.0. 1.0. 15. 22.3. 6.3. 1.0. 16. 13.9. 1.0. 1.0. 17. 21.2. 1.0. 1.0. α 13. C signal intensity of each peak in the labeled lorneic acid A divided by that of the corresponding signal in the unlabeled, normalized to give an enrichment ratio of lorneic acid A for enriched peak. The numbers in bold type indicate 13C-enriched atoms from 13C-labeled precursors.. 61.
図


+7


関連したドキュメント
We believe it will prove to be useful both for the user of critical point theorems and for further development of the theory, namely for quick proofs (and in some cases improvement)
Keywords: continuous time random walk, Brownian motion, collision time, skew Young tableaux, tandem queue.. AMS 2000 Subject Classification: Primary:
Variational iteration method is a powerful and efficient technique in finding exact and approximate solutions for one-dimensional fractional hyperbolic partial differential equations..
This paper presents an investigation into the mechanics of this specific problem and develops an analytical approach that accounts for the effects of geometrical and material data on
Since weak convergence is preserved by continuous mappings, the weak convergence in H α provides weak convergence results for H 0 α -continuous functionals of paths and for some
While conducting an experiment regarding fetal move- ments as a result of Pulsed Wave Doppler (PWD) ultrasound, [8] we encountered the severe artifacts in the acquired image2.
., which were found to be optimal for free clusters, those confined in a circle, and, as we will see below, are optimal for those confined in a hexagon; (ii) triangular numbers, of
Actually it can be seen that all the characterizations of A ≤ ∗ B listed in Theorem 2.1 have singular value analogies in the general case..
