Influence of El Nino/La Nina events on Autumn
Rainy Season in Japan
著者
TAKAHASHI Nobuto
雑誌名
The science reports of the Tohoku University.
7th series, Geography
巻
54
号
1/2
ページ
49-63
発行年
2005
URL
http://hdl.handle.net/10097/45267
49
Influence of El Niiio/La
Nina events
on Autumn Rainy Season in Japan
Nobuto TAKAHASHI*
Abstract Though the factor of the year-to-year variation of autumn frontal activity in Japan has been investigated, its relation to El Nino/La Nina events is almost unknown. Here we show the characteristics of the frontal activity in the autumn rainy season, so-called the Akisame, and their factors during El Nitio/La Nina events.
Using the frontal frequency data during August to November for the 22-year period 1979-2000, we perform the composite analysis of frontal frequency during El Nino/La Nina years, which are defined by using Nino-3.4 index. We find the areas where the frontal frequency is strongly influenced by El Nino/La Nina events are different in each event. During El Nino years (1982, 1987, 1991, and 1997) the frontal frequency in the peak of the Akisame (pentads 52-56 , September 13-October 7) is lower along 130°E, while it is higher along 140°E during La Nifia years (1988, 1998, and 1999). In the post-Akisame (pentads 61-65, October 28-November 21), the frontal frequency tends to persist in the south of Japan during La Nina years.
We conclude these characteristics of the frontal frequency are closely relation to the circulation patterns at 850hPa during El Nifio/La Nina years . The circulation patterns at 850hPa abruptly change in the end of the Akisame near pentad 60 (October 23-27) during El Nino/La Nina years . These circula-tion changes from the Akisame to the winter are inferred to be relation to the tendency of the cool summer and the warm winter during El Nino years and the hot summer and the cold winter during La Nina years.
Key words : Akisame, autumn rainy season in Japan, frontal frequency , El Nino/La Nina events, composite analysis
1. Introduction
The autumn rainy season in Japan (September-October), so-called the Akisame, is one of the major rainy seasons as well as the Baiu (June-July). The rainfall is mainly caused by the stationary fronts around south coast of Japan (Sekiguti and Tamiya,
* Department of Urban Engineering
, University of Tokyo, 7-3-1 113-8656, Japan
Science Reports of Tohoku University, 7th Series (Geography) Vol. 54, Nos. 1/2, 2005, 49-63
1968). Most important vapor transport for the rainfall near Japan is accomplished by the southeasterly, which flows anticyclonically around the Pacific high in the lower troposphere (Murakami et. al, 1962). Matsumoto (1984) also pointed out that south-easterly is dominant over Japan in September.
As for the year-to-year variation of the Akisame, the zonal variation of the southeasterly at 850 hPa has a strong effect on the Akisame (Takahashi, 2003). Takahashi (2003) also reported that such a southeasterly is closely related to the typhoon activities influenced by the sea surface temperature (SST) in the western tropical Pacific. Therefore, the conditions of the Pacific high and the SST in western tropical Pacific are supposed to be very important for the year-to-year variation of the Akisame.
On the other hand, the atmospheric condition in the western tropical Pacific is strongly connected with El Nitio/La Nina events. Several workers (Nishimori and Yoshino, 1990 ; Lander, 1993 ; Chen et. al, 1998 ; Wang and Chan, 2002 etc.) also showed that the averaged locations of typhoon formation tend to shift southeastward in El Nirio years and northwestward in La Nina years.
From these previous researches, it seems that there are some effects of El Nino/ La Nina events on the Akisame. Therefore, it is very important to reveal the relationship between the Akisame and El Nino/La Nina events, because El Nino/La Nina events are the oceanic phenomena and a useful indicator of the long-range forecast.
In this study, we intend to clarify the characteristics of frontal activities and their factors in the Akisame during El Nino/La Nina years. Our investigation is performed utilizing the frontal frequency data as an indicator of the Akisame.
2. Data Arrangement and Definition of El Nifio/La Niria Years
In order to make the frontal frequency data, the twice-daily surface weather maps published by Japan Meteorological Agency from August to November for the period 1979-2000 were utilized. The frontal frequencies are counted by every pentad and 10° x grid over the East Asia from 110°E to 160'E between 20'N and 50°N. These are defined as the percentage of the occurrence. For the purpose of investigating the circulation pattern over Asia region, the pentad average 850hPa geopotential height extracted from the National Centers for Environmental Prediction-National Center for Atmospheric Research (NCEP-NCAR) reanalysis data (www.cdc.noaa.gov/cdc/ reanalysis) are utilized. Nino-3.4 index (SST anomalies (SSTA) in the region of 5'S-TN, 120°E-170°W, see Fig. 1) are extracted online at the Climate Prediction Center Web site (www.cpc.ncep.noaa.gov/data/indices/) in order to define El Nino/La Nina years. This index is better correlated with the overall typhoon activity in the western
Influence of El Nino/La Nina events on Autumn Rainy Season in Japan 51
20°N
cp
0'
-CT)
20°S
120EFig. I. Nino regions in Nino-3.4 region is Nino-1+2, Nino-3, respectively. 150E the tropical closed by the and Nino-4
180°
150W
120W
90W
60W
longitude
Pacific.black solid line in the east-central Pacific Ocean.
region are also closed by the gray dashed line,
3 g2 1 0 -1 -2 -3 E 1980 1982 1984 1986 1988 1990 1992 1994 1996 Apr. Apr. Apr. Apr. Apr. Apr. Apr. Apr. Apr.
year
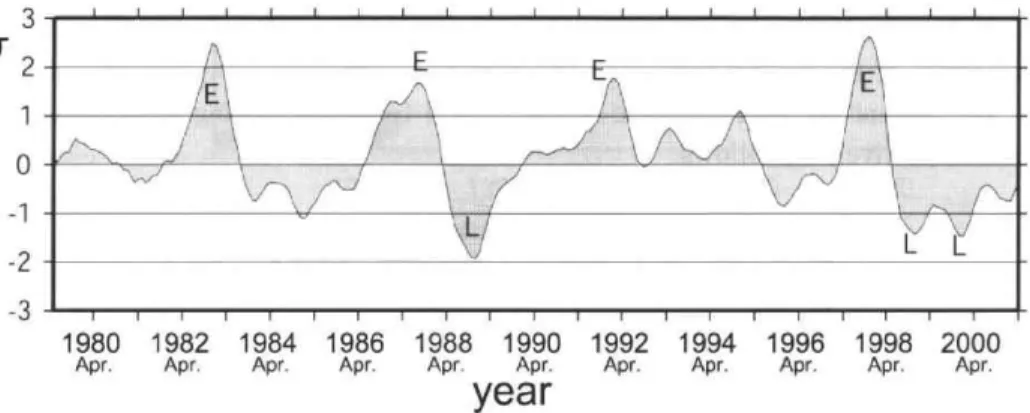
Fig. 2. Time series of Nino-3.4 index.
A simple 5-months running mean filter is applied. Character "E" and
Nino year and La Nina year respectively.
1998 2000 Apr. Apr.
"L" denote El
tropical Pacific (Wang and Chan, 2002). Therefore, this index is a proper indicator for this study because the typhoon activity is also related to the Akisame closely (Takaha-shi, 2003). Fig. 2 shows the time-series of the 5-months running mean Nino-3.4 index from 1979 to 2000. In this study, the El Nino (La Nina) years are defined as the year when index shows more than +1.0o- (less than —1.0a). As a result, 1982, 1987, 1991, and 1997 are defined as the El Nino years, and 1988, 1998, and 1999 are defined as the La Nina years.
3. Characteristics of Frontal Frequency in Akisame during El Nitio/La Nina Years
Takahashi(2003) defined the term of the Akisame as pentads 50-90 (September 3-October 22) and showed the peak of the Akisame is pentads 52-56 (September 13-October 7) using the frontal frequency data. Therefore, in order to identify the difference of the frontal frequency between El Nino and La Nina years, we investigat-ed three characteristics of the frontal frequency as follows : the distribution of the frontal frequency during the peak of the Akisame (pentads 52-56, September 13-October 8), the time-series of the 3-pentads running mean frequency during pentads 45-65 (August 9-November 21), and the time-series of the position of the frontal zone, which is defined as the latitude where the highest frequency is seen in the 5-pentad x 3° filtered frequency.
Fig. 3 shows the distribution of the 22-year averaged frontal frequency. As in Fig. 3, we set seven regions along 130°E and 140°E (130B, 130C, 130D, 140A, 140B, 140C, and 140D) to cover the high frequency areas around the southern coast of Japan. The time-series of the frontal frequency are averaged in these regions respectively.
We present the characteristic of the frontal frequency during El Nifio/La Nina years respectively as follows.
50
40
Es 30
20 ° 4azi, , 130B , 130C e, 20—1130D1
0 4 20 140B 140C [140D1 10 110 120 130 140 150 160longitude
(°E)
Fig. 3. Distribution of frontal frequency (%) during the peak of the Akisame (pentads
56, September 13-October 7) in 22-year average and seven regions where the
series analyses are performed. contour interval : 5%.
(130B: 33'N-36'N, 130'E ; 130C: 29'N-32'N, 130'E ; 130D: 25'N-28'N, 130*E ; 140A :
37'N-40'N, 140'E ; 140B: 33°N-36'N, 140'E ; 140B: 28'N-31'N, 140'E ; 140D:
28'N, 140'E)
Influence of El Nifio/La Nina events on Autumn Rainy Season in Japan 53
3.1. El Nino years
a. Distribution of Frontal Frequency
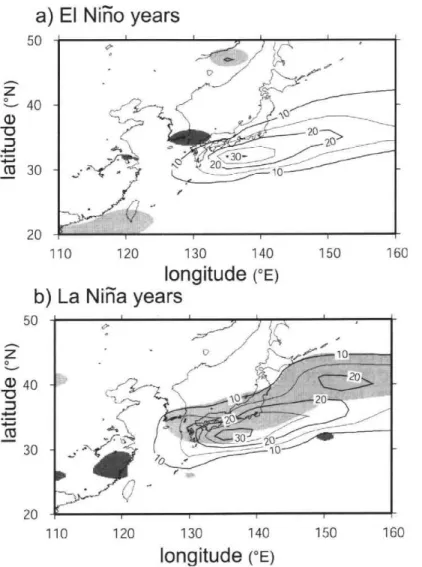
Fig. 4a shows the distribution of the frontal frequency and anomaly averaged for the four El Nino years (1982, 1987, 1991, and 1997). Areas where a positive anomaly is more than +4% and a negative anomaly is less than —4% are shaded the light gray and the dark gray respectively.
a)
50El Nil%
years
2-- 40 a) -c) CD 30 20 • ,7777..., \C) • IV• - 30 - , 20 10-r 30 120 130longitude
NiFia years
20 20 110b)
50La
140(°E)
150 1602
40 CD 30 20 ° ..e 'L
iir.,..._...,.„...„.
fl,...1..._-,--;;^- -4".1--,.._'-"O..---. AO_ 2_0_,:_-____---10 7 0. 1 0.7,...,7' 20 110 120 130 140 150 160
longitude
(°E)
Fig. 4. Same as Fig. 3 except for a) in the four El Nino years average or b) in the three
La Nina years average.
Areas where a positive anomaly is more than +4% and a negative anomaly is less
than —4% are shaded the light gray and the dark gray respectively.
contour interval : 5%.
We can see the negative anomaly area around the Tsushima Island. This area is corresponding to the north side of the high frontal frequency. This means the frontal activity is limited to the region in the south than usual. On the other hand, the positive anomaly areas are located in the region of —25°N, 110°E-125°E and the region of 4T N-48°N, 135°E-140°E. However, these positive anomalies seem to be not important because the frontal frequencies are small in these regions.
b. Time-series of Frontal Frequency
Fig. 5 displays the time-series of the frontal frequency in the seven regions (see Fig. 3) from pentads 45-65 (August 9-November 21). The thin black line, the bold black line, and the bold gray line denote the time-series of the frontal frequency in 22-year average, the four El Nino 22-year average, and the three La Nina year average respectively. The painted marks on the line such as circle and square mean the significant anomaly pentad, when the signs of anomaly in the four El Nino or the three La Nina years are all the same and the amounts of anomaly indicate more than +4% or less than —4%.
Along 130°E, we can find some continuous significant anomalies during El Nino years. In the region 130B (33°N-36°N, 130°E, see Fig. 5a), the significant negative anomalies are found during the early Akisame (pentads 50-53, September 3-22). In this region, these periods correspond to the peak of the frontal frequency on 22-year average. Moreover, in the region 130C (29°N-32°N, 130°E, see Fig. 5b), the significant negative anomalies are also observed during the late Akisame (pentads 57-60, October 8-27).
On the other hand, along 140°E, the significant anomalies are not found except for the region 140A (37°N-40°N, 140°E) during pentads 63-64 (November 7-16) (see Fig. 5d), the region 140C (29°N-32°N, 140°E) during pentad 65 (November 17-21)(see Fig. 5f), and the region 140D (25°N-28°N, 140°E) during pentad 60 (October 23-27)(see Fig. 5g). Because these significant anomalies don't continue several pentads, it is suggested that there is not large signal along 140°E during El Nino years.
This difference of the frontal frequency between along 130°E and along 140'E is correspond to the distribution of the frontal frequency during the peak of the Akisame (pentads 52-56, September 13-October 7) as shown in Fig4a.
c. Position of Frontal Zone
Fig. 6a presents the time-series of the position of frontal zone during El Nino years. It is necessary to note that more than two peaks are sometimes observed. In that case, the peak of the higher frequency is plotted in this figure. In this figure, the thin black line, the bold black line, and the bold gray line denote the position of the frontal zone in the 22-year average, four El Nino year average, and three La Niria year
Influence of El Nino/La Nina events on Autumn Rainy Season in Japan 55
22-year average --41— four El Nino year average
four El Nino year average (significant anomaly)
0 three La Nina year average
0 three La Nina year average
(significant anomaly)
a)
60 (%) 40 130B (33°d) 140A
60 (%) (37° N-40° N, 140° E) 40 20 0 a o. N-36° N, 130° E) 20 0 0a 0 0 a 45 47 49 51 53 55 57 59 61 63 65 Pentad numbere) 140B (33°
N-36° N,
140°
E)
45 47 49 51 53 55 57 59 61 63 65 Pentad numberb) 130C (29°
N-32° N,
130°
E)
60 (%) 40 20 0 0° 0 0,)4H
011, 60 (%) 40 20 0 0 0 45 47 49 51 53 55 57 59 61 63 65 Pentad numberf) 140C (29°
N-32° N,
140°
E)
a 0 o 6.0 45 47 49 51 53 55 57 59 61 63 65 Pentad numberC) 130C (25°
N-28° N,
130°
E)
60 (%) 40 20 0 II 60 (%) 40 20 0 a a. 0 7r) I 1 .' 0 ao-Ci r' I I I 06 a „74303,e.0,.tra el I I I I 45 47 49 51 53 55 57 59 61 63 65 45 47 49 51 53 55 57 59 61 63 65Pentad number Pentad nu mber
Fig. 5. Time-series of the frontal frequency (%) in the regions
A simple 3-pentads running mean filter is applied. Solid, bold black, and bold gray lines denote the frequency in the 22-year average, the four EI Nino year average, and
the three La Nina year average respectively. Painted marks such as ^ or • on the
line mean that signs of anomaly are the same in all the El Nino/La Nina years and
the amounts of anomaly from 22-year average indicate more than +4% or less
than —4%. 45 47 49 51 P53 55 57 59 61 63 65 entad number
g) 140D (25°
N-28° N,
140°
E)
60 I (%) I I 20 40 a046:2011
a . . 45 47 49 51 53 55 57 59 61 63 65 Pentad nu mber (%) in the regions0 a) 1:3 . -1=1 CD 45
a)
130°
E
40 35 30 25 20 22-year average—0— four El Nino year average
o three La Nina year average
0 0 0 0 a. 45 47 49 51 53 55 57 Pentad number 59 61 63 65
b)
45140°
E
0 CD 40 35 30 25 20\IL
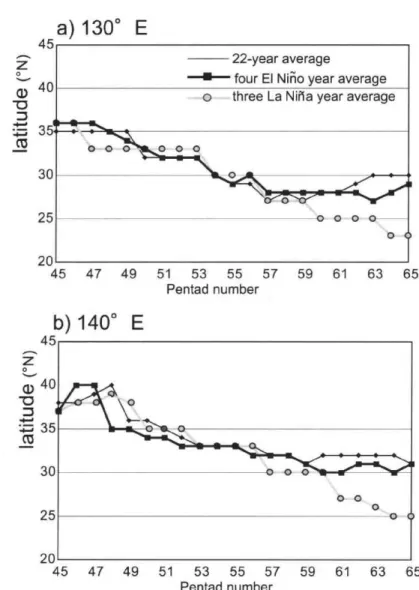
0 0 0 0 0 45 47 49 51 53 55 57 59 61 63 65 Pentad numberFig. 6. Time-series of the position of frontal zone along a) 130'E and b) 140'E.
Position of the frontal zone is defined as the latitude where the highest value emerges
on the 5-pentads x latitude filtered frequency. Solid, bold black, and bold gray
lines denote the frequency in the 22-year average, the four El Nino year average, and
the three La Nina year average respectively.
average respectively. As for El Nino years, we can't fin tics of the position of the frontal zone.
Influence of El Nino/La Nina events on Autumn Rainy Season in Japan 57
3.2. La Nifia years
a. Distribution of Frontal Frequency
Fig. 4b shows the distribution of the frontal frequency in 3-La Nina year average. The positive anomaly area is found all over Japan and the frontal frequency is larger than usual in this region. We can also point out that this area is located to the north of the higher frontal frequency area. This means the area of the high frontal fre-quency extends to the north than usual. On the other hand, the some negative anomaly areas are seen in the west of 120°E. However, these anomalies are not important because the frontal frequency is low.
b. Time-series of Frontal Frequency
The bold gray line in Fig. 5b denotes the frontal frequency in the three La Nina year average. As already stated, the painted circle denotes the significant anomaly pentad and so we note this mark especially.
In the region 140B (33°N-36°N, 140°E, see Fig. 5d), we can find the significant positive anomalies near the peak pentad on 22-year average (pentads 53-55, September 18-October 2), while the significant negative anomalies are found before the peak pentad (pentad 50, September 3-7) and after the peak pentad (pentad 60, October 23-27). In the region 140C (29°N-32°N, 140°E, see Fig. 5e), the significant positive anomaly is also found near the peak pentad on 22-year average (pentad 59, October 17-22) and the negative anomalies are found before the peak pentad (pentad 53, September 18-22) and after the peak pentad (pentad 64, November 12-16). In the region 140D (25°N-28° N, 140°E, see Fig. 5g), the significant large positive anomalies are observed in pentads 58-59 (October 13-22) and 61-62 (October 28-November 6). These characteristics indicate that the frontal frequency is higher in the peak pentad, and the southward movement is faster than usual. Akisame is also tends to prolong than usual in the south of Japan.
In the region 130C (29°N-32°N, 130°E, see Fig. 5b), the significant positive anom-alies are seen in pentads 56-57 (October 3-12) and the significant negative anomanom-alies are found in pentads 60-61 (October 23-November 1). However, in the other regions along 130°E, we can't find the significant anomalies.
In this way, the major characteristics of the frontal frequency are especially seen in the region along I40°E during La Nina years.
c. Position of Frontal Zone
In Fig. 6, we can find that the positions of the frontal zone along 130°E and 140°E shift southward largely in the post-Akisame (pentad 61-, October 28-) during La Nina years. These tendencies are also correspond to the faster southward movement of the frontal zone than usual as shown in Fig. 5.
3.3. Comparison between El Niiio and La Nifia years
We can find two major differences between El Nino and La Nina years through comparing the characteristics of the frontal frequency.
One difference is the area where there is strongly influence by events during the Akisame. The area influenced by El Nino events strongly is the region along 130°E near Japan and the frontal frequency tends to be small, while the area influenced by La Nina events is the region along 140°E near Japan and the frequency tends to be large.
The other difference is observed in the post-Akisame (pentads 61-, October 28-). The frontal frequency during La Nina years is higher and the frontal zone moves southward than usual. For these reasons, the velocity of the southward shift of fronts is faster than usual. On the other hand, during El Nino years, the frontal frequency is low as well as usual and we can't see the particular characteristics in the post-Akisame.
From these reasons, we conclude that the difference of the frontal frequency between during El Nino and during La Nina years is striking in two seasons : the peak
of the Akisame and the post-Akisame.
4. Circulation Pattern
In this chapter, we examine the 850 hPa geopotential height field in order to clear the factors of the frontal frequency difference during El Nino/La Nina years. Because the 850 hPa geopotential height has a strong connection to the both of the frontal generation and SST, it is useful for investigating these relationships. In the western Pacific Ocean, it is well known that El Nino events are associated with negative SST anomalies, while La Nina events are associated with positive SST anomalies. These anomalous SSTs affect the atmosphere in not only tropical Pacific region but also the various places of the world. We note the characteristics of the 850 hPa geopotential height around Japan especially.
We present two figures based on the characteristics indicating in previous chapter. One is Fig. 7 showing the composite maps of the 850 hPa geopotential height and anomaly in the peak of the Akisame (pentads 52-56, September 13-October 7) and the post-Akisame (pentads 61-65, October 28-November 21) during the four El Nino years and the three La Nina years. The other figure is Fig. 8, which shows the time-latitude section of the 850hPa geopotential height and anomaly along 140°E-160'E average. In these figures, a positive anomaly area (more than +5 gpm) is shaded gray and a negative anomaly area (less than —5 gpm) is hatched.
4.1. El Nino years
Influence of El Nirio/La Nina events on Autumn Rainy Season in Japan 59 Akisame (pentads 52-56, September 13-October 7) during El Nino years. In this figure, we can see the positive anomalies around the tropical region from middle Pacific to Indian subcontinent. These anomalies also extend to the subtropical region in the west of Philippine. Such characteristics suggest that the convection is suppres-sed around the South China Sea and the southeasterly, which flows round the western edge of the Pacific high, is limited to the east in south of Japan than usual. At high latitude region, the negative anomaly is found around the Amur river basin in the north west of Japan. However, it is suggested that this anomaly is far from the frontal positions and so it is not important. From these characteristics we conclude that the decrease of frontal frequency along 130°E during El Nino years is related to the suppression of the convection around the South China Sea and the southeasterly which is limited to the east in the south of Japan.
In Fig. 7c, which is the same as Fig. 7a except for the post-Akisame (pentads a) El NiFio years (P.52-56) 850Zb) La Nina years (P.52-56)850Z
1-71/4-i,
taw."i'.:1-J,.wvilki:.i:/:-,--,.
'.,,--i-kogrogatmery-r7Ria
.t;%100,014i•--",,•',.14:"...::.1.:4411)7,,
P`'°N'''''^<44!.„tr-,'-i.IN,"/),'/'-i').-,.1-2,AV#Picetftt.
..,'sit;'fir-/
,..;.:!!.,k ,
F.,,,,,(,„r7
...-'-,...„..Aii.4,...
_,,(
bk .- .ilartiraii"i=4110
A.
',,,:::'--ta
VW----71
,- _:---''' is°' '''':!:e,,...ax'
''' ''s5,1k:-7;...iici!'
f..:
!':11-1:.5,__
----,
- --,,,-',
--_____,_-
5's
,, ..,:;•.:1!:.:th:,
:17
`Wr",____-_---
_ ,.
, lir,i .;:.,..T:7:':-.77-,,... - , , •
, ::::
....
:i ,.,.•
:._ __
,-
,0%l
.:-,t,..:::'''-:,,.,..•:;i:::4aNii._-:-.---,
...E 100120 E1..E 160.E UM 1., PrE 100,120E 1.E INC .P ..
c) El Nifio years (P.61-65) 850Z d) La Nina years (P.61-65) 850Z
'
-405**54,747411111.-''411013%,„e.1irlOgillgiOr
' ',''',!+litttAIle4A1,4/0'/;g,fliV
-Iltil**.‘',:V*-Atti•t4Wirt#1;;ii;Old.::..:1
i---''''.AVOCr1P-4'f;;11Kgiai
.#'- . G; -1,-,\4
74.1111126„,2.0.-,'fro
Ai:a;:ffe:
A 1 'Vt,,Vae tr-1-4w.V.W/
/
'
,:f•
.'''4,6trom:w
.A!.---,74(
,:tro:'-: A .
_.,_-0
. / , 2/s'
,0.,t,
,,,,,,;
. . , ...
. ; ?"/ •,,
s'
' ,,p ,„.., -, ' -,---n- +.1, - • . • .. • • .,." - , ^ 7 :4, 6rsigw,..!..,,,,- ,,,,,, ,-,414,--IffILVatiF-4::::•;.„).10'.,„
..,4,L_,:-_--2:---1-,,..1,--,,,,„::,---.'--,firp:t.:.;1
i •°'
,,
llitif;Ir777t----55,r_--_--: , ,_4,-,-__:-=,:,;---„...---1—-,
5 6NL'-''-—._1-_--7---,---_5
''Iiiiiii-4!--"'TO
JIMEssiosdiveti'
•
- .
N---,. l7
F—o
——\,—,Eits.1.1-1-'s—'—T_—
Bo, 100E
1207
1.E `160'E
.0
760'W.,0 E 100
E 120"E
1
ao
E 160.E
180
1.,
Pr:4 105 5 10 _IlEg (gpm) Fig. 7. 850 hPa geopotential height and anomaly.
a) in the peak of Akisame (pentads 52-56, September 13-October 7) during El Nino years
b) after the Akisame (pentads 61-65, October 28-November 21) during El Nino years c) in the peak of Akisame (pentads 52-56, September 13-October 7) during La Nina
years
d) after the Akisame (pentads 61-65, October 28-November 21) during La Nina years A positive anomaly area (more than +5 gpm) is shaded gray and a negative anomaly
area (less than -5 gpm) is hatched.
a) El Nifio years b) La Nina years
70 . ... 70
60-\\
7
7,?6, 744° Z5.a 40j' 50o-
1472_,
1:1) T00----"*-1..- 747 , 4• is'o 1 53 7530 • • • • (13 3 1530 —_ A53° 10 1i . 4648 50 52 54 56 58 60 62 64 66 68 70 0 46 48 50 52 54 56 58 60 62 64 66 68 70Pentad number Pentad number
...
-10 -5 5 10 (gpm)
Fig. 8. Time-latitude section of the 850 hPa geopotential height and anomaly a) during El Nino years b) during La Nina years.
A positive anomaly area (more than +5 gpm) is shaded gray and a negative anomaly area (less than — 5 gpm) is hatched.
65, October 28-November 21), we find the positive anomaly in the tropical Pacific from 80°E to 170°W. The positive anomaly is especially large from the South China Sea to the Philippine Sea and extends to Japan. Therefore, the subtropical high-pressure belt is robust in the south of Japan and the southeasterly seems to be weaker than usual.
Fig. 8a displays the time-latitude section of the 850 hPa geopotential height and anomaly along 140°E-160°E during El Nino years. We can see the positive anomaly, which is seen around the south of Japan in Fig. 7c, is gradually increased in the region of —50°N from pentad 62 (November 2-6). Consequently, this robust subtropical high-pressure belt causes a decrease of the frontal frequency in the post-Akisame.
4.2. La Nifia years
Fig. 7b is the same as Fig. 7a except for La Nina years. In this figure, the negative anomaly is found in the west of western Pacific Ocean during the peak of the Akisame, while the positive anomaly is observed in the southeast of Japan. These anomalies generate the larger zonal gradient of geopotential height and the stronger southeasterly to Japan than usual. It is suggested that this large zonal gradient induces the high frontal frequency along 140°E in the peak of the Akisame during La Nina years.
influence of El Nino/La Nina events on Autumn Rainy Season in Japan 61
negative anomaly covers Japan and the low-pressure trough extends to south of Japan. The negative anomaly is also seen in the western tropical Pacific. Therefore, the subtropical high-pressure belt is weaker than usual in the south of Japan, while it is robust in the peak of the Akisame. Thus, the southeasterly which is dominant in the peak of the Akisame is persistent until the post-Akisame. From this reason, the frontal frequency tends to be higher than usual until the post-Akisame during La Nina years. As in Fig. 8b, we can find that this anomaly pattern's change from positive to negative near the Pacific high abruptly happens near pentad 60 (October 23-27). 4.3. Comparison between El Nino and La Niiia years
It is known the major difference between El Nino and La Nina years is SSTA in the tropical Pacific Ocean. In this study, we indicated that the response of atmosphere influenced by SSTA is different between the peak of the Akisame and the post-Akisame, especially during La Nina years. Near pentad 60 (October 23-27), the positive anomaly in the south of Japan changes to the negative anomaly during La Nitia years, while the positive anomaly becomes large during El Niho years. We conclude that the characteristics of the frontal frequency have a strong relationship with the circulation patterns and transitions which are caused by SSTA during El Nino/La Nina years. These anomaly changes at 850 hPa geopotential height during El Nino (La Nina) years suggest to be correspond to the tendency of the cold (hot) summer and warm (cold) winter in Japan.
5. Conclusion
In this study, we revealed the influence of El Nino/La Niha events on the autumn rainy season in Japan, what is called the Akisame, utilizing the frontal frequency data. Major findings obtained in this study are summarized as follows :
During El Nino years, the frontal frequency along 130°E near Japan is lower than usual in the Akisame (pentads 50-59, September 3-October 22), because the develop-ment of the trough near the South China Sea is suppressed and the southeasterly is limited to the east than usual in the south of Japan. In the post-Akisame (pentads 61-65, October 28-November 21), the subtropical high-pressure belt becomes robust and the southeasterly tends to be weak. As a result, the frontal frequency is low as well as usual over Japan.
During La Nina years, the frontal frequency along 140°E near Japan is higher than usual in the peak of the Akisame (pentads 52-56, September 13-October 7). Such a high frontal frequency continues to the post-Akisame (pentads 61-65, October 28-November 21). However, the circulation patterns around Japan are different between the Akisame and the post-Akiasme. In the peak of the Akisame, the cause of high
frontal frequency is related to the robust Pacific high, which generates large zonal gradient near Philippine at 850 hPa geopotential height with the development of the trough near South China Sea. On the other hand, in the post-Akisame, the cause of high frequency is related to the persistent of the trough in the south of Japan and the
Pacific high retreats to the east than usual.
The influence of El Nino/La Nina events doesn't emerge in the same region. In El Nino years, the most influenced area is 130'E near Japan, while it is 140°E during La
Nina years.
The circulation patterns at 850 hPa geopotential height abruptly change in the end of the Akisame near pentad 60 (October 23-27) during El Nirio/La Nina years. These changes are relation to the tendency of the cool summer and the warm winter during El Nino years and the hot summer and the cold winter during La Nina years
These results suggest that the frontal frequency near Japan has a closely relation-ship with the transition of the circulation patterns influenced by El Nino/La Nina events. We infer that the change of circulation patterns from the Akisame to the winter has relationship with the air-sea interaction in the western tropical Pacific. We need clear it in the further investigation.
Acknowledgements
I would like to express great thanks to Prof. K. Sakaida at Tohoku University for his advice and
encouragement.
References (* in Japanese, ** in Japanese with English abstract)
Chen, T.C., Weng, S.P., Yamazaki, N. and Kiehne, S. (1998) : Interannual variation in the tropical cyclone formation over the Western North Pacific. Monthly Weather
Review, 126, 1080-1090.
Lander, M.A. (1993) : Anexploratory analysis of the relationship between tropical storm formation in the Western North Pacific and ENSO. Monthly Weather Review, 122, 636-651.
Matsumoto, J. (1984) : Summertime circulation patterns over Eastern Asia. ** ical Review of Japan, 57A, 137-155.
Matsumoto, J. (1988) : Large-scale features associated with the frontal zone over East Asia from late summer to autumn. Journal of the Meteorological Society of Japan,
66, 565-579.
Murakami, T., Arai, Y. and Tomatsu, K. (1962) : On the rainy season in the early autumn. ** Journal of the Meteorological Society of Japan, 40, 330-349.
Nishimori, M. and Yoshino, M. (1990) : The relationship between ENSO events and the generation, development and movement of typhoons. ** Geographical Review of Japan, 63A, 530-540.
Influence of El Nino/La Nina events on Autumn Rainy Season in Japan 63 * Geographical Review of Japan , 41A, 258-275.
Takahashi, T. (2003): Seasonal transition and year-to-year variations of the autumn rainy season in Japan. ** Geographical Review of Japan, 76A, 935-956.
Wang, B. and Chan, J.C.L. (2002): How strong ENSO events affect tropical storm activity over the Western North Pacific. Journal of Climate, 15, 1643-1658.