emotional arousal
著者
SASAKI NAOYUKI, SAKAI NOBUYUKI
journal or
publication title
Tohoku psychologica folia
volume
78
page range
34-45
year
2020-03-24
1. Graduate School of Arts & Letters, Tohoku University
Activity in the cerebral cortices accompanying emotional arousal
Feeling in our daily life is caused by several triggers. We are surrounded by numerous chemical compounds and/or physical changes in the environment. We recognize the environment with the sensory systems that are called the five senses (visual, auditory, olfactory, taste, and touch). Information recognized by them is conveyed to our brain, which processes and interprets it. In fact, the five senses not only get information of the external world but also initiate evocation of emotion in the internal world. All the senses work at the same time. Furthermore, they interact with each other and are not separated. For instance, in Perfect Sense (David, Matle, Gillian, & Kim, 2011), the sound of the violin allowed people to imagine the scents, sounds, and scenes of the forest, and produced pleasant feelings. Furthermore, people enjoy their meal based on the appearance, scents, tastes, and textures of the food. In addition, if one sense does not work properly, some people make up for the deficit with other senses. For instance, some blind people perceive the external world with their hearing instead of their eyesight (e.g., Norman & Thaler, 2019).
This study aimed to clarify the association of cortical activities with positive and negative emotions. The participants were recruited on the website. Thirty-four Japanese university students participated in an experiment where a total of 45 pictures (15 positive, 15 neutral, 15 negative) were selected from the International Affective Picture System to evoke emotions. All participants viewed the pictures. Cortical activities were recorded with functional near-infrared spectroscopy. The oxygenated (oxy-Hb) hemoglobin signal change was used as the index of cortical activities, and the mean signal change was analyzed by a one-way analysis of variance. The oxy-Hb related to positive emotion was significantly larger on some parts of the frontal and left temporal area. The oxy-Hb related to negative emotion was relatively low on some parts of the right hemisphere. The oxy-Hb was significantly larger in the occipital area regardless of the emotion. This study concludes that positive emotion is related with the left hemisphere, and that negative emotion is related with the deep part of the brain rather than the cortices. In addition, this study also concludes that the oxy-Hb signal change in the occipital area is caused by visual processing of stimuli. This study provided the clue to clarify the relation between emotion and the brain.
Key words: emotion, cortices, international affective picture system,
functional near-infrared spectroscopy
Activity in the cerebral cortices accompanying
emotional arousal
Emotions are very important in our social life. They are closely associated with impulsive behavior and depression, which are becoming a social problem in Japan, as also with lack of motivation and languidness (e.g., Ito, Murata, & Matsumi, 2012; Yamaguchi & Suzuki, 2008). Clarifying the relation between emotion and the brain will provide clues to resolve such problems.
Emotion is described in a two–dimensional space: pleasure–displeasure and degree of arousal (Russel, 1980) (Figure 1). Some emotive states, such as excitement, delight, and happiness are in the pleasure–high arousal quadrant. Pleasure, satisfaction, and relaxation are in the pleasure–low arousal quadrant. Frustration, fear, and anger are in the displeasure– high arousal quadrant. Sadness, boredom, and droopiness are in the displeasure–low arousal quadrant (Russel, 1980). The hemispheric asymmetry of the brain has been associated with emotional functions: the left hemisphere relates with positive emotion, and the right hemisphere relates with negative emotion (e. g., Harmon, Philip, & Carly, 2010; Okamoto, 2005). Further, both sides of the dorsolateral prefrontal cortices are activated by positive emotion, and the activity in the center of the prefrontal cortex is reduced by negative emotion (Yamamoto, Yanagisawa, & Tsunashima, 2013). On the other hand, other authors have reported that the right side of the medial prefrontal cortex was activated by positive emotion, and both sides of the dorsolateral prefrontal cortices were activated by negative emotion (Faten, Ian, Tony, Jamaan, & Vanessa, 2012). Another study showed the tendency of dominant activation in the left hemisphere with positive emotion, and the tendency of dominant activation on the right hemisphere with negative emotion (Plichta et al., 2011). Although there is no conclusive evidence regarding the asymmetrical pattern of the hemispheres, it still remains that emotion affects the cortical activities asymmetrically.
This study aimed to clarify the association of cortical activities with positive and negative emotional states evoked by several visual stimuli. The inconsistency of preceding studies may have been caused by lack of consideration of the arousal by stimuli. Hence, the arousal properties of stimuli were controlled in this study.
Furthermore, preceding studies adopted non-invasive brain imaging techniques, such as positron emission tomography (PET) and functional magnetic resonance imaging (fMRI). This study had adopted functional near-infrared spectroscopy (fNIRS) as a brain imaging technique. PET and fMRI have been used to measure brain activity for the past thirty years, and recently the studies using fNIRS have been increasing. Compared to other brain imaging techniques, fNIRS allows participants to move their body parts to a limited extent. This enables measurement of brain activity in conditions that are close to our daily lives. Furthermore, fNIRS is highly non-invasive and can be used repeatedly on the same participants within short intervals, because it uses only a weak near infrared light with no radioactive agents or strong magnetics. Thus, we adopted the fNIRS as a measurement tool for cortical responses to the emotional stimuli in this study.
Methods
Participants
A total of 34 undergraduate students of Iwate University (12 men, 22 women; Mage =
20.09, SD = 1.24) participated in this experiment. The participants were recruited on the website of Iwate University. All participants had 20/20 normal vision in both eyes without or with correction, and no history of mental illness. There were no participants with scores of over 65 for the State–Trait Anxiety Inventory (STAI) A–State scale (Spielberger, Gorsuch, & Lushene, 1970). All participants provided written informed consent. This experiment was designed based on the Declaration of Helsinki for Research Involving Human Subjects and was approved by the committee in Iwate University.
fNIRS System
LABNIRS FOIRE-3000 (Shimadzu Corp., Kyoto, Japan) was used to measure hemodynamic brain responses from the frontal, temporal, and occipital area of the participants’ brains. This system consists of 16 emitters and 16 detector probes, which constitute 40 channels (Ch), and monitors reflected lights every 18 ms. The head-holder was used to set the probes, which were placed 2 × 5 (Ch 1 - 13) over the frontal, 2 × 3 (Ch 14 - 20) over the left temporal, 2 × 5 (Ch 21 - 33) over the occipital, and 2 × 3 (Ch 34 - 40) over the right temporal cortex, 3 cm apart from each other. The probes were placed with reference to the International 10-20 system, and the detector, which was adjacent to Ch 7, 11, and 12 was located at Fpz. (Figure 2). To prevent body movements and artifacts, participants’ heads were placed on a chin rest during the recording. While the relative concentration changes in oxygenated hemoglobin (oxy-Hb), deoxygenated hemoglobin (deoxy-Hb), and total
hemoglobin were recorded, the oxy-Hb signal change was used as the index of brain activity because it is reportedly more sensitive to changes in regional cerebral blood flow than deoxy-Hb and total hemoglobin (Hoshi, 2003).
Stimuli
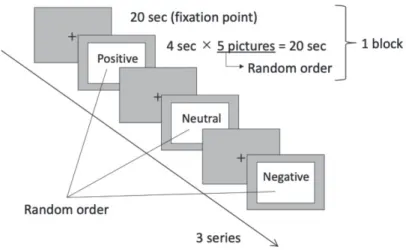
The visual stimuli, the International Affective Picture System (IAPS; Lang, Bradley, & Cuthbert, 1997), were used to evoke positive and negative emotions. A total of 45 pictures (15 positive: valence 7.0 - 8.0, 15 neutral: valence 4.5 - 5.5, 15 negative: valence 2.0 - 3.0) were selected by MATLAB (MathWorks. Mass, US) to control arousal level to approximately 5.0. These pictures were presented on a 21.5in. Iiyama ProLite E2282HS monitor (Iiyama, Co. Ltd., Tokyo, Japan) with a pixel resolution of 1,920 × 1,080. The viewing distance was 57 cm. The size of the pictures was 25°width × 20°height. The background color of the monitor was kept gray (red: 128, green: 128, blue: 128) for the task. The task consisted of three 120-s series (120s × 3). Each series was composed of three 40-s blocks (40s × 3) as positive, neutral, and negative conditions. At the beginning of each block, a fixation point was presented on the center of the monitor for 20s, then 5 of the 15 pictures which conformed to the conditions were presented for 4s per each picture (Figure 3). The order of the three conditions and the order of pictures were randomized. Each picture was presented only once.
Figure 2. The upper left is the frontal, the upper right is the left temporal, the lower left is the occipital and the lower right is the right temporal. “E” is emitter. “D” is detector. The numbers are channels. The detector which was adjacent to Ch 7, 11, and 12 was located at Fpz.
Procedure
The experiment was conducted in a quiet room with temperature maintained at 23℃ - 25℃. As a countermeasure against the effect of environment, boards colored black were set surrounding the monitor.
Participants were given explanations and instructions about the experiment. They were told that the experiment aimed to reveal the relationship between emotion and brain activity. All participants provided written approval for participation and then answered the STAI. For the experiment, participants sat approximately 57 cm away from the monitor, fitted with fNIRS probes on their head. The light in the room was turned off, and then participants gazed at the monitor. The task then began.
At the end of the task, the fNIRS probes were removed from participants’ heads. Thereafter, all pictures were presented one by one, and the participants were instructed to evaluate the valence and arousal of each picture with a five-point scale questionnaire (Figure 4). The participants were asked to select number five in scale 1 when they felt completely happy, pleased, satisfied, and hopeful in relation to the presented stimuli. On the other hand, participants were asked to select number one in scale 1 when they felt completely unhappy, annoyed, unsatisfied, and despaired in relation to the presented stimuli. Further, the participants were asked to select number five in scale 2 when they were extremely calm, relaxed, felt sleepy, and unaroused in relation to the presented stimuli. On the other hand, the participants were asked to select number one in scale 2 when they were extremely excited, activated, felt awake, and aroused in relation to the presented stimuli.
Data Analysis
For each participant, the recorded waveforms of the oxy-Hb signal were smoothed and drift correction applied. After that, the wave forms were standardized with the average
Hb on segments of 5s prior to the first stimulus. The average of oxy-Hb in 10–20s after onset of the visual stimulus was regarded as a change of oxy-Hb. Twelve regions of interest were made with four adjacent channels (ROI 1 - 12) (Figure 5). Some data of region of interest (ROI) that had too much noise, that is, +4 SD, were excluded from analysis. After that, a one-factor (emotion) analysis of variance (ANOVA) was used for each ROI and channel. The factor had three levels (positive, neutral, and negative). All statistical analyses were conducted using R ver. 3.6.0 (https://www.r-project.org/).
Figure 4. A part of the five-point scale questionnaire. The upper was scale of valence dimension. The lower was scale of arousal dimension.
Figure 5. The ROI 1–4 placed in the frontal area. The ROI 5–8 placed in the occipital area. The ROI 9 and 10 placed in the left temporal area. The ROI 11 and 12 placed in the right temporal area. “E” is the emitter. “D” is the detector. The numbers are the channels. “L”, “R”, “F”, and “B” are the initials of left, right, front, and back respectively.
Results
Evaluation of Pictures
To examine whether the visual stimuli were appropriately divided into three conditions only with valence axis, two-way ANOVAs were conducted. On evaluation of valence, the mean scores of evaluations on positive, neutral, and negative conditions were 4.13 (SD = 0.28), 2.79 (SD = 0.38), and 1.92 (SD = 0.37), respectively. Significant differences between the three conditions were confirmed (F (2, 42) = 154.5, p < .001). Post hoc analysis (Tukey’s method)
Figure 6. The horizontal axis indicates the three conditions. The vertical axis is evaluated valence values of IAPS by participants.
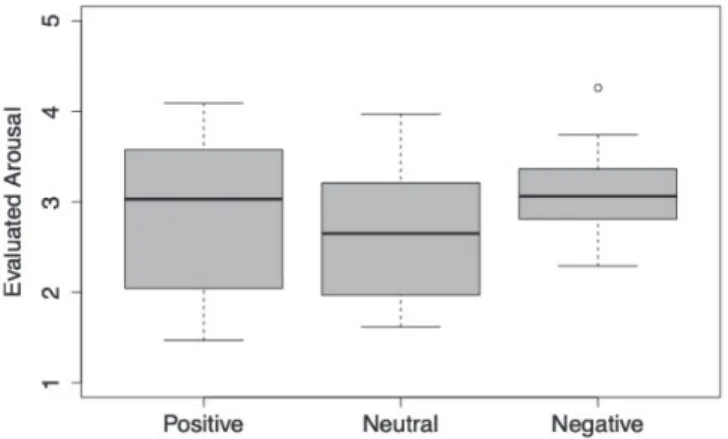
Figure 7. The horizontal axis indicates the three conditions. The vertical axis is evaluated arousal values of IAPS by participants.
revealed significant differences between all conditions (Figure 6). On arousal conditions, the mean scores of evaluations on positive, neutral, and negative conditions were 2.87 (SD = 0.91), 2.76 (SD = 0.72), 3.12 (SD = 0.49) respectively. There were no significant differences between the three conditions (F (2, 42) = 1.57, p = .22) (Figure 7).
fNIRS Data
The z-score of oxy-Hb signal changes in each ROI are illustrated in Figure 8. In the occipital area, it was observed that the oxy-Hb was larger when the stimuli were presented. On some regions of the frontal and temporal area, the differences of oxy-Hb between three conditions were observed. To examine the difference in brain activity between the three conditions, the mean signal change was analyzed by a one-way ANOVA. ANOVA revealed the significant effect of emotion on ROI 3 (F (2, 66) = 3.42, p < .05), and the tendency of differences between the three conditions on ROI 12 (F (2, 66) = 3.07, p = .053). Post hoc analysis (Tukey’s method) revealed that the change of oxy-Hb in the positive condition showed a tendency to be larger than that of the negative condition on ROI 3 (p = .053).
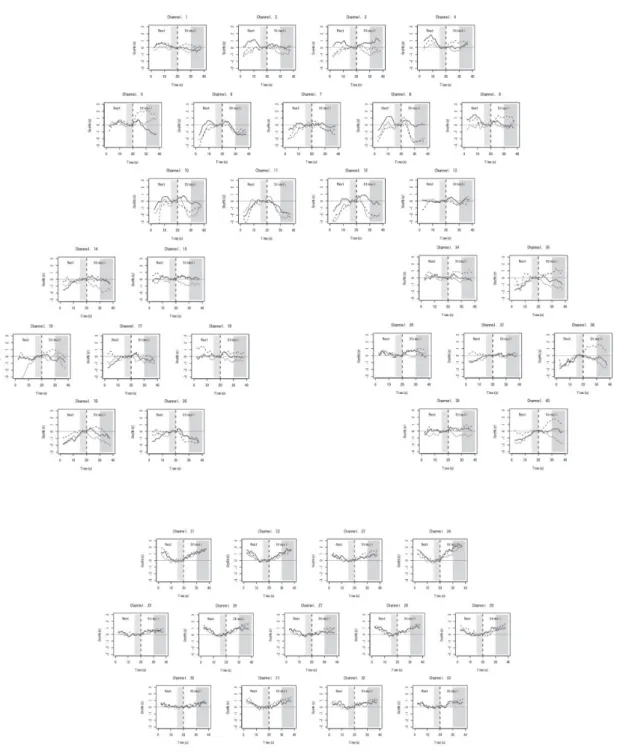
To examine the oxy-Hb signal changes in greater detail, we focused on the channels. Figure 9 illustrates the z-score of oxy-Hb signal changes in each channel. The differences
Figure 8. The oxy-Hb changes on ROI 1–12. The solid lines are in the positive condition. The dashed lines are in the neutral condition. The dotted lines are in the negative condition. The mean signal change during 10–20s after the onset of the visual stimulus was calculated and regarded as the index of brain activity.
Figure 9. The oxy-Hb signal changes on Ch 1–40. Ch 1–13 were in the frontal (the upper). Ch 14–20 were in the left temporal (the middle left). Ch 21–33 were in the occipital (the lower). Ch 34–40 were in the right temporal (the middle right). The solid lines are in the positive condition. The dashed lines are in the neutral condition. The dotted lines are in the negative condition. The mean signal change during 10–20s after the onset of the visual stimuli was calculated and regarded as the index of brain activity.
in change of oxy-Hb between the three conditions were observed on parts of the frontal, left temporal, and right temporal areas. To examine the difference of brain activity in the three conditions, like the ROIs, the mean signal change was analyzed by a one-way ANOVA. ANOVA revealed the significant effect of emotion on parts of the frontal area (Ch 3, F (2, 66) = 3.48, p < .05; Ch 5, F (2, 66) = 3.39, p < .05; Ch 8, F (2, 66) = 3.79, p < .05) and in parts of the left temporal area (Ch 14, F (2, 66) = 4.21, p < .05). ANOVA also revealed the tendency of differences among the three conditions in parts of the frontal area (Ch 12, F (2, 66) = 2.61, p = .081), in parts of the left temporal area (Ch 18, F (2, 66) = 2.56, p = .083), and in parts of the right temporal area (Ch 35, F (2, 66) = 2.80, p = .068; Ch 38, F (2, 66) = 2.92, p = .061). Post hoc analysis (Tukey’s method) revealed that the change of oxy-Hb in the positive condition was seen to be larger than that of the negative condition on Ch 3 (p < .05) and on Ch 14 (p < .05). Post hoc analysis also revealed that the change of oxy-Hb in the positive condition was seen to be larger than that of the neutral condition on Ch 8 (p < .05).
Discussion
This study aimed to clarify the relationship between cortical activities and positive– negative emotions. The results of subjective evaluation indicated that the visual stimuli were correctly divided based on three types of emotions. Further, it was suggested that the arousal properties of the visual stimuli were appropriately controlled. The fNIRS data showed that positive emotion was related to the left hemisphere.
The visual stimuli, IAPS, were evaluated based on their valence and arousal properties by all participants in this experiment. On the valence properties, the visual stimuli were divided into positive, neutral, and negative pictures. The visual stimuli were evaluated with the same values on their arousal properties. The IAPS were established as standardized visual stimuli, and their values of valence and arousal were evaluated by Lang and his colleagues (1997). The results of subjective evaluation showed that there were no statistical differences compared to the values evaluated by Lang and his colleagues. These results suggest that the visual stimuli in this experiment were adequate to evoke the emotions. Further, these results suggest that the arousal properties of the stimuli were appropriately controlled in this experiment. In addition, it is supported that the IAPS are not influenced by the difference in culture and environment, and they are available as standardized visual stimuli.
The fNIRS data showed that the oxy-Hb was significantly larger on some part of the left frontal area and the left temporal area in the positive condition. This area corresponds to the part of the dorsolateral prefrontal cortices. Some earlier studies reported the activity of left dorsolateral prefrontal cortices with positive emotion (e.g., Okamoto, 2005; Plichta et al., 2011). Furthermore, another study reported that the left dorsolateral prefrontal cortices were activated when people perceived beautiful pictures (Cela-Conde et al., 2004). Therefore, it is suggested that the oxy-Hb in the positive condition was larger because the left dorsolateral prefrontal cortices were activated. Thus, it is considered that positive emotion is related with
the left hemisphere, especially th left dorsolateral prefrontal cortices. Regarding negative emotion, fNIRS data showed that the oxy-Hb was relatively low in some part of the right hemisphere. An earlier study reported that the oxy-Hb related to negative emotion reduced in the center of the prefrontal cortices (Yamamoto et al., 2013). Negative emotion, such as fear and disgust, is closely connected with the deep area of the brain. Particularly, the amygdala is activated earlier when compared to the cortices (Nolen, Fredrickson, Loftus, & Luts, 2014). Therefore, it is suggested that the oxy-Hb in the negative condition was relatively low because the blood flowed to other activated areas, such as amygdala. Thus, it is considered that negative emotion is related with the deep area of the brain.
The fNIRS data also showed that the oxy-Hb in the occipital area was significantly larger when visual stimuli were presented. However, the differences of the oxy-Hb signal change due to the differences of emotions were not observed in this area. This area measured on this experiment corresponds to part of the visual cortices. Hence, it is considered that the oxy-Hb signal change in this area is caused by visual processing of the stimuli.
This study concludes that positive emotion is related to the left hemisphere, especially the left dorsolateral prefrontal cortices, and that negative emotion is related with the deep area of the brain rather than the cortices. However, there is a possibility that the results in this study are limited because only visual stimuli are used to evoke emotions. To clarify this possibility, comparing brain responses to emotion evoked by several model stimuli, which are perceived by different sensory organs, is needed in further studies.
Acknowledgements
We are grateful to Professor Hiromi Akutsu for helpful supports. We thank to Professor Tetsuro Yamashita and Professor Masao Miyazaki for allowing to use LABNIRS. We would like to thank Editage (www.editage.com) for English language editing.
References
Cela-Conde, C. J., Marty, G., Maetsu, F., Ortiz, T., Munar, E., Fernandez, A., ... Quesney, F. (2004). Activation of the prefrontal cortex in the human visual aesthetic perception. Proceeding of the National Academy of Science, 101(16), 6321-6325.
David, M. (Director), Matle, G. (Producer), Gillian, B. (Producer), & Kim, F. A. (Writer). (2011). Perfect Sense [DVD]. Tokyo, Japan: Presideo Corporation. Pictures.
Faten, M. A., Ian, M., Tony, K., Jamaan, A., & Vanessa, S. (2012). Regional brain responses to pleasant and unpleasant IAPS pictures: Different networks. Neuroscience Letters, 512, 94-98.
Harman, J. E., Philip, A. G., & Carly, K. P. (2010). The role of asymmetric frontal cortical activity in emotion-related phenomena: A review and update. Biological Psychology, 84, 451-462.
Hoshi, Y. (2003). Functional near-infrared optical imaging: Utility and limitations in human brain mapping. Psychophysiology, 40, 511-520.
Ito, N., Murata, A., & Matsumi, J. (2012). Relationship between depressive symptoms, and engagement in pleasant and unpleasant activities and emotional responses to these activities in Japanese undergraduate students:
One-day dairy study. Japanese Journal of Research on Emotions, 19(2), 52-59.
Lang, P. J., Bradley, M. M., & Cuthbert, B. N. (1997). International Affective Picture System (IAPS): Affective ratings of pictures and instruction manual [Brochure]. Retrieved from https://www2.unifesp.br/dpsicobio/adap/ instructions.pdf
Nolen, H. S., Fredrickson, L. B., Loftus, R. G., & Luts, C (2014). Atkinson & Hilgard’s Introduction to psychology 16th Edition. CT: Cengage Learning Publishers.
Norman, J. L., & Thaler, L. (2019) Retinotopic-like maps of spatial sound on primary ‘visual’ cortex of blind human echolocators. PROCEEDINGS OF THE ROYAL SOCIETY B, 216, 20191910, doi:10.1098/ rspb.2019.1910.
Okamoto, Y. (2005). Prefrontal cortex felt the stress. Folia Pharmacologica Japonica, 126, 194-198.
Plichta, M. M., Gerdes, A. M., Alpers, G. W., Harnisch, W., Brill, S., Wieser, M. J., & Fallgatter, A. J. (2011). Auditory cortex activation is modulated by emotion: A functional near-infrared spectroscopy (fNIRS) study. NeuroImage, 55, 1200-1207.
Russel, A. J. (1980). A circumplex model of affect. Journal of Personality and Social Psychology, 39 (6), 1161-1178. Yamaguchi, M., & Suzuki, N. (2008). Impulsive behavior and psychophysiological responses on arousal of emotion.
Nihon Shinrigakkai Taikai Happyo Ronbunshu Nihon Shinrigakkai Dai 72 Kai Taikai, 996.
Yamamoto, S., Yanagisawa, K., & Tsunashima, H. (2013). Evaluation of brain activity during the presentation of pleasant-unpleasant images using NIRS. Nihon Daigaku Seisan Kougakubu Dai 45 Kai Gakujutu Kouenkai Kouen Gaiyou, 173-176.