Simpler Method for Acquiring Quantitative
State-of-Charge Distribution of Lithium-Ion
Battery Cathode with High Accuracy
著者
Susumu Imashuku, Hiroyuki Taguchi, Toru
Kawamata, Hiroshi Yorifuji, Shun Fujieda,
Shunsuke Kashiwakura, Kozo Shinoda, Shigeru
Suzuki, Kazuaki Wagatsuma
journal or
publication title
Journal of The Electrochemical Society
volume
166
number
10
page range
A1972-A1976
year
2019-06-12
URL
http://hdl.handle.net/10097/00128245
Simpler method for acquiring quantitative state-of-charge distribution of lithium-ion battery cathode with high accuracy
Susumu Imashukua, Hiroyuki Taguchia, Toru Kawamataa,b, Hiroshi Yorifujib, Shun Fujiedab, Shunsuke Kashiwakuraa, Kozo Shinodab, Shigeru Suzukib, Kazuaki Wagatsumaa
aInstitute for Materials Research, Tohoku University, 2-1-1 Katahira, Aoba-ku, Sendai
980-8577, Japan
bInstitute of Multidisciplinary Research for Advanced Materials, Tohoku University, Katahira,
Aoba-ku, Sendai 980-8577, Japan
Corresponding author: Susumu Imashuku E-mail: [email protected] TEL: +81-22-215-2132
FAX: +81-22-215-2131
Abstract
Acquiring the quantitative state-of-charge (SOC) distribution of a lithium-ion battery cathode is important to improve the performance of lithium-ion batteries for the application to large-scale devices. The conventional method to obtain SOC distribution, i.e., X-ray absorption spectroscopy (XAS), requires a synchrotron radiation facility, references that are difficult to prepare, and an investigation of the XAS spectra of the references. Herein, we demonstrate that laser-induced breakdown spectroscopy (LIBS) can acquire a quantitative SOC of a charged lithium-ion battery cathode with high accuracy by comparing the SOC values of charged cathodes containing Li2NaV2(PO4)3 as an active material determined by
LIBS, XAS, and a charge–discharge curve. We perform LIBS measurements in a reduced argon atmosphere of 1000 Pa and use a calibration curve obtained by measuring the emission intensities at 610.4 nm of the pristine cathode. The SOCs of the charged cathodes agree well with the average SOCs estimated from the charge–discharge curves, whereas those determined by XAS do not. Therefore, LIBS is more suitable to acquire a quantitative SOC distribution of a lithium-ion battery cathode than XAS because LIBS is a laboratory-scale measurement and requires a single simple reference in addition to its high accuracy.
Introduction
Lithium-ion batteries have recently been used extensively in large-scale devices such as electric vehicles and stationary electric energy storage systems in addition to portable devices such as laptop computers and cell phones. A higher charge–discharge rate capacity is demanded for lithium-ion batteries to be rapidly introduced to the market as large-scale devices1-9 because they require a high power output and a rapid charge–discharge cycle. However, a major limitation to achieving a higher charge–discharge rate is the inhomogeneous reaction distribution at the cathode of lithium-ion batteries.7,9-16 Therefore, it
is paramount to acquire an accurate analytical tool that can determine the inhomogeneous reaction distribution at the cathode, which can be used subsequently to determine how to best minimize the inhomogeneous reaction distribution to improve the quality of lithium-ion batteries.
X-ray absorption spectroscopy (XAS) is a technique used widely for visualizing the reaction distribution of a lithium-ion battery cathode. The reaction distribution of a cathode is acquired by obtaining the XAS spectrum for each point of the cathode and calculating its state-of-charge (SOC), which is equivalent to the reaction distribution, from the XAS spectrum. Several methods are proposed empirically for calculating the SOC as follows: 1. Energy shift or intensity change of K- or L-edge peak in X-ray absorption near-edge
structure (XANES) spectrum7,9,12,15-23
2. Metal–metal or metal–oxygen interatomic distance change of cathodes determined from a Fourier-transformed extended X-ray absorption fine structure (EXAFS) spectrum 17,18,22-24 3. Linear combination fitting using the XAS spectra of the reference samples such as
cathodes with SOCs of 0% and 100%6,13,25-29
4. Energy shift at the normalized intensity of 0.5 in the XANES spectrum30
This measurement procedure for acquiring the reaction distribution is easily applicable in cathodes that are well studied by XAS such as LiCoO2, LiNiO2, and LiFePO4. To determine
the SOC of cathodes whose XAS analysis are not well studied such as novel materials, it is necessary to select a suitable method to calculate the SOC among the several methods mentioned above by investigating the XAS spectra of a few or several reference samples with different SOCs and homogeneous reaction distributions, such as homogeneous cathodes with an SOC of 0% (pristine), 50% (half charged), and 100% (fully charged). However, the acquisition of XAS spectra of the reference samples is problematic because the preparation of the reference samples is time consuming and difficult. In addition, artifacts associated with the fitting or normalization of the XAS spectra may arise.
In contrast, laser-induced breakdown spectroscopy (LIBS) that is an analytical technique to acquire an optical spectrum emitted from atoms evaporated from a sample as a result of the irradiation of a pulsed laser, is a promising method to display the reaction distribution of novel cathode materials.14,32,33 This is because we can acquire the SOC of the cathodes by measuring the lithium emission intensities of a cathode and the reference samples that are easy to prepare. We have recently demonstrated that LIBS can be used to acquire a semi-quantitative reaction distribution of lithium-ion battery cathodes containing LiCoO2 as
an active material using mixtures of LiCoO2 and Co3O4 as reference samples.34,35 Moreover,
LIBS can be performed in a laboratory, whereas XAS requires a synchrotron radiation facility. LIBS is also a straightforward method to display the SOC distribution of cathodes because it can directly detect signals from lithium, that is, light associated with the de-excitation of lithium atoms in a plasma. In contrast, XAS is an indirect method to display the SOC distribution of cathodes since the SOC of cathodes is speculated from the XAS spectra of transition metals in cathodes. In this study, we investigated the advantages of LIBS over XAS for the estimation of the SOC of novel cathodes using a cathode in which Li2NaV2(PO4)3 was
used as an active material. Li2NaV2(PO4)3 is a promising cathode material for lithium-ion
batteries owing to its high discharge capacity, stable framework structure, and a single-voltage plateau at approximately 3.7 V (vs. Li+/Li).36-42 However, the Li
2NaV2(PO4)3 cathode
has not been well investigated by XAS.
Experimental
The active material in the cathode of Li2NaV2(PO4)3 was synthesized by chemical ion
exchange reaction from Na3V2(PO4)3.36 Na3V2(PO4)3 was prepared by the solid-state reaction
of stoichiometric amounts of Na2CO3 (purity: 99.8%, Wako Pure Chemical Industries, Ltd.,
Osaka, Japan), V2O5 (purity: 99%, Wako Pure Chemical Industries, Ltd., Osaka, Japan), and
NH4H2PO4 (purity: 99%, Wako Pure Chemical Industries, Ltd., Osaka, Japan). The mixture
was heated at 400 °C for 6 h in air. The obtained powder mixture was pressed into a pellet and heated at 700 °C for 8 h by flowing 90 vol% argon and 10 vol% hydrogen. The pellet was subsequently heated at 1000 °C for 8 h in the atmosphere. For the ion-exchange reaction, 0.2 g of the Li2NaV2(PO4)3 was dissolved in 50 mL of 1 mol dm3 LiNO3 (Wako Pure Chemical
Industries, Ltd., Osaka, Japan) aqueous solution. The mixed solution was stirred for 24 h. The obtained Li2NaV2(PO4)3 powder was rinsed by ion exchange water using a centrifuge and
freeze dried.
The cathode material was prepared by mixing the Li2NaV2(PO4)3 powder, acetylene
black, and polytetrafluoroethylene at a weight ratio of 14:5:1. The mixture was stretched into a sheet using an agate mortar. The cathode was cut into a disk of diameter 10 mm from the sheet and dried at 353 K. A lithium-ion battery cell was assembled using the cathode, Li foil with a diameter of 15 mm (anode) (Honjo Metal Co., Ltd., Osaka, Japan), polyethylene film (separator), and 1 mol dm3 LiPF6 dissolved in a mixed solution of 50 vol.% ethylene
Osaka, Japan), as shown in our previous reports.34,35 The assembly process was performed in an argon-filled glove box, where the dew point of water and the concentrations of water and oxygen were controlled at less than 70 °C and 10 ppm, respectively. The assembled cell was charged and discharged between 2.5 and 4.2 V (vs. Li+/Li) at 6.65 mA g-1 based on the Li2NaV2(PO4)3 weight (0.05 C) using a battery charge–discharge system (HJ1001SD8,
Hokuto Denko Corporation, Tokyo, Japan).
LIBS measurements of the cathode were performed using a custom LIBS system. Details of the LIBS system have been reported previously.34,35 We outline the LIBS system
briefly in this section. A Q-switched Nd:YAG laser (LOTIS TII, LS-2137) with a wavelength of 532 nm was used. The energy and duration of the pulsed laser irradiated on the samples were 20 mJ/pulse and 16–18 ns, respectively. The laser was focused on the cathode surface using a plano-convex lens with a focal length of 150 mm. A single pulse was shot from the laser onto the cathodes for each measurement point. The light emitted from the plasma was collected using a plano-convex lens with a focal length of 100 mm, through an optical fiber to a spectrometer system consisting of an Echelle-type spectrograph (ME5000, Andor Technology Ltd., Belfast, UK) and an intensified charge-coupled device (ICCD) detector (DH734-18F, Andor Technology Ltd., Belfast, UK). The gate of the ICCD detectors was triggered by the laser, and the relative delay was controlled by the digital delay generator integrated in the ICCD detectors. The gate width and relative delay were set to 20 s and 800 ns, respectively. The cathodes were placed in a chamber, thus enabling the atmosphere to be controlled by introducing gas and the connection of a rotary pump. The LIBS measurements were conducted in an argon atmosphere of 1000 Pa because a self-absorption effect of lithium was buffered under the measurement condition.34
XAS measurements of the cathodes were performed by collecting the spectra near the V K-edge (5428.9–5533.9 eV) with an energy step of 0.35 eV at the BL-7C beamlines of the
photon factory (High Energy Accelerator Research Organization, Japan). The scan rate of the energy was 1 step s-1. The beam size of the X-ray was set to 500 µm × 500 m in the x-y
direction using a slit. The intensities of the incident and transmitted X-rays were measured using ion chambers. VO2 (Wako Pure Chemical Industries, Ltd., Osaka, Japan) was used as a
reference for the V(IV) state.
Results and discussion
LIBS and XAS measurements were performed for the following cathodes under three different conditions: a pristine cathode (cathode A), a cathode charged until 4.2 V (vs. Li+/Li) and discharged until 2.5 V (vs. Li+/Li) (cathode B), and a cathode charged until 4.2 V (vs. Li+/Li) (cathode C). Fig. 1 shows the charge and discharge curves of cathodes B and C. These
curves are similar to those of previously reported Li2NaV2(PO4)3/Li cells,36-42 indicating that
the cells in this study were operated correctly as a lithium ion battery. At the end points of the charging, the specific capacities of cathodes B and C were 108 and 105 mAh g–1, respectively. The specific capacity of cathode B was 74 mAh g–1 at the end of the discharging. Thus, the average SOCs for cathodes B and C corresponded to 26% and 79%, respectively, (Table 1) as the theoretical specific capacity of Li2NaV2(PO4)3 was 133 mAh g–1.38
We performed the LIBS measurements for cathodes A, B, and C to estimate their SOCs by measuring the intensities of a lithium emission line. The lithium concentration in the electrodes corresponds inversely to the SOC; therefore, the lithium concentration should increase in the order of cathodes C, B, and A. Fig. 2 shows the LIBS spectra of cathodes A, B, and C. The measured area for each cathode was an arbitrarily selected portion in the electrode of diameter 250 μm and depth 50 μm, and the measurement was repeated four times for each sample. Two intense lithium emission lines at 610.4 (Li I 670.8 nm line: 3.879 eV → 1.848 eV, 1s23d → 1s22p) and 670.8 nm (Li I 670.8 nm line: 1.848 eV → 0.000 eV, 1s22p → 1s22s)
were detected in the spectra. The intensities of these two lithium emission lines increased with increasing the lithium concentrations of the cathodes. In the present study, Li I 610.4 nm was selected for estimating the SOCs of the cathodes. This is because the Li I 610.4 nm line is more suitable for the quantitative analysis of lithium than Li I 670.8 nm line owing to its better linearity of the calibration curve and lower relative standard deviations, as revealed in our previous paper.34 For the estimation of the SOC, we assumed that the emission intensity for cathode A corresponded to an SOC of 0% and the emission intensity was zero in an SOC of 100%. It is also assumed that the emission intensity of the Li I 610.4 nm line increases linearly with the decrease in the SOC of the cathodes, or with the increase in the lithium concentrations of the cathodes without self-absorption. These assumptions are based on our previous results in that the emission intensities of the Li I 610.4 nm line increased linearly with increasing the lithium concentrations until approximately 3.2 mass% of lithium when a mixture of LiCoO2 and Co3O4 was employed as the sample.34 Because the highest lithium
concentration of the present cathodes is 3.3 mass% (Li2NaV2(PO4)3), the Li I 610.4 nm line
would be almost exempted from self-absorption in the range of their lithium concentrations. Under these assumptions, the SOCs of cathodes B and C were calculated to be 27% and 79%, respectively (Table 1). These values are in fairly good agreement with the average SOCs calculated from the charge–discharge curves, indicating that we can quantitatively evaluate the SOC of the Li2NaV2(PO4)3 cathode by LIBS measurement. The relatively low standard
deviations of the SOCs of cathodes B and C (Table 1) suggest that the lithium distributions of cathodes B and C are homogeneous and the charging rate of 0.05 C is a sufficient charging rate for lithium ions in the Li2NaV2(PO4)3 cathode to cause a homogenous charge–discharge
reaction.
XAS measurements were performed on cathodes A, B, C, and VO2 to estimate the
measurements were performed for the cathodes measured by LIBS. The XAS measurements were performed prior to the LIBS measurement to prevent the cathodes from being destroyed by the laser irradiation during LIBS measurements. Characteristic energy shifts or intensity changes did not appear in the primary peak (approximately 5478 eV) and pre-edge peak (approximately 5463 eV) of the V K-edge of cathodes A, B, and C. This suggests that it is difficult to estimate the SOCs using the primary and pre-edge peaks. Additionally, it is not suitable to estimate the SOC from the V–V or V–O distance calculated from the V K-edge EXAFS spectra because the structure of VO2 used as a reference for the V(IV) state is
different from that of Li2NaV2(PO4)3. In the present study, we evaluated the SOCs of the
cathodes from an energy position at the normalized intensity of 0.5.30 We assumed that the
energy of the V K-edge shifted linearly from V(III) to V(IV) with decreasing lithium concentration in the cathode since the extraction/insertion of lithium ions from Li2NaV2(PO4)3
occurs without the structural transformation. We considered the background absorbance for each XAS spectrum (Fig. 3) to be the lowest absorbance in the measured energy range, and subsequently the background-subtracted XAS spectrum was normalized by the absorbance at 5550 eV that was the highest measured energy and was in the post-edge energy region, based on the previous report.30 The SOCs evaluated from the energy positions at the normalized intensity of 0.5 are shown in Table 1. The SOCs estimated from the XAS measurements were inconsistent with those calculated from the charge–discharge curves in comparison with those estimated from the LIBS measurement. This inconsistency may be because an XAS spectrum of VO2 was used as the reference for the V(IV) state. If a homogeneous Li2NaV2(PO4)3
cathode with an SOC of 100% is used for the reference for the V(IV) state, the accuracy of the XAS result will be improved.
The results obtained by LIBS and XAS measurements indicate that LIBS can more easily obtain an accurate SOC of the Li2NaV2(PO4)3 cathode than XAS. This is because the
LIBS measurement only requires a pristine cathode for the reference with SOC of 0%, whereas the XAS measurement requires two cathodes with SOCs of 0% and 100% separately for the references. Additionally, the cathode with an SOC of 0% (pristine cathode) can be prepared much more easily than that with an SOC of 100% (fully charged homogeneous cathode). A procedure to determine the SOC of charged cathodes by LIBS is simpler than that by XAS because a straight line between zero for the SOC of 100% and the emission intensity of a pristine cathode for the SOC of 0% were used for a calibration curve to determine the SOC of the charged cathodes. Therefore, LIBS is advantageous over XAS for acquiring a quantitative SOC distribution of cathodes, especially for cathodes that are not well studied by XAS, although the in-plane special resolution of the present LIBS system (approximately 200 μm) is lower than that of the XAS with a high special resolution (several micrometers).
We note that the method to determine the SOC from the straight line calibration curve is limited to electrodes with lithium concentrations less than approximately 3.2 mass%, because above 3.2 mass% of lithium the calibration curve negatively deviated from a straight line owing to self-absorption.34 A calibration curve obtained by using standard samples is
required to determine SOC of electrode materials with lithium concentrations above 3.2 mass%, such as LiCoO2 and carbon (LiC6). When we performed LIBS measurements for a
pristine LiCoO2 cathode (cathode D) and LiCoO2 cathode (cathode E) that was charged from
2.5 to 4.2 V (vs. Li+/Li) at 7.0 mA g-1 based on the LiCoO2 weight (0.2 C), the SOC of
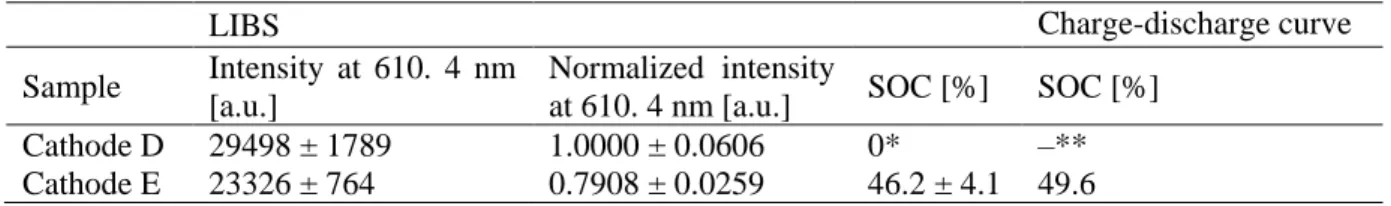
cathode E was calculated to be 46% (Table 2) by using a calibration curve obtained by using standard samples whose atomic ratios of lithium to cobalt are 0, 0.10, 0.30, 0.51, 0.62, 0.80, and 0.99 (Fig. 4(a)).34 The average SOC for cathode E was calculated to 50% from the charge curve of cathode E (Fig. 4(b)) since the specific capacity of cathode E was 133 mAh g–1 at the end point of the charging and the theoretical specific capacity of LiCoO2 was 274 mAh g–1.43
calculated from the charge curve, indicating that we can also evaluate electrodes with lithium concentrations above 3.2 mass% by LIBS measurement.
Conclusions
We investigated the advantages of LIBS over XAS for acquiring the quantitative SOC distribution of cathodes when using a cathode containing Li2NaV2(PO4)3 as an active material.
LIBS measurement was performed by measuring the emission intensities at 610.4 nm in an argon atmosphere of 1000 Pa. The SOCs of charged cathodes were determined by assuming a proportional relationship between the emission intensity and SOC of the cathodes and by measuring the emission intensity of the pristine cathode as a reference cathode for an SOC of 0%. The SOCs of the charged cathodes obtained by LIBS measurement were consistent with the average SOCs calculated from the charge–discharge curves. In contrast, the SOCs of the charged cathodes determined by XAS were lower than the average SOCs calculated from the charge–discharge curves. This is because an XAS spectrum of VO2 was used as the reference
for an SOC of 100% owing to the difficulty in preparing the cathode with an SOC of 100%. Our results indicated that LIBS could provide a quantitative SOC of the Li2NaV2(PO4)3
cathode in comparison with XAS. Therefore, LIBS is a promising method to easily acquire the quantitative SOC distribution of cathodes because it can be performed in a laboratory and the preparation of the standard sample is simple.
Acknowledgements
Financial support for the present study was provided by the cooperation program of research institutes in Tohoku University. The X-ray absorption spectroscopy measurements were performed under the approval of the Photon Factory Program Advisory Committee
(Proposal No. 2015G634) and SPring-8 of the Japan Synchrotron Radiation Research Institute (JASRI) (Proposal No. 2015A1975).
References
1. H. Liang, X. Qiu, H. Chen, Z. He, W. Zhu, and L. Chen, Electrochem. Commun., 6, 789 (2004).
2. S. Huang, Z. Wen, X. Yang, and Z. Gu, X. Xu, J. Power Sources, 148, 72 (2005). 3. K. Kang, Y.S. Meng, J. Brėger, C.P. Grey, and G. Ceder, Science, 311, 977 (2006).
4. M. Okubo, E. Hosono, J. Kim, M. Enomoto, N. Kojima, T. Kudo, H. Zhou, and I. Honma,
J. Am. Chem. Soc., 129, 7444 (2007).
5. B. Kang and G. Ceder, Nature, 458, 190 (2009).
6. X. Yu, Q. Wang, Y. Zhou, H. Li, X.-Q. Yang, K.-W. Nam, S.N. Ehrlich, S. Khalid, and Y.S. Meng, Chem. Commun., 48, 11737 (2012).
7. T. Nakamura, T. Watanabe, K. Amezawa, H. Tanida, K. Ohara, Y. Uchimoto, and Z. Ogumi, Solid State Ionics, 262, 66 (2014).
8. M. Katayama, K. Sumiwaka, R. Miyahara, H. Yamashige, H. Arai, Y. Uchimoto, T. Ohta, Y. Inada, and Z. Ogumi, J. Power Sources, 269, 994 (2014).
9. T. Nakamura, T. Watanabe, Y. Kimura, K. Amezawa, K. Nitta, H. Tanida, K. Ohara, Y. Uchimoto, and Z. Ogumi, J. Phys. Chem. C, 121, 2118 (2017).
10. J. Liu, M. Kunz, K. Chen, N. Tamura, and T.J. Richardson, J. Phys. Chem. Lett., 1, 2120 (2010).
11. K, Mima, R. Gonzalez-Arrabal, H. Azuma, A. Yamazaki, C. Okuda, Y. Ukyo, H. Sawada, K. Fujita, Y. Kato, J.M. Perlado, and S. Nakai, Nucl. Instrum. Methods Phys. Res. Sect.
B-Beam Interact. Mater. Atoms, 290, 79 (2012).
12. G. Ouvrard, M. Zerrouki, P. Soudan, B. Lestriez, C. Masquelier, M. Morcrette, S. Hamelet, S. Belin, A.M. Flank, and F. Baudelet, J. Power Sources, 229, 16 (2013).
13. J. Zhou, J. Wang, Y. Hu, T. Regier, H. Wang, Y. Yang, Y. Cui, and H. Dai, Chem.
Commun., 49, 1765 (2013).
14. P. Smyrek, J. Pröll, H.J. Seifert, and W. Pfleging, J. Electrochem. Soc., 163, A19 (2016). 15. H. Tanida, H. Yamashige, Y. Orikasa, Y. Gogyo, H. Arai, Y. Uchimoto, and Z. Ogumi, J.
Phys. Chem. C, 120, 4739 (2016).
16. M. Fakkao, K. Chiba, Y. Kimura, T. Nakamura, T. Okumura, K. Nitta, Y. Terada, Y. Uchimoto, and K. Amezawa, J. Ceram. Soc. Japan, 125, 299 (2017).
17. I. Nakai, K. Takahashi, Y. shiraishi, T. Nakagome, F. Izumi, Y. Ishii, F. Nishikawa, and T. Konishi, J. Power Sources, 68, 536 (1997).
19. M.-G. Kim and C.-H. Yo, J. Phys. Chem. B, 103, 6457 (1999).
20. W.-S. Yoon, K.-K. Lee, and K.-B. Kim, J. Electrochem. Soc., 147, 2023 (2000).
21. W.-S. Yoon, K.-B. Kim, M.-G. Kim, M.-K. Lee, H.-J. Shin, J.-M. Lee, J.-S. Lee, and C.-H. Yo, J. Phys. Chem. B, 106, 2526 (2002).
22. T. Nonaka and C. Okuda, R&D Review of Toyota CRDL, 38, 10 (2003).
23. C.J. Patridge, C.T. Love, K.E. Swider-Lyons, M.E. Twigg, and D.E. Ramaker, J. Solid
State Chem., 203, 134 (2013).
24. A. Deb, U. Bergmann, S.P. Cramer, and E.J. Cairns, Electrochim. Acta, 50, 5200 (2005). 25. F. Meirer, J. Cabana, Y. Liu, A. Mehta, J.C. Andrews, and P. Pianetta, J. Synchrotron
Rad., 18, 773 (2011).
26. J. Wang, Y.K. Chen-Wiegart, and J. Wang, Nature Comm., 5, 4570 (2014).
27. F. Yang, Y. Liu, S.K. Martha, Z. Wu, J.C. Andrews, G.E. Ice, P. Pianetta, and J. Manda,
Nano Lett., 14, 4334 (2014).
28. L. Nowack, D. Grolimund, V. Samson, and F. Marone, Sci. Rep., 6, 21479 (2016).
29. R.E. Ruther, A.S. Pandian, P. Yan, J.N. Weker, C. Wang, and J. Nanda, Chem. Mater., 29, 2997 (2017).
30. D. Takamatsu, Y. Koyama, Y. Orikasa, S. Mori, T. Nakatsutsumi, T. Hirano, H. Tanida, H. Arai, Y. Uchimoto, and Z. Ogumi, Angew. Chem. Int. Ed., 51, 11597 (2012).
31. M. Katayama, K. Sumiwaka, K. Hayashi, K. Ozutsumi, T. Ohta, and Y. Inasa, J.
Synchrotron Rad., 19, 717 (2012).
32. V. Zorba, J. Syzdek, X. Mao, R.E. Russo, and R. Kostecki, App. Phys. Lett., 100, 234101 (2012).
33. P. Gotcu, W. Pfleging, P. Smyrek, and H.J. Seifert, Phys. Chem. Chem. Phys., 19, 11920 (2017).
34. S. Imashuku, H. Taguchi, T. Kawamata, S. Fujieda, S. Kashiwakura, S. Suzuki, and K. Wagatsuma, J. Power Sources, 399, 186 (2018).
35. S. Imashuku, H. Taguchi, S. Fujieda, S. Suzuki, and K. Wagatsuma, Electrochim. Acta,
293, 78 (2019).
36. B. L. Cushing and L.B. Goodenough, J. Solid State Chem., 162, 176 (2001).
37. Y. Tang, C. Wamg, J. Zhou, Y. Bi, Y. Liu, D. Wang, S. Shi, and G. Li, J. Power Sources,
227, 199 (2013).
38. W. Mao, Y. Ma, S. Liu, Z. Tang, and Y. Fu, Electrochim. Acta, 147, 498 (2014).
40. L. Shao, J. Shu, Y. Tang, P. Li, X. Lin, M. Shui, N. Long, and D. Wang, Ceram. Int., 41, 5164 (2015).
41. M.H. Alfaruqi, S. Islam, J. Song, S. Kim, D.T. Pham, J. Jo, S. Kim, J.P. Baboo, D.Y. Putro, V. Mathew, and J. Kim, Chem. Phys. Lett., 681, 44 (2017).
42. S. Karuppiah and K. Nallathamby, J. Phys. Chem. C, 121, 13101 (2017).
Figure captions
Figure 1. Charge–discharge curves for (a) cathode B and (b) cathode C. Figure 2. LIBS spectra of (a) cathode A, (b) cathode B, and (c) cathode C.
Figure 3. (a) V K-edge XAS spectra of cathodes A, cathode B, cathode C, and VO2. (b)
Enlarged XAS spectra of the region enclosed with the dotted line in (a).
Figure 4. (a) Calibration curve of the Li I 610.4 nm line as a function of SOC for LiCoO2.
The calibration curve is obtained by restructuring a calibration curve acquired in our previous study.34 (b) Charge curve for cathode E.
Table I. States of charge (SOCs) of cathodes A, B, and C evaluated from charge–discharge curves, LIBS
measurements, and XAS measurements. Intensities of cathodes A, B, and C for the Li I 610.4 nm line of the LIBS spectra. Energies at the normalized intensity of 0.5 for cathodes A, B, C, and VO2 of the
XAS spectra. The LIBS and XAS spectra were acquired for at least four areas of each cathode. XAS measurement of VO2 was performed once.
*– means not measured or calculated.
** These values (0 or 100) are assumed.
Charge-discharge curve LIBS XAS
Sample SOC [%] Intensity at 610. 4
nm [a.u.] SOC [%]
Energy at the normalized
intensity of 0.5 [eV] SOC [%]
Cathode A –* 94819 ± 2326 0** 5470.60 ± 0.02 0**
Cathode B 25.5 69486 ± 2829 26.7 ± 3.0 5470.69 ± 0.01 5.9 ± 0.8
Cathode C 78.9 20259 ± 2343 78.6 ± 2.3 5471.44 ± 0.12 52.3 ± 7.5
Table II. State of charge (SOC) of cathode E evaluated from LIBS measurements and charge–discharge curve.
Intensities and normalized intensities of cathodes D and E for the Li I 610.4 nm line of the LIBS spectra. The LIBS measurements were acquired for at least five areas of each cathode.
* This value is assumed.
** – means not measured.
LIBS Charge-discharge curve
Sample Intensity at 610. 4 nm [a.u.]
Normalized intensity
at 610. 4 nm [a.u.] SOC [%] SOC [%]
Cathode D 29498 ± 1789 1.0000 ± 0.0606 0* –**