Unemployment & Unstable Employment in Japan
著者 Iwai Hiroshi
journal or
publication title
Kansai University review of economics
volume 2
page range 75‑114
year 2000‑03
URL http://hdl.handle.net/10112/00017169
Alternative Unemployment Indicator and Unemployment & Unstable Employment in Japan
Hiroshi Iwai
Japanese unemployment rate had been kept relatively low among international society until the bubble period of the early nineteen nineties. Due to long-term post-bubble stagnancy, the unemployment rate rapidly increased. The latescence of unem ployment is progressing behind an official unemployment rate in Japan: It exits as one form of persons not in the labor force desir ing job but not seeking job, the growth of discouraged workers (so- called hidden or invisible unemployment) and as a number of persons in unstable employment. I analyze the medium & long- term change of visible and invisible factors for the unemployment and unstable employment structure based on alternative unem ployment indicator (U indicators) and employment and unemploy ment statistics in Japan.
Kewords: Latescence of unemployment. Alternative unemployment indicator.
Discouraged workers. Involuntary unstable employment.
Foreword
During postwar growing period, it was advertised that the capitalism over came a matter of unemployment. However, the problem of unemployment
and its countermeasure has become a main theme for the economics andpolitics of every country because of increased international unemployment rate under recent low economic growth. Japanese unemployment rate had been kept relatively low among international society until the bubble period of the early nineteen nineties. Due to long-term and deepened post-bubble stagnancy, the unemployment rate rapidly increased to reach 4% level in 1998, exceeding that of U.S.A. In March 1999, Japanese unemployment rate, the youth unemployment rate and a number of unemployed person^' reached 4.8%, 10.9% and 3.39 millions, respectively. In April this year, the male unemployment rate reached 5% level and it is called the worst unem ployment after the war.
75
In statistical studies of modern unemployment problems, the statistical Indicator of workers In Irregular and unstable employment has been deemed Important In addition to a number of official unemployed person and unemployment-related Indicators. Lowered labor and work conditions due to capital rationalization accelerated unstable employment: In particu lar, It Increased a rate of female wage earners and a number of double Income households with multiple jobs, bringing about a growth of non- standard or atypical employment such as temporary workers or dally hires, part-timers and dispatched workers. The promotion of labor market flexibil ity, antlregulatory strategy and labor force saving as capital employment policies have generated various forms of nonstandard or unstable employ ment, causing an International expansion of unemployment and serious social problems2'.
Japanese unemployment structure has been sustained by employment convention of not eliciting unemployment In the labor market and dlstlnc- tlveness of labor market Itself. It has been deeply connected with the fol lowing factors: duplicate economic structure and disparity In labor conditions (by sex, age, size and Industry); mobility and stagnancy of sur plus labor force within companies and Industries (internal labor market);
and seniority system with no layoff system or others and life employment system. In the background of relatively-low Japanese unemployment rate (official unemployment rate) until bubble period, there was an Invisibility or latency of unemployment, that Is, the existence of person not In the labor force desiring jobs (whether currently seeking job or not) and an Increased number of workers In unstable employment with lower working conditions.
The latescence of unemployment Is progressing In two aspects: First, It
exits as one form of persons not In the labor force who desire job whether
seeking job or not, the growth of discouraged workers In particular, which
Indicates the existence of marginal labor force (marginal group between
labor force and not labor force) problem, so-called hidden or Invisible
unemployment. Second, It appears as an Increased number of persons In
unstable employment who have to work under any poor conditions In
order to survive. The growth of workers In unstable employment Including
temporary workers, dally hires and workers who wish to change jobs,
especially Increasing number of workers In Involuntarily unstable employ
ment Is a form of latescent unemployment. The latescent unemployment Is
deeply connected with female labor force In particular. Elongated "Heisei"
depression has made "structural unemployment" defined by OECD more serious. However, the understanding of unemployment problem by public authorities stays only within the range of mismatch between deficient demand for labor force and its supply, where there is no approach of examining factors of structural, visible and invisible changes in unemploy
ment and unstable employment^'.
Section 1 in this paper analyzes an international trend related with alterna tive unemployment indicator (an acronym of AUIs, hereinafter abbreviated to as AUIs) and various factors of change in unemployment structure based on Japanese AUIs (U indicator) in the nineteen nineties. Section 2 examines factors of medium and long-term changes in Japanese unem
ployment and unstable employment structure since the nineteen seventies and a change in the employment structure for each industry based on the employment and unemployment statistics of Japan: statistic indicators of Special Survey of the Labor Force Survey (hereinafter abbreviated to as SLFS) and Employment Status Survey (hereinafter abbreviated to as ESS) to review the change of visible and invisible factors for the unemployment
and unstable employment structure.
1. Alternative unemployment Indicator (AUIs) and unemployment &
unstable employment
1.1 International trend related with AUIs
The unemployment statistics and unemployment rate in each country depend on their sources and preparation methods, therefore, they cannot be directly compared with each other. As an attempt of internationally comparing unemployment rates (adjusted unemployment rate), there is the standardized unemployment rate defined by OECD. In the nineteen nineties, the unemployment rates of OECD member states except for the U.S.A. it's high level; especially in European counties, they have exceeded as high as 10%. Although the unemployment rate in Japan indicated the relatively low level of 2—3% even during the period of low economic growth, it has rapidly increased due to post-bubble long-term depression to accelerate the elicitation of unemployment and the aggravation of unem
ployment indicator.
Depending on a difference in the sources of unemployment statistics and preparation methods, there are labor force statistics and registered statis tics, which use different methods of calculating of elicited unemployment rates and have different meanings. Unemployment statistics also differ in meanings depending on particularities and differences in labor markets between advanced and developing countries. Attempts of internationally comparing unemployment rates have been made as calculation of stan dardized unemployment rate compared and adjusted by OECD, that of international comparison in unemployment rates adjusted to the American concept by the Bureau of Labor Statistics (BLS) in the U.S.A. and a com
parison in adjusted unemployment rates between Japan and the U.S., etc.
However, a limitation in indicating the unemployment with a single unem ployment rate has been discussed as a matter of meaning and limitation of labor force approach, which is an international standard (ILO standard), to review the conceptual specification and measurement of underemploy ment indicator and AUIs as those supplementing and substituting for the published unemployment rate, a single indicator, on an international basis'". AUIs supplementing the unemployment rate (U indicator, etc.) indi cate some part of a system of visible and invisible indicators for unemploy
ment and unstable employment.
1) International discussions about reasons why the unemployment rate in
Japan is low and to what extent it indicates the reality have been made
since the early nineteen eighties. Because this question was proposed by
American researchers, a comparison between Japan and the U.S. has been
tried based on the adjusted unemployment rate prepared by adjusting the
Japanese unemployment concept to the American concept. In the compar
ison in unemployment statistics between Japan and the U.S., (1) a problem
of comparative adjustment in statistics and (2) that of particularities in
Japanese and American labor markets behind those statistics were also
discussed as related matters. In the comparative adjustment using statis
tics, the adjusted unemployment rate was calculated and, at the same time,
the comparison among indicators including one supplementing and replac
ing the published unemployment rate, a single unemployment indicator,
that is, invisible unemployment indicator (persons not in the labor force
desiring jobs, etc.) was discussed and disputed while relating it such issues
as unemployment structures of Japan and the U.S. and particularities in
their labor markets®'.
In the U.S.A., "poverty In abundance" problem, namely, a problem of unemployment and partial unemployment as well as poverty (races and downscale) in metropolitan areas (urban ghetto) was socialized in the pros
pering period of the nineteen sixties (low unemployment rate nationwide), and the concept and indicator of subemployment were examined as a
measurement of relation between unemployment and economic hardship.
Basic elements of subemployment consisted of unemployed person, dis couraged workers, involuntary part-timers and low wage or downscale workers (poor). Subsequently, during the nineteen seventies, several com prehensive indicators were calculated to form a research of alternative indi cator for unemployment rate as well as a part of measurement of underemployment indicator®'. Initially, BLS positively participated in the establishment of subemployment indicator, however, because of difficulty in indicating the relation between unemployment and poverty and that between employment and income with a single comprehensive indicator as well as a certain political judgement, it published "seven Shiskin unem ployment indicators" (U indicators) as indicators substitutable for subem ployment indicator in 1976^'. Since 1976, BLS has published the result of calculating U indicators every year. It continued the investigation study of diversified relational indicators between employment and income in the nineteen eighties. In 1989, it proposed the concept and indicator of
"Working poor" covering the employment status of workers whose living standards were lower than the poverty line as a new concept and indicator of relation between employment status and low income®'. In 1994, the fol lowing achievements were made: transition of CPS investigation to a com puter-aided survey, partial revision of CPS, insertion of "availability for work" as an investigation item for establishing unemployment conditions and addition of "job search since 12 months before" and "be able to work from the previous week" conditions to the specification of discouraged workers. In addition, for AUIs (U indicators), new U indicators were deter mined and published in 1994®'.
The concept and indicator of underemployment, a question under discus
sion led by ILO exists as a basis of the calculation of international AUIs. For
the framework of underemployment, a labor force survey and unemploy-
ment indicator (objective indicator of full employment) based on the model of advanced countries (modern labor market) and an underemployment indicator based on the model of developing countries (potential surplus population such as agriculture) simultaneously existed in the early stage.
Along with the increase and diversification of unemployment, subemploy- ment and unstable employment in advanced countries as well as the matu ration of labor markets in developing countries, the discussion on the systematic prehension of labor force survey and underemployment was started (The thirteenth ICLS of ILO, 1982) and The sixteenth ICLS in 1998 proposed the systematic prehension of unemployment rate and underem ployment indicator within the same framework as labor force survey (establishment of coherent survey items). It was a proposal of allowing the systematic prehension of unemployment, underemployment, part-time and involuntary reason, etc. by systematically placing questionnaires on "short- time employment" and "wishing to change job and have additional job", visible underemployment indicators, as investigation items in the labor force survey. Its purpose was to further develop the concept and indicator
of underemployment as a basis of establishing AUIs^°'.
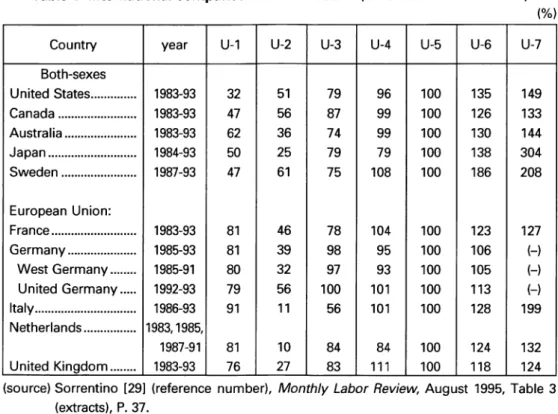
2) The international comparison of AUIs (U indicators, U-type indicators) is calculated by BLS in the U.S.A. In particular, Sorrentino of BLS made some modification for international application to provide the calculation of inter national comparison of U indicators as shown in table 1. For the adjust ment of international comparison, "unemployment period for more than 13 weeks" and "adult unemployment rate" (the unemployment rate of per sons of 25 years or older is used due to a certain difficulty in identifying
head of households) are adopted as U1 and US, respectively. Table 1 lists disparities in U indicators among various countries as a basis of U5 (unem ployment rate), highlighting a particularly large disparity of Japan.
Although omitted in the table, it is distinguishable that U7 of Japanese women is especially great
OECD's Bureau of Statistics has continued the investigation study of the
international comparison in part-time employment and involuntary part-
time employment to publish the result on the Journal "Employment
Outlook". It calculated and published "U-type measure" (supplementary
measure) listed in table 2 as new alternative indicators of unemployment
Table 1 International comparison of U indicators (on a basis of labor force) (%
Country year U-1 U-2 U-3 U-4 U-5 U-6 U-7
Both-sexes
United States 1983-93 32 51 79 96 100 135 149
Canada 1983-93 47 56 87 99 100 126 133
Australia 1983-93 62 36 74 99 100 130 144
Japan 1984-93 50 25 79 79 100 138 304
Sweden 1987-93 47 61 75 108 100 186 208
European Union:
France 1983-93 81 46 78 104 100 123 127
Germany 1985-93 81 39 98 95 100 106 (-)
West Germany 1985-91 80 32 97 93 100 105 (-)
United Germany 1992-93 79 56 100 101 100 113 (-)
Italy 1986-93 91 11 56 101 100 128 199
Netherlands 1983,1985,
1987-91 81 10 84 84 100 124 132
United Kingdom 1983-93 76 27 83 111 100 118 124
(source) Sorrentino [29] (reference number). Monthly Labor Review, August 1995, Table 3 (extracts), P. 37.
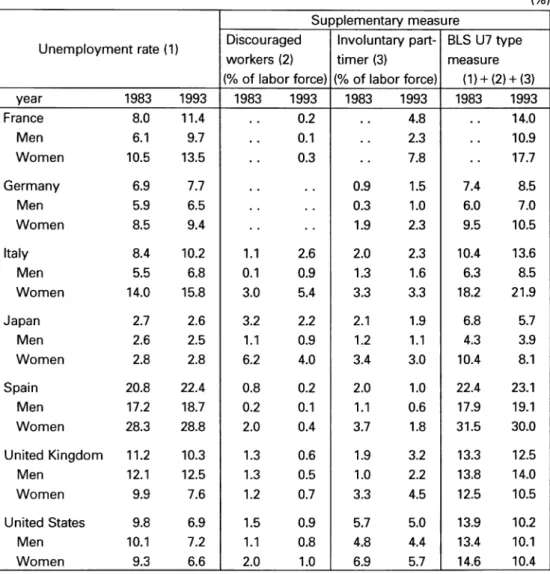
based on the BLS study purpose was to specify and estimate (1) unemployed person, (2) discouraged workers and (3) involuntary part- timers as AUIs and define the sum of respective ratios to labor force as
"supplementary measure" of unemployment. In Spain and Italy with high unemployment rates, the statistic indicators of totals in 1993 were 23.1%
and 13.6%, respectively and those of females reached 30.1% and 21.9%, respectively. In both countries, there are significant differences in the ratios of discouraged workers and involuntary part-timers between males and females. Statistic indicators of Japan are not so large because of low unemployment rate, however, it is demonstrated that the ratios of female discouraged workers is remarkably high, in 1983 and 1993, being 6.2% and 4.0%, respectively.
3) The calculation and meaning of AUIs has been internationally discussed.
The related indicators are U6 and U7, U indicators, and supplementary
Table 2 Supplementary measure (OECD, Seven major)
(%) Supplementary measure
Unemployment rate (1] Discouraged workers (2)
Involuntary part- timer (3)
BLS U7 type
measure
(% of labor force)(% of labor force) (1) + (2) + (3)
year 1983 1993 1983 1993 1983 1993 1983 1993
France 8.0 11.4 0.2 4.8 14.0
Men 6.1 9.7 0.1 2.3 10.9
Women 10.5 13.5 0.3 7.8 17.7
Germany 6.9 7.7 0.9 1.5 7.4 8.5
Men 5.9 6.5 0.3 1.0 6.0 7.0
Women 8.5 9.4 1.9 2.3 9.5 10.5
Italy 8.4 10.2 1.1 2.6 2.0 2.3 10.4 13.6
Men 5.5 6.8 0.1 0.9 1.3 1.6 6.3 8.5
Women 14.0 15.8 3.0 5.4 3.3 3.3 18.2 21.9
Japan 2.7 2.6 3.2 2.2 2.1 1.9 6.8 5.7
Men 2.6 2.5 1.1 0.9 1.2 1.1 4.3 3.9
Women 2.8 2.8 6.2 4.0 3.4 3.0 10.4 8.1
Spain 20.8 22.4 0.8 0.2 2.0 1.0 22.4 23.1
Men 17.2 18.7 0.2 0.1 1.1 0.6 17.9 19.1
Women 28.3 28.8 2.0 0.4 3.7 1.8 31.5 30.0
United Kingdom 11.2 10.3 1.3 0.6 1.9 3.2 13.3 12.5
Men 12.1 12.5 1.3 0.5 1.0 2.2 13.8 14.0
Women 9.9 7.6 1.2 0.7 3.3 4.5 12.5 10.5
United States 9.8 6.9 1.5 0.9 5.7 5.0 13.9 10.2
Men 10.1 7.2 1.1 0.8 4.8 4.4 13.4 10.1
Women 9.3 6.6 2.0 1.0 6.9 5.7 14.6 10.4
(source) OECD, Employment Outlook [26], July 1995, Table 2.18 (extracts), P. 76-77.
measure of OECD, whose major indicators are those of involuntary part- timers and discouraged workers. Both indicators are the concepts deeply connected with female employment and unemployment. The international comparison of AUIs is to internationally compare various forms of unem
ployment and unstable employment and is also intended for an interna
tional comparison of female unemployment and unstable employment in
particular. AUIs of Japan is characterized by a large quantity of person not in the labor force desiring jobs (whether currently seeking employment or not) (the majority are women) and the latescence of unemployment, espe cially the existence of a great number of female discouraged workers.
First, part-time employment is also called "part-time unemployment" or
"partial unemployment" and involuntary part-time employment is particu larly deemed a form of invisible unemployment. For involuntary part- timers, how to prescribe part-time employment and its involuntary reasons is the matter. The prescription and scope of part-time employment are dif ferent among countries. For part-time employment, there are two basic def initions: a name of employment form within workplace like answers of subjects in EU Labor Force Survey and a certain standard of working hours like a prescription "less than 35 hours a week" in Japan and U.S. Labor Force Survey. According to OECD investigations, involuntary part-time employment is defined, based on the concept and indicator of visible underemployment adopted by ILO, to include the following three groups:
(1) Workers usually work full-time but are working part-time because of economic slack, (2) workers who usually work part-time but are working fewer hours in their part-time because of economic slack and (3) those working part-time because full-time work could not be found. The majority of these groups are women^^'.
Second, discouraged workers, a primary indicator of invisible unemploy
ment, are generally persons not in the labor force desiring jobs in the labor
market, who are defined as the person discouraged from seeking jobs due
to some reasons for not seeking jobs. The prescription and coverage of
reasons for discouraged workers not to seek jobs are different among
countries, being considered as a concept containing subjective and vague
judgements of respondents, making an international comparison difficult in
a strict sense. The definition of discouraged workers in the international
comparison by OECD's Bureau of Statistics requires the discussion on the
following matters: (1) how to prescribe the range of reasons for not seeking
jobs, an investigation item in the labor force survey, (2) whether or not to
insert the "availability for work" condition in the prescription of discourage
workers like that of U.S.A. and (3) how to include the previous job search
period, etc. In the international comparison of discouraged workers, the
result Is different depending on the method of dealing with its concept and prescription^"'.
The term of "discouraged workers" is based on the concept and classifica tion having been discussed on the discouragement of willingness to seek jobs. In the U.S.A., it fell under a category of unemployed person prior to 1967 and since 1967, it has been grouped into a form of "persons not in the labor force desiring jobs but not seeking jobs" as a invisible unemploy
ment indicator. On the occasion of adopting a computer-aided survey for the labor force investigation, CPS was partially revised to improve the objectivity of labor force survey in 1994 taking the advice of Levitan Committee; an investigation item for directly confirming "availability for work" was introduced into the conditions of unemployed person in order to establish "marginally attached group" for labor market, and two condi tions of "job search since 12 months before" and "be able to work from the previous week" were added to the prescription of discouraged workers.
Recently, M. D. Castillo surveyed the studies of the past on this theme and examined the trend of discouraged workers based on this revision in his study of "persons outside the labor force who desire jobs"'®'. According to Castillo, one focus in the past studies on persons not in the labor force not seeking jobs was related to the concept of "hidden unemployment" and it was observed that the concept was expanded to include workers in visible underemployment (especially, involuntary part-timers) in addition to dis couraged workers. Another focus was brought into the concept of "labor reserve", which was more widely related with latent supply of labor than
"hidden unemployment". From both concepts, it was understood that these groups of persons not in the labor force, especially discouraged workers had stronger labor contacts with labor market than other groups, however, no strong relation was necessarily verified as shown in a Levitan Committee Report. But, Castillo pointed out the viewpoint of relation
between these calculations and the then economic situation and also demonstrated that conventional calculations were made in the economic
recovery cycle'®'.
Generally, discouraged workers tend to decrease in good times and
increase in hard times and the degree of contact with labor market
depends on economic situation. According to the statistic verification of
Castillo, a number of new-discouraged workers in the U.S.A. (reasons for not seeking jobs are not changed and conditions "job search from a year before" and "availability for work" were added) have been significantly reduced (almost halved) since 1994. It is probably because of the extremely limited concept and indicator of discouraged workers and the aspect of recent U.S.A. boom. Looking at the trend of Japanese discouraged workers from the result of SLFS (see table 6 in section 2), the ratio of discouraged workers available for work in a narrow sense to the discouraged workers who had reasons for not seeking jobs in a broad sense was about a half or less in total in 1997. Thereafter, the disparity continued to enlarge and for the ratios to all labor force in 1998, the latter was 6.2%, while the former was only 1.9%. The trend of persons not in the labor force desiring jobs but currently not seeking jobs, especially the person discouraged from seeking jobs, has showed a latescent unemployment as "hidden unemployment".
However, limiting it to the person available for work only seems to obscure the fact and hide these diverse movements. Also in the specification of dis couraged workers by OECD, whether or not to introduce the condition of
"availability for work" is under discussion.
1.2 Consideration of unemployment and unstable employment in the
nineteen nineties with ALUs.
In order to check and examine the factors of structural change in the lates- cence of unemployment, this section discusses AUIs (calculations of U indi cators) in the nineteen nineties to consider the particularity of structural change in unemployment and unstable employment in Japan.
Various features of structural change in unemployment and unstable employment of Japan in the nineteen nineties with upsurging unemploy
ment are examined using the AUIs adjusted and calculated from the result of Special Survey of the Labor Force Survey (SLFS). Japanese U indicators (U1 was prepared for 13 unemployment weeks due to a limitation of inter
national comparison data) in table 3(a) and 3(b) were calculated as per American U indicators. Among U indicators, only the following ones were discussed: unemployed persons-related indicators (U1~U5) as visible indi cators and a not labor force indicator of discouraged workers and an employed person indicator of involuntary part-timers (including unem
ployed persons seeking part-time jobs) as invisible indicators. Its coverage
is limited to the some aspect of unemployment and unstable employment.
Japanese U indicators were calculated by Miss. Fuchimoto*"' from the result of SLFS. Japanese U indicators were characterized by significantly high U7 indicator of "discouraged workers" (a form of person not in the labor force desiring jobs but currently not seeking jobs). Based on the spec ification of discouraged workers, indicators of discouraged workers (1) (specification in a broad sense: not seeking jobs because no job seems available) and discouraged workers (2) (specification in a narrow sense:
desiring jobs and available for work) were calculated^®'.
Table 3(a) U indicators (on a basis of Labor force) in Japan (Fuchimoto calculation) (%)
Total (year) 1990 1991 1992 1993 1994 1995 1996 1997 1998
U-1 Long duration unemployment rate 1.2 1.1 1.1 1.7 1.7 1.8 2.0 2.2 2.1
U-2 Involuntary job loser rate 0.6 0.6 0.4 0.7 0.8 0.8 0.8 0.8 1.1
U-3 Unemployment rate for head of households 1.8 1.8 2.1 1.9 2.3 2.5 2.4 2.6 2.9
U-4 Unemployment rate for full-time jobseekers 1.8 1.6 1.8 1.9 2.7 2.6 2.9 2.7 2.9
U-5 Ajusted unemployment rate* 2.5 2.3 2.3 2.7 3.2 3.2 3.5 3.6 3.7
U-6 Labor underutilization rate (narrow) 3.4 3.2 3.7 3.5 4.4 4.3 4.6 4.9 5.2
U-7 Labor underutilization rate (broad) (1) 8.5 8.1 8.5 8.7 10.3 9.9 11.0 10.6 11.0
Labor underutilization rate (broad) (2) 4.8 4.6 4.9 5.0 6.0 6.2 6.6 7.2 7.8
Male (year) 1990 1991 1992 1993 1994 1995 1996 1997 1998
U-1 Long duration unemployment rate 1.0 1.0 1.0 1.0 1.3 1.6 1.8 1.9 1.8
U-2 Involuntary job loser rate 0.6 0.6 0.5 0.7 0.9 0.9 1.0 0.9 1.1
U-3 Unemployment rate for head of households 1.5 1.5 1.5 1.8 2.1 2.2 2.3 2.3 2.6
U-4 Unemployment rate for full-time jobseekers 1.7 1.6 1.7 1.8 2.1 2.6 2.7 2.7 3.0
U-5 Ajusted unemployment rate* 2.1 2.0 1.9 2.1 2.6 2.8 3.0 3.1 3.4
U-6 Labor underutilization rate (narrow) 2.1 2.1 2.0 2.2 2.5 2.8 3.1 3.3 3.6
U-7 Labor underutilization rate (broad) (1) 3.6 3.5 3.5 3.8 4.6 4.8 4.9 5.2 5.7
Labor underutilization rate (broad) (2) 2.7 2.7 2.6 2.9 3.3 3.8 4.0 4.4 4.9
Female (year) 1990 1991 1992 1993 1994 1995 1996 1997 1998
U-1 Long duration unemployment rate 1.5 1.2 1.3 1.7 2.1 2.1 2.3 2.1 1.9
U-2 Involuntary job loser rate 0.6 0.6 0.7 0.8 0.8 0.6 0.6 0.7 0.8
U-3 Unemployment rate for head of households 3.6 3.8 3.3 3.5 3.2 4.6 3.0 4.8 4.9
U-4 Unemployment rate for full-time jobseekers 1.9 1.6 2.0 1.7 2.4 2.6 3.1 2.9 2.5
U-5 Ajusted unemployment rate* 3.2 2.8 2.8 3.5 4.1 3.8 4.1 4.3 4.3
U-6 Labor underutilization rate (narrow) 5.5 5.2 5.2 5.3 6.5 6.3 7.0 7.6 7.7
U-7 Labor underutilization rate (broad) (1) 15.5 14.8 14.7 15.6 17.8 16.7 19.7 18.5 18.6
Labor underutilization rate (broad) (2) 8.2 7.6 7.7 8.0 9.6 9.5 10.7 11.6 12.3
(note) *U-5 indicator is unemployment rate ajusted to U.S. concept of (source) Statistical Bureau, Management and Coordination Agence
Survey of Labor Force Survey (SLFS).
unemployment.
Government, Special
Table 3(b) U indicators (on a basis (Fuchimoto calculation)
of adjusted unemployment rate) in Japan (%)
Total (year) 1990 1991 1992 1993 1994 1995 1996 1997 1998
U-1 Long duration unemployment rate 50 47 47 63 52 56 58 60 55
U-2 Involuntary job loser rate 25 27 17 28 26 25 24 23 28
U-3 Unemployment rate for head of households 73 79 89 73 71 76 70 73 78
U-4 unemployment rate for full-time jobseekers 72 70 76 71 83 81 82 75 78
U-5 Ajusted unemployment rate 100 100 100 100 100 100 100 100 100
U-6 Labor underutilization rate (narrow) 136 142 159 131 136 132 132 136 139
U-7 Labor underutilization rate (broad) (1) 338 354 366 324 321 307 316 295 295
Labor underutilization rate (broad) (2) 193 201 211 186 189 192 189 200 209
Male (year) 1990 1991 1992 1993 1994 1995 1996 1997 1998
U-1 Long duration unemployment rate 50 49 52 47 51 59 61 62 53
U-2 Involuntary job loser rate 29 30 26 35 33 33 32 30 34
U-3 Unemployment rate for head of households 72 78 79 85 81 78 78 76 78
U-4 unemployment rate for full-time jobseekers 83 82 89 86 81 94 90 87 91
U-5 Ajusted unemployment rate 100 100 100 100 100 100 100 100 100
U-€ Labor underutilization rate (narrow) 100 105 107 106 97 103 102 106 106
U-7 Labor underutilization rate (broad) (1) 177 177 184 182 174 173 162 170 169
Labor underutilization rate (broad) (2) 130 135 137 138 125 139 134 143 145
Female (year) 1990 1991 1992 1993 1994 1995 1996 1997 1998
U-1 Long duration unemployment rate 48 43 47 48 53 53 56 48 44
U-2 Involuntary job loser rate 20 23 24 24 20 16 15 16 18
U-3 Unemployment rate for head of households 112 137 114 100 79 120 73 110 115
U-4 unemployment rate for full-time jobseekers 60 58 70 50 60 69 75 66 60
U-5 Ajusted unemployment rate 100 100 100 100 100 100 100 100 100
U-€ Labor underutilization rate (narrow) 172 188 183 154 160 164 170 174 181
U-7 Labor underutilization rate (broad) (1) 482 539 517 452 437 435 477 424 437
Labor underutilization rate (broad) (2) 255 278 271 232 237 247 260 266 287
(source) The same as Table 4(a).
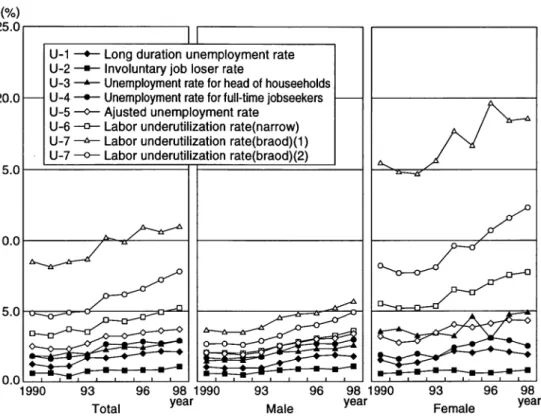
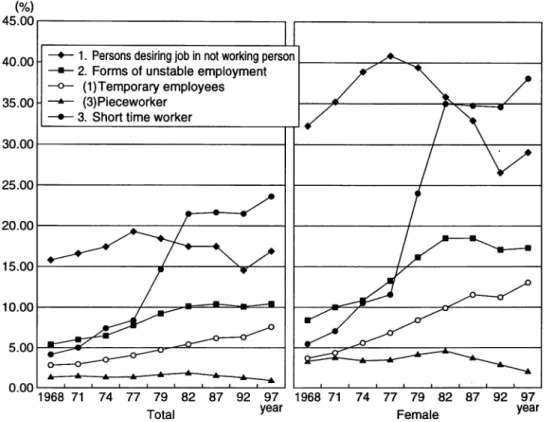
As shown in the profile of fig. 1 (total, male and female), Japanese U indi cators are characterized by the fact that ranges (widths) of U1~U7 for women are wider than those for men; especially for U7 indicator related with discouraged workers (both in a broad sense and a narrow sense), female rate is significantly high. It is found that the latescence of unemploy
ment has been accelerated in regard of discouraged female workers. In
total, during the bubble period of 1990~1992, a decrease or reduced range
of unemployment rate (adjusted unemployment rate) of U5 and other U
indicators was observed, however, values of U indicators have raised along
with deepened post-bubble depression. One U7 indicator (discouraged
workers (1)) on the persons discouraged from working or seeking jobs, a
(%) 25.0 r
20.0
15.0
10.0
0.0
Fig. 1 Chart of U indicators (on a basis of labor force) in Japan
■ Long duration unemployment rate Involuntary job loser rate
Unemployment rate for head of houseeholds Unemployment rate for full-time jobseekers Ajusted unemployment rate
Labor underutilization rate(narrow) Labor underutilization rate(braod)(1) Labor underutilization rate(braod)(2)
1990 93 96 98 1990 93 96 98 1990 93 96 98
Total
year
Male
year
Female year
(source) The same as Table 4(a).
labor underutilization rate in a broad sense, is large both in its level and increase rate: It has raised to 10% level in total. Especially, its female indica tor has increased to 15% or near 20%. Another U7 indicator (discouraged workers (2)) has also increased in spite of low level. U6, a factor of a labor underutilization rate in a narrow sense (indicator of involuntary part- timers), has also continued to increase and its female indicator has far exceeded 10%. U1~U5 are alternative indicators on unemployed person.
US, an adjusted unemployment rate (unemployment rate adjusted to the American concept), has raised to 4% level (the value of females is greater than that of males). U4, an unemployment rate for full-time jobseeker, has increased to 2% level (the value of females is greater than that of males) and U3, an unemployment rate for head of households, has raised to 2%
level (especially, the value of males already reached 2% level in 1994). U1
of long-duration unemployment rate, an indicator of unemployment seri ousness, has increased since 1993 to reach 2% level. U2, an involuntary job loser rate, has raised since 1994 and its male rate reached 1.1% in 1998.
Table 3(b) shows U indicators assuming the adjusted unemployment rate = 100 (on a basis of adjusted unemployment rate), indicating the transi tion of disparity between unemployment rate and each indicator to charac terize the structural change of unemployment. Discouraged workers tend to
relatively decrease in good times and increase in hard times. In good times (bubble period), the disparity of U7 indicator of discouraged workers rela tively increased with a decrease of unemployment rate and it significantly reduced during post-bubble period of 1992—1993. Due to deepened depression, an increase of unemployment rate U5 and far more increase of discouraged workers (females in particular) caused the disparity of U7 to incline toward expansion since 1994. Associated with deepened depression and serious unemployment situation (increase of unemployment rate since 1993), an increase of persons not in the labor force desiring jobs but cur rently not seeking jobs (discouraged workers), especially male workers desiring jobs and available for work has been observed.
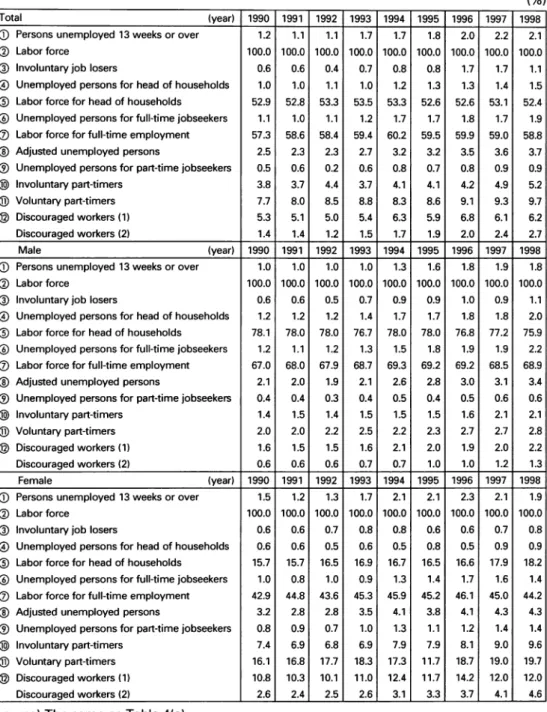
Looking at various factors of change in the unemployment structure with U
indicator-related indicators (table 4), a majority of indicators have been
worsened since 1993—1994. For visible unemployment indicators (unem
ployed person-related indicators), the indicator of long-duration unem
ployed person increased from 1.1% during bubble period to 1.7% in 1993
and to 2.1% in 1998. The indicator of involuntarily job loser increased from
0.6% to 1.1%. For unemployed person for head of households, the indicator
of males is greater than that of females, having increased from 1.1% to
1.5%. The indicator of unemployed person for full-time jobseekers became
1.7% in 1994, then 1.9% in 1998. For unemployed person for part-time job-
seekers, the increase rate of females is greater than that of males. For invis
ible unemployment indicators, an increase of involuntary part-timers,
especially that of females is remarkable. For discouraged workers, the
weight of females is overwhelmingly high. Although the composition ratio
decreased during bubble period, it increased during depression period. The
indicator of discouraged workers (1) was low during bubble period; how
ever, it increased to 6.2% in total and 12.0% for females in 1998. Associated
with elicited unemployment (unemployed person and involuntarily job
Table 4 U indicator-related indicators in Japan (Fuchimoto calculation)
(%)
Total (year) 1990 1991 1992 1993 1994 1995 1996 1997 1998
0 Persons unemployed 13 weeks or over 1.2 1.1 1.1 1.7 1.7 1.8 2.0 2.2 2.1
0 Labor force 100.0 100.0 100.0 100.0 100.0 100.0 100.0 100.0 100.0
0 Involuntary job losers 0.6 0.6 0.4 0.7 0.8 0.8 1.7 1.7 1.1
0 Unemployed persons for head of households 1.0 1.0 1.1 1.0 1.2 1.3 1.3 1.4 1.5
0 Labor force for head of households 52.9 52.8 53.3 53.5 53.3 52.6 52.6 53.1 52.4
0 Unemployed persons for full-time jobseekers 1.1 1.0 1.1 1.2 1.7 1.7 1.8 1.7 1.9
0 Labor force for full-time employment 57.3 58.6 58.4 59.4 60.2 59.5 59.9 59.0 58.8
0 Adjusted unemployed persons 2.5 2.3 2.3 2.7 3.2 3.2 3.5 3.6 3.7
0 Unemployed persons for part-time jobseekers 0.5 0.6 0.2 0.6 0.8 0.7 0.8 0.9 0.9
(g) Involuntary part-timers 3.8 3.7 4.4 3.7 4.1 4.1 4.2 4.9 5.2
0 Voluntary part-timers 7.7 8.0 8.5 8.8 8.3 8.6 9.1 9.3 9.7
0 Discouraged workers (1) 5.3 5.1 5.0 5.4 6.3 5.9 6.8 6.1 6.2
Discouraged workers (2) 1.4 1.4 1.2 1.5 1.7 1.9 2.0 2.4 2.7
Male (year) 1990 1991 1992 1993 1994 1995 1996 1997 1998
0 Persons unemployed 13 weeks or over 1.0 1.0 1.0 1.0 1.3 1.6 1.8 1.9 1.8
0 Labor force 100.0 100.0 100.0 100.0 100.0 100.0 100.0 100.0 100.0
0 Involuntary job losers 0.6 0.6 0.5 0.7 0.9 0.9 1.0 0.9 1.1
0 Unemployed persons for head of households 1.2 1.2 1.2 1.4 1.7 1.7 1.8 1.8 2.0
0 Labor force for head of households 78.1 78.0 78.0 76.7 78.0 78.0 76.8 77.2 75.9
0 Unemployed persons for full-time jobseekers 1.2 1.1 1.2 1.3 1.5 1.8 1.9 1.9 2.2
0 Labor force for full-time employment 67.0 68.0 67.9 68.7 69.3 69.2 69.2 68.5 68.9
0 Adjusted unemployed persons 2.1 2.0 1.9 2.1 2.6 2.8 3.0 3.1 3.4
0 Unemployed persons for part-time jobseekers 0.4 0.4 0.3 0.4 0.5 0.4 0.5 0.6 0.6
0 Involuntary part-timers 1.4 1.5 1.4 1.5 1.5 1.5 1.6 2.1 2.1
0 Voluntary part-timers 2.0 2.0 2.2 2.5 2.2 2.3 2.7 2.7 2.8
0 Discouraged workers (1) 1.6 1.5 1.5 1.6 2.1 2.0 1.9 2.0 2.2
Discouraged workers (2) 0.6 0.6 0.6 0.7 0.7 1.0 1.0 1.2 1.3
Female (year) 1990 1991 1992 1993 1994 1995 1996 1997 1998
0 Persons unemployed 13 weeks or over 1.5 1.2 1.3 1.7 2.1 2.1 2.3 2.1 1.9
0 Labor force 100.0 100.0 100.0 100.0 100.0 100.0 100.0 100.0 100.0
0 Involuntary job losers 0.6 0.6 0.7 0.8 0.8 0.6 0.6 0.7 0.8
0 Unemployed persons for head of households 0.6 0.6 0.5 0.6 0.5 0.8 0.5 0.9 0.9
0 Labor force for head of households 15.7 15.7 16.5 16.9 16.7 16.5 16.6 17.9 18.2
0 Unemployed persons for full-time jobseekers 1.0 0.8 1.0 0.9 1.3 1.4 1.7 1.6 1.4
0 Labor force for full-time employment 42.9 44.8 43.6 45.3 45.9 45.2 46.1 45.0 44.2
0 Adjusted unemployed persons 3.2 2.8 2.8 3.5 4.1 3.8 4.1 4.3 4.3
0 Unemployed persons for part-time jobseekers 0.8 0.9 0.7 1.0 1.3 1.1 1.2 1.4 1.4
0 Involuntary part-timers 7.4 6.9 6.8 6.9 7.9 7.9 8.1 9.0 9.6
0 Voluntary part-timers 16.1 16.8 17.7 18.3 17.3 11.7 18.7 19.0 19.7
0 Discouraged workers (1) 10.8 10.3 10.1 11.0 12.4 11.7 14.2 12.0 12.0
Discouraged workers (2) 2.6 2.4 2.5 2.6 3.1 3.3 3.7 4.1 4.6
{source) The same as Table 4(a).
loser, etc.) due to "Heisei" depression, a rapid increase of unstable employ ment, especially involuntary female part-timers and discouraged workers is observed. Along with the elicitation of unemployment, the latescence of unemployment is deepened.
2. Employment & unemployment statistics and unemployment &
unstable employment indicators
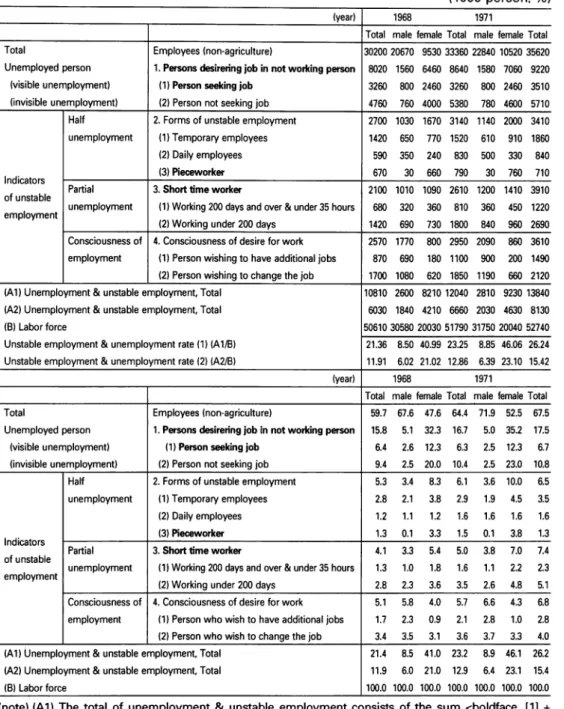
AUIs (Japanese U indicators) can only indicate a limited aspect of structural change in unemployment. The analysis of various factors of structural change in unemployment and unstable employment and systematic fac tors of visible and invisible unemployment structures can be examined from the results of two investigation methods: the Special Survey of the Labor Force Survey (SLFS) and Employment Status Survey (ESS). SLFS is a method of labor force approach for current employment status during one week of the survey, while ESS is a gainful worker's approach for usual employment status. These two methods are different in the basic concept and specification of employment status. SLFS (performed every February until 1982, in June in 1983 and every March after 1984) is a special survey supplementing the indicators of unemployed person, unemployment rate and unemployment-related indicators published by Labor Force Survey (every month) for the purpose of investigating the "status of national unemployment and unstable employment". It can indicate diversified unemployment and unstable employment indicators of current status. On the other hand, ESS is a structural survey performed once every few years on usual employment and unstable employment status with a large num
ber of investigation samples, indicating more structurally diversified aspects and indicators than SLFS. As proposed by the thirteenth ICLS of ILO, the establishment of statistics with two survey methods (labor force approach and gainful worker's approach) on the employment status has been internationally recommended. In Japan, the employment and unem ployment statistics in both methods have been prepared since early post war period, providing two statistical systems, which are internationally
noticeable and well established.
This section examines the diversification of Japanese employment forms
(structural change of employed persons by two sectors and by industries)
first and then the change of visible and invisible factors for Japanese
unemployment and unstable employment structure from various results of SLFS and ESS, statistics of two survey approaches.
2.1 Diversification of employment forms — change of employed per sons by two sectors and by employment forms
The latescence of unemployment and diversified forms of unstable employment are manifested through computerization, information, and growth of economic services, intensified division of labor, labor force regi mentation and change of employment structure. Table 5(a)(b) re-classifies the working persons (employed persons) by industry into two sectors (goods sector and service sector) based on ESS^^'. It provides (1) sector by industries and by status in employment and (2) sector by industries and by employment forms (summary tables of 1968, 1982 & 1999 and their distribu tion ratio are only listed due to limited paper size). One cause of unemploy ment latescence as well as unemployment and unstable employment in Japan was the existence of small-size self-employed persons and family workers. The increase of employment and unstable employment and diver sified employment are accelerated through fluctuation in the regimentation of working person by two sectors and by industries. Between the goods production (industrial production)-intensive rapid growth period of 1968~1974 and the subsequent low growth period, there was a great change in the structure of working person. Especially, after 1987 when the service sector exceeded a majority of employed person, the weight of ser vice sector such as wholesale and retail trade service industry (personal &
business services and educational & medical services, etc.) and financial
and insurance services has been increased. Workers in non standard andunstable employment including temporary and daily-hired workers, part- timers, "Shokutaku" (workers with side jobs) and dispatched workers have been rapidly increased in various industries of service sector, with a notable fact that almost of them are women. The latescence of unemploy ment and diversified unstable employment are accelerated through intensi fied division of labor and changing process of employment structure
regimentation by industries, accumulating the imbalance between the
restructurization of female division of labor and the allocation of work.