*Department of Biomedical Engineering, Doshisha University, 1-3 Miyakodani, Tatara, Kyotanabe, Kyoto, 610-0394 Telephone: +81-774-65-6467,Fax: +81-774-65-6019, E-mail: [email protected]
Development of 3-Dimensional Blood Vessel Imaging System Using Stereo Method for Laparoscopic Surgery
Eiji NAKAMACHI*, Kirara KONO*, Masaki NAKAGAWA*, Yusuke MORITA*
(Received December 15, 2017)
In this study, we developed a miniature and highly precise 3D blood vessel imaging system for use in the minimally invasive laparoscopic surgery. In the conventional optical system used in the laparoscopic surgery, obtaining a highly precise image of the artery is difficult because the peripheral bio-tissues of the artery disturb, disperse, and refract the propagation of light waves. To overcome this problem, near-infrared (NIR) light, two complementary metal-oxide semiconductor (CMOS) camera modules, and an image processing technique along with a stereo method are used to detect the 3D artery position. NIR light shows high permeability for bio- tissues and high absorbance for hemoglobin, thereby allowing blood vessels to be imaged and observed by their black color. To sharpen and enhance the image quality, unsharp-mask processing was employed. The 3D blood vessel imaging system is validated through an ex-vivo experiment. Using the luminance distribution of the images, the depth and the diameter of blood vessel can be measured. The position of the artery detected and the diameter obtained by our proposed system demonstrated good agreement with the true position of a pig’s gastroepiploic artery specimen, thereby confirming the benefits and precision of our system.
.H\ZRUGV:laparoscope, blood vessel search, NIR imaging, gastroepiploic artery, stereo method
,QWURGXFWLRQ
Laparoscopic surgery, a minimally invasive technique, is widely used for the treatment of stomach cancer, gallbladder extraction, and uterine myoma resection1,2). During laparoscopy surgery, the surgeon makes an incision measuring 5-10 mm in diameter in the abdomen, inserts a surgical weapon and a camera through the opening, and performs the operation using the obtained image information. A serious disadvantage of laparoscopic surgery is that it requires an extremely good surgical technique to detect a lesioned area and to immediately decide the required treatment by watching a 2D image. The poor imaging quality in laparoscopic surgeries very often leads to adverse events such as cutting of the arteries in the abdominal cavity often occur.
These errors can cause serious bleeding and are associated with a risk of death. As the diameter of target blood vessel is 1-3 mm, the sub millimeter target blood vessel is 1-3 mm, the sub millimeter accuracy is need. To eliminate such errors, a blood vessel searching (BVS) system is required to precisely determine the realtime positions of arteries during surgery3). Several imaging modalities, such as computed tomography (CT), magnetic resonance imaging (MRI) and ultrasonic imaging system, are currently available to provide clear and noninvasive images of blood vessels4). However, as CT and MRI scans are significantly large in size and are of huge cost and ultrasonic imaging system requires a highly skilled and experienced operator to obtain these techniques are not user friendly. The optical devices,
compared to these imaging modalities, have advantages of high accuracy, small size, and being user friendly. In addition, there are several other optical devices for blood vessel research that use green light. Compared to near- infrared (NIR) light, the green light has high hemoglobin absorption. Therefore, it can be used for small blood vessel research on the tissue surface, but it is not suitable for deep blood vessel research. However, the NIR light, which we have adopted, has high transmission in tissue;
therefore it can be used in deep blood vessel research.
Recently, imaging techniques based on light have attracted considerable attention. NIR light, of wavelengths between 600 and –1000 nm, is well known to show high permeability in bio-tissues5). Previously, a number of studies have focused on noninvasive living body imaging using light6,7). These researches could be applied to blood sampling assistance, automatic blood sampling for fingers, arms, or other parts of the human body, and also, in surgery to prevent bleeding. As hemoglobin absorbs visible as well as NIR light, when blood vessels and skin are illuminated, the former can be detected by their color contrast8). For example, Nakamachi et al. detected the blood vessel positions in the finger using an automatic blood sampling system, which is a combination of a stereoscopic method and an auto-focusing method using NIR transmitted light9).
In this study, we developed a novel multi- wavelength reflected light BVS system. In this system, two cameras and a multi-wavelength light source are mounted at the end of an endoscopic tube. The four main objectives of this study are as follows: (1) generating phantoms having optical characteristics similar to those of the pig’s gastroepiploic artery and skin of the greater omentum, including the fat layer; (2) visualizing and highlighting the arteries in the phantom using NIR light image processing as a part of the newly developed BVS system; (3) developing an accurate estimation technique for detecting the 3D position of blood vessels using the stereoscopic method; and (4) producing 3D blood vessel model from the measurements of a pig’s gastroepiploic
artery by our BVS system.
0DWHULDOVDQG0HWKRGV 2.1 Gastroepiploic artery phantom
Phantoms having the same structure and optical properties to substitute for the tissue in the human fat are generated in order to confirm the precision and benefits of our system. A blood vessel in phantom was located at a depth of 1.0-3.5 mm, with a diameter of approximately 1.0-3.5 mm. The optical properties characterized were the absorption coefficient μa, scattering coefficient μs, anisotropy parameter g, and relative n10,11). As the anisotropy parameter and relative values of human soft tissue show very small differences, the scattering coefficient μs and absorption coefficient μa were considered as the dominant parameters to examine in order to determine the errors in multi-wavelength light tissue imaging.
2.2 Fabrication of laparoscopic camera system 2.2.1 Stereo method
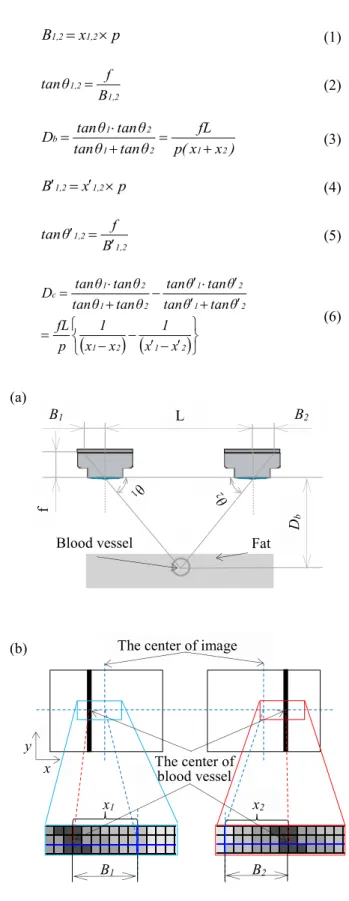
The stereoscopic method was adopted to detect the blood vessel position and to measure the surface shape of the living tissue. Consequently, the 3D blood vessel model is generated. Accordingly, multiwavelength lights are used to evaluate the distance Db between the center of the blood vessel’s circular cross section and the camera, as shown in Fig. 1(a). Similarly used slit light is used to determine the distance Db between the biological surface and the camera, as shown in Fig. 1(a). This stereoscopic method allows miniaturization of the device and quick measurements.
The blood vessel is visualized using reflected light, and the blood vessel position is calculated using the evaluated center positions of the blood vessel in the complementary metal-oxide semiconductor (CMOS) digital images. Fig. 1(a) shows a schematic view of the stereoscopic method, in which L is the distance between the two CMOS cameras (PPV404C; Asahi Denshi Inc.), f is the focal length, Db is the vertical distance between
the center of the blood vessel and the line drawn between the two center points of the camera lenses, and θ1 and θ2
are the angles between the light axes from the center of the blood vessel and the horizontal line, as shown in Fig.
1(a). The specifications of the CMOS camera and the digital image sensor are as follows: L = 9.00 mm, f = 1.41 mm, lens diameter = 3 mm, pixel size p = 5.55 μm, digital image = 8-bit, and grayscale value range = black (0) to white (255). The 400×400 resolution images of the blood vessel and mucosa layer obtained by the CMOS sensor were stored as JPEG image files. Stereo blood vessel images are obtained and the center of the blood vessel in each image is evaluated using the luminance distributions and template matching method. Fig. 1(b) shows the distances, B1 and B2 between the center of the image and the center of the blood vessel, derived from the pixel number and Eq. (1). The terms x1 and x2 denote the mean number of pixels, which are located between the center of the blood vessel and the center of the left and right images as shown in Fig. 1 (a) and (b), respectively. Distances B1
and B2, and the angles θ1 and θ2, were evaluated using Eq.
(2). Finally, the position of the blood vessel Db is evaluated using Eq. (3).
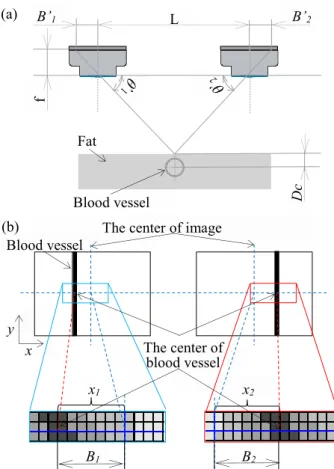
Similarly, the surface position of the tissue is estimated using the evaluated center positions of the slit light in the CMOS digital images. Fig. 2(a) shows a schematic view of the stereoscopic method to measure the surface shape. Fig. 2(b) shows the distances, B1 and B2
between the center of the image and the center of the blood vessel, derived from the pixel number and Eq. (4).
The terms x’1 and x’2 represent the mean number of pixels, which are located between the center of the blood vessel and the center of the left and right images, as shown in Fig. 2 (a) and (b), respectively. Distances B’1 and B’2, and the angles θ’1 and θ’2, were evaluated using Eq. (5).
Finally, the depth of the blood vessel Dc is calculated using Eq. (6).
Fig. 1. Stereo method and pixel configuration of blood vessel image; (a) schematic view of stereo method, (b) pixel configuration of blood vessel image.
p x
B1,2 1,2 (1)
2 , 2 1 ,
1 B
θ f
tan (2)
) x x ( p
fL θ
tan θ tan
θ tan θ D tan
2 1 2 1
2 b 1
(3)
p x
B1,2 1,2 (4)
2 , 1 2 ,
1 B
θ f
tan (5)
2 1 2 1
2 1
2 1 2
1 2 c 1
x x
1 x
x 1 p fL
θ tan θ tan
θ tan θ tan θ tan θ tan
θ tan θ D tan
(6)
(a)
(b)
L
f
B1 B2
Db
Blood vessel Fat
The center of image
The center of blood vessel
x1 x2
B1 B2
x y
Fig. 2. Stereo method and pixel configuration of slit light image; (a) schematic view of stereo method,
(b) pixel configuration of slit light image.
2.2.2 Determination of the center of the blood vessel Template matching is adopted to determine the image sharpness. The templates were created under the assumption that luminance distributions of blood vessel are a convex-downward quadratic curve, as indicated by the red curve in Fig. 3, where the luminance distribution is shown as a blue line. Fig. 4(a) and (b) show the results of template matching. Fig. 4(a) presents the distribution of residual error obtained by template matching calculation and indicates two local maximum points, which correspond to the blood vessel position. Fig. 4(b) portrays the derivatives distribution of the residual error.
Fig. 4(b) shows that the point where the derivative value becomes zero is set as the center of the blood vessel.
Fig. 3. Schematic of light-section method when incident light is reflected by the forearm vein.
Fig. 4. The template of blood vessel; (a) The distribution of residual error, (b) The derivatives distribution of residual error.
2.2.3 Determination of the center of the slit light To measure the biological surface shape, the center of the slit light should be determined. The irradiation position with slit light is unclear. Living tissue is a translucent medium. Therefore, the irradiation part with slit light is unclear owing to the internal scattered light when the living tissue is irradiated with slit light. To determine the center of the slit light, the influence of the internal scattered light has to be eliminated. In this study, (a)
(b)
0 50 100 150 200 250
0 200 400 600
Luminance number
Pixel number
Template Blood Vessel
0 4000 8000 12000 16000
0 200 400 600
Residual error number
Pixel number (a)
-90 -60 -30 0 30 60
450 460 470 480 490 500
Derivative number (b)
Pixel number L
f
B’1 B’2
DcBlood vessel Fat
The center of image
The center of blood vessel
x1 x2
B1 B2
x y
Blood vessel
we predict the internal scattered light beforehand, and extract the irradiated position with slit light by eliminating the influence of internal scattered light. We used the theoretical formula of internal scattered light model to predict the internal scattered light. Eq. (7) presents the theoretical formula of the internal scattered light model12). It is likely to express the formula of the internal scattered light model as a function of the absorption coefficient μa, scattering coefficient μs, anisotropy parameter g, and relative n. The center of slit center is determined by eliminating the influence of internal scattered light using the image, and measuring the surface shape.
2.2.4 Image processing to highlight the blood vessel at the deep depth
In this study, as the center of the blood vessel is not determined, the position of the blood vessel could not be precisely measured using our system. Image processing to obtain high contrast to blood vessel part and fat tissue part are prescribed. LoG Filter, sobel filter, and unsharp filter are classic methods to highlight a blood vessel13, 14). As the decrease in the luminance in the position of a blood vessel is insignificant, it is difficult to highlight a blood vessel by conventional imaging processes. However, our system needs to detect the small decrease in luminance and highlight the only blood vessel part to obtain a clear blood vessel image. Our system detects a small decrease in luminance by subtraction, i.e., our system uses the difference in the optical characteristics between two wavelengths of light, 545 nm and 850 nm, and highlights the blood vessel part.
2.2.5 Light propagation analysis for blood vessel diameter estimation
As fat has a high scattering coefficient, the diameter of the blood vessel cannot be determined using NIR imaging. Instead of diameter, the peak width of the differential value in the luminance distribution of the blood vessel is used. The relationship between depth,
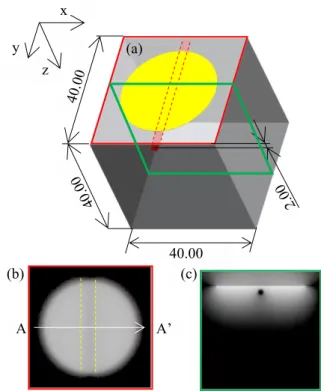
diameter, and the peak width is analyzed using Jacques et al.’s Monte Carlo method, which is adopted to simulate the light propagation in the greater omentum15). The analytical model used in this analysis is shown in Fig. 5 (a). The absorption coefficient μa, scattering coefficient μs, anisotropy parameter g, and relative n were used in this simulation16). Using this simulation, the luminance distribution in the 3D region is obtained, as shown in Fig.
5(b), and (c). Therefore, the diameter of the blood vessel is estimated from the peak width by examining the relationship between depth, diameter, and the peak width.
Fig. 5. Results of optical propagation analyses (unit: mm).
5HVXOWVDQG'LVFXVVLRQ 3.1 Fabrication of phantom
The greater omentum can be considered a fat tissue.
The optical properties of pig’s fat were considered to adequately reflect those of the human greater omentum.
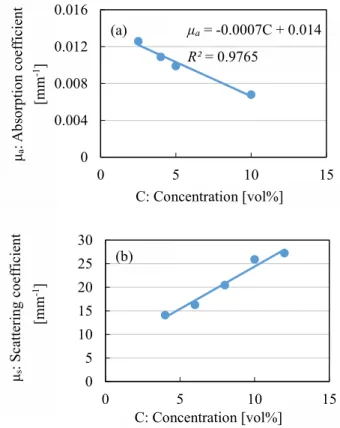
Table 1 shows the μs and μa values of fat. To simulate the μs and μa values of the human greater omentum, 7.00 vol% of intralipid, an artificial fat emulsion that is widely used as a bio-tissue phantom are used17). Fig. 6 (a) and (b) show the relationships between μs and μa, respectively,
z x y
A A’
(c)
(b) 40.00
(a)
and the intralipid concentration (unit: vol%). Table 1 shows the μs and μa values of the 7.00 vol% intralipid phantom18), which demonstrated good agreement with the fat tissue. Additionally, gelatin (G9382-100G, Sigma;
concentration: 0.1 g/mL) is used to construct the solid structures19). As the artery shows high light absorption, a graphite stick with an appropriate μa value is adopted to imitate the artery in our phantom.
Fig. 7 shows the fat phantoms, in which a 1.5 mm diameter hemoglobin solution was embedded in the imitated greater omentum at 1.5-3.0 mm depth as the imitated artery. The phantom was used for the accuracy estimation and validation of our newly developed laparoscopic camera system.
Fig. 6. Relationships between optical properties and concentrations of intralipid; (a) Absorption coefficient of intralipid, (b) Scattering coefficient of intralipid.
Table 1. Processed image and luminance distribution of forearm.
Absorption coefficient [mm-1]
Scattering coefficient [mm-1]
Fat tissue 19.3 0.009
Intralipid
(7.00 vol%) 19.0 0.009
Fig. 7. Drawings of phantoms of artery and fat layer (unit: mm).
3.2 Assembling of the laparoscopic camera system Based on the design of the BVS device implemented in the laparoscopic camera system, a fiber LED light source is installed with 545 nm and 850 nm wavelength and two cameras with 4-mm diameter and a rod lens to irradiate with slit light at the edge of the laparoscopic tube. To emphasize the irradiation, four NIR-LED lights were added to the stereo cameras, as shown in Fig. 8. The distance between the stereo cameras (L value: Fig. 1(a)) is set at 9.00 mm, as shown in Fig. 8.
Fig. 8. Blood vessel imaging system.
3.3 Measuring the depth of the blood vessel in the bio- tissue phantom
The depth of the blood vessel in the phantom is measured to evaluate the precision measurement for our 0
0.004 0.008 0.012 0.016
0 5 10 15
μa = -0.0007C + 0.014 R² = 0.9765
C: Concentration [vol%]
μa: Absorption coefficient [mm-1]
(a)
0 5 10 15 20 25 30
0 5 10 15
C: Concentration [vol%]
μs: Scattering coefficient [mm-1 ]
(b)
5.0 5.0 40.0
40.0
Blood vessel Fat
1.5~3.0 10.0
x y
z x
z y
(Bar=3.0 mm)
Cameras
Fiber Rod lens
Cameras Fiber
Rod lens
system. An image of the phantom is taken and the depth of the blood vessel with the phantom that set a blood vessel at a depth of 1.5-3.5 mm is measured at five points.
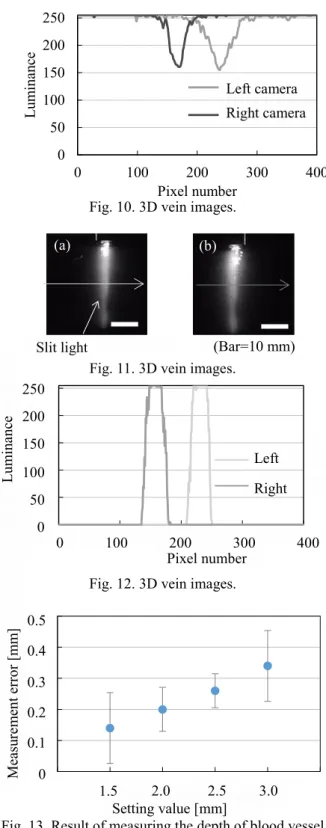
Fig. 9 (a) and (b) shows the image of the phantom that is irradiated with 545 nm and 850 nm light. Fig. 9 (c) shows the image that is performed subtraction process with 545nm and 850 nm image. In this study, the luminance distribution of blood vessel image is used to detect the position of blood vessel. Fig. 10 shows the luminance distribution of the image shown in Fig. 9 (c). Our system irradiates the phantom with slit light to measure the surface sharpness. Fig. 11 shows the image in which the slit light irradiate the phantom with the stereo camera system. Fig. 12 shows the luminance distribution in red and blue lines. In Eq. (5), the depth of blood vessel is measured using the luminance distribution in Fig. 10 and Fig. 12. Fig. 13 shows the measurement error between the set value and the result of measuring the depth of the blood vessel. In Fig. 13, the measuring precision of our system is less than 20% base on the diameter of the blood vessel.
Fig. 9. Image of blood vessel; (a) 545 nm, (b) 850 nm and (c)image processing (Bar=10 mm).
Fig. 10. 3D vein images.
Fig. 11. 3D vein images.
Fig. 12. 3D vein images.
Fig. 13. Result of measuring the depth of blood vessel (N=5, ±S.D.).
3.4 Estimating the blood vessel diameter
As the skin has a high scattering coefficient, the diameter of the blood vessel cannot be determined using blood vessel imaging. The peak width (W) of the differential value in the luminance distribution of the Blood vessel
(a)
(b)
(c)
Pixel number
Luminance
0 100 200 300 400
250 200 150 100 50 0
Left Right
Measurement error [mm]
Setting value [mm]
1.5 2.0 2.5 3.0 0
0.1 0.2 0.3 0.4 0.5
0 50 100 150 200 250
0 100 200 300 400
Luminance
Pixel number
Right camera Left camera
(Bar=10 mm) Slit light
(a) (b)
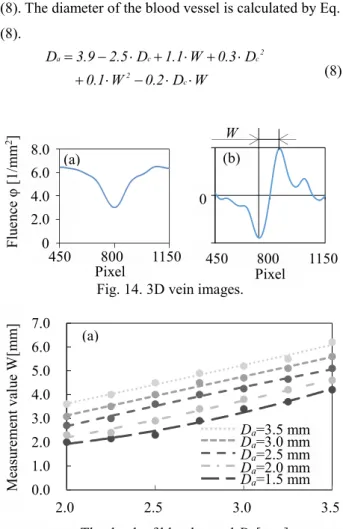
blood vessel is used instead of the diameter. Fig. 14(a) shows the luminance distribution of the blood vessel image at a depth of 2.0 mm. Fig. 14(b) shows the result of differentiating the image of the blood vessel. Fig. 14(b) demonstrates a model we created that set the blood vessel at a depth of 2.0 mm ~ 3.5 mm with a diameter of 1.5 mm
~ 3.5 mm and analysis with the model so that we examine the correlation of the diameter and the peak width. Fig.
15(a) shows the relationship between the peak width and the depth of the blood vessel. Furthermore, Fig. 15(b) shows the relationship between the peak width and the diameter of blood vessel, which was obtained from our simulation results. From Fig. 15(a) and (b), a high correlation between the diameter (Da), and, depth of the blood vessel (Dc) and the peak width (W) is confirmed.
Therefore, the diameter of the blood vessel is approximated by an approximate equation, shown in Eq.
(8). The diameter of the blood vessel is calculated by Eq.
(8).
Fig. 14. 3D vein images.
3.5 Estimating the blood vessel diameter
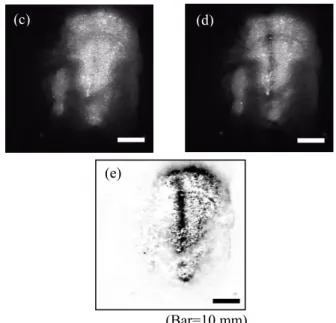
We validated the newly developed laparoscopic camera system using a pig’s gastroepiploic artery and the greater omentum. The stomach of a pig has a similar size and physiological function as that of humans. A two-year- old pig is used, and its artery had similar optical characteristics to the human artery. The peritoneum on the outer wall of the stomach consists of visceral fat. The gastroepiploic artery running inside the greater omentum was the target of this study. To imitate blood, 0.15 g/ml of hemoglobin solution (0.15 g/ml) was poured into the artery. A 40 × 40 mm sheet of greater omentum, including the artery, was cut out as a specimen for the experiment, as shown in Fig. 16(a) and (b). An image of the artery in the pig was captured using our laparoscopic camera system, as shown in Fig. 6. The images with 545 nm and 850 nm were captured using the same camera system, as shown in Fig. 16(c) and (d). Image processing using the subtraction processing was performed to enhance the sharpness of the artery image, as shown in Fig. 16(e). Fig.
17(a) and (b) shows the blood vessel image by stereoscope. Fig. 17(c) and (d) shows the irradiated image by scanning the slit light. The surface shape was measured in 1.0 mm intervals at 15 points by scanning the slit light in a range of 15.0 mm. Fig. 18 (a) and (b), shows the obtained surface shape by 3D scanners, and the obtained surface shape by our system. Moreover, Fig. 19 (8)
The depth of blood vessel Dc [mm]
Measurement value W[mm]
0.0 1.0 2.0 3.0 4.0 5.0 6.0 7.0
2.0 2.5 3.0 3.5
Da=3.5 mm Da=3.0 mm Da=2.5 mm Da=2.0 mm Da=1.5 mm
0.0 1.0 2.0 3.0 4.0 5.0 6.0 7.0
1.5 2.0 2.5 3.0 3.5
The diameter of blood vessel Da [mm]
Measurement value W [mm]
Dc=3.5 mm Dc=3.0 mm Dc=2.5 mm Dc=2.0 mm
450 800 1150 Pixel
Pixel
0
(a) (b)
W
Fluence φ [1/mm2]
8.0 6.0 4.0 2.0
0 450 800 1150
Fig. 15. (a) Relationship between peak width and the depth blood vessel and (b) relationship between peak width and the diameter of blood vessel.
(a)
(b)
W D 2 . 0 W 1 . 0
D 3 . 0 W 1 . 1 D 5 . 2 9 . 3 D
2 c
c2 c
a
shows the surface shape measurement results of the surface shape obtained independently from 3D scanners and our system in y = 24.0. From Fig. 19, measurement error is maximum at 0.6 mm. Owing to the measuring error, it is considered that the concavo-convex shape affected the measurement value. While measuring the surface shape, the surface reflection component was calculated using an internal scattering model in Eq. (7).
However, the internal scattering model cannot correspond to the concavo-convex shape because the internal scattering model assumes a plane shape. Therefore, Eq.
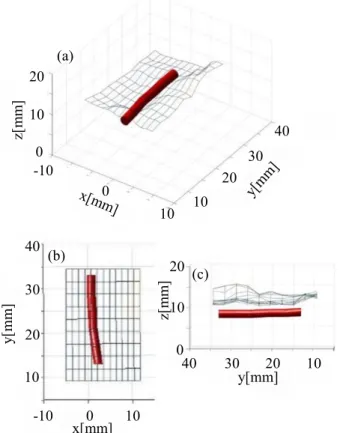
(7) is transformed in consideration of the concavo-convex shape. It is likely to measure in consideration of the concavo-convex shape by creating a model based on the result of the first measurement again. Fig. 20 shows the results of the measurement using the model in consideration of the concavo-convex shape. From Fig. 20, the maximum measurement error is at 0.3 mm, and the precision of the surface shape measurement of our system improved. Fig. 21 shows the results of three-dimensional vascular imaging performed blood vessel position measurement and vascular diameter measurement in y = 24.0. The position where the distance from the surface to the center of the blood vessel becomes minimum was considered the depth of blood vessel. The measurement result depth is 2.6 mm. The depth of pig’s greater omentum is 2.3 mm measured with calipers. The measurement error is 0.3 mm. Finally, Fig. 21 shows a three-dimensional blood vessel imaging model based on measured values. Accordingly, the applicability of our laparoscopic camera system to 3D blood vessel imaging is confirmed when the blood vessel exists inside the bio- tissue.
Fig. 16. Bio-tissue specimen for blood vessel searching system; (a) Photo of grater-omentam specimen, (b) Photo of pig’s stomach, (c) 545 nm, (d) 850 nm, (e) image process.
Fig. 17. Stereo images of blood vessel and slit light;
(a), (c) Left camera, (b), (d) Right camera.
(Bar=10 mm)
(c) (d)
(e)
Blood vessel Blood vessel
(a) (b)
Slit light Slit light
(Bar=5 mm)
(c) (d)
(a) (b)
10mm
Fig. 18. The result of measuring the surface sharp in the pig’s fat; (a) our system, (b) 3D scanner.
Fig. 19. The result of 3D imaging (y=24 in Fig. 18 (a) and (b)).
Fig. 22. 3D blood vessel imaging; (a) x-y-z coordinates, (b) x-y and (c) y-z.
15 10 5 0 5
10 15 20 25
30 35
5 10 -5 0
-10
z[mm]
15 10 5 0
5 10 15 20
25 10 15
30 -5 0 5
z[mm]
35 -10
12 10 8 6 4
2 -4 -2 0 2 4 6 8 10
x[mm]
z[mm]
The result of measurement 3D scanner
z[mm]
x[mm]
12 10 8 6 4 2 0
-4 -2 0 2 4 6 8 10
z[mm]
x[mm]
The result of measuring surface sharp
3D scanner
20 10 0
0
10 -10
40 30 10
20
z[mm]
40 30 20 10
0 10 -10 x[mm]
y[mm]
30 40 20 10
0 20 10
z[mm]
y[mm]
15
3D scanner With correction (a)
(b)
(a)
(b) (c)
-4 -2 0 2 4 6 8 10
12 10 8 6 4 2
Fig. 20. The result of 3D imaging with compensating surface sharp (y=24).
Fig. 21. The result of blood vessel imaging (y=24).
&RQFOXVLRQ
We developed and validated a new laparoscopic camera system to measure the position and diameter of a pig’s gastroepiploic artery, which lies inside the greater omentum, a fat layer, mimicking the human gastroepiploic artery. Our study revealed the following important findings:
(1) The phantom that imitates the structure and optical properties of gastroepiploic artery and fat are fabricated
(2) Our system detect the small decreasing of luminance by subtraction processing, using the difference of optical characteristics between two wavelengths light, 545 nm and 850 nm, and highlight the blood vessel part.
(3) A high correlation between the diameter, the depth of blood vessel and the peak width are confirm.
Therefore, we approximate the diameter of blood vessel by an approximate equation.
(4) The results of the blood vessel depth measurement by stereo method, measurement error was within 20% of each vessel diameter. Further, by removing the influence of the internal scattering, the accuracy of our system was improved 3-dimensional blood vessel imaging.
Consequently, the validity of our 3D blood vessel imaging system for a blood vessel located inside the bio- tissue is confirmed.
5HIHUHQFHV
1) A. F. Durrani, G. M. Preminger, “Three-Dimensional Video Imaging for Endoscopic Surgery”, Comput. Biol.
Med., 25[2], 237-247 (1994).
2) S. M. Christopher and A. R. Beth, “Image Display in Endoscopic Surgery”, Journal of the Society for Information Display, 15[6], 349-356 (2007).
3) E. Nakamachi, “Development of Automatic Operated Blood Sampling System for Portable Type Self- Monitoring Blood Glucose Device”, Proc. IEEE Engineering in Medicine and Biology Society, 335-338 (2010).
4) A. P. Pathank, E. Kim, J. Zhang, M. V. Jones, “Three-
Dimensional Imaging of the Mouse Neurovasculature with Magnetic Resonance Microscopy”, PLoS One, 6[7], 1-9 (2011).
5) B. C. Wilson, M. S. Patterson, S. T. Flock, J. D. Moulton,
“The Optical Absorption and Scattering Properties of Tissues in the Visible and Near-Infrared Wavelength Range”, Light Biol. Med., 1, 45-52 (1988).
6) T. Honda, T. Uchida, F. Kimura, Y. Fuke, H. Imasaka,
“Noninvasive Measurement of Hemoglobin Concentration Using a Near-Infrared Spectroscopic Imaging Method Is a Useful Method for Evaluating Hemoglobin Concentrations in Whole Blood Donors”, Japanese Journal of Transfusion and Cell Therapy, 55[4], 494-499 (2009).
7) S. Gioux, H. S. Choi, J. V. Fragioni, “Image-Guided Surgery Using Invisible Near-Infrared Light:
Fundamentals of Clinical Translation”, Moi Imaging, 9[5], 1-31 (2010).
8) A. Shahzad, N. M. Saad, N. Walter, A. S. Malik, F.
Meriaudeau, “An Efficient Method for Subcutaneous Veins Localization Using Near Infrared Imaging”, Proc.
of 5th Int. Conf. of IEEE on Interigent and Advanced Systems (ICIAS), 1-4 (2014).
9) E. Nakamachi, Y. Morita, Y. Mizuno, “Development of Automatic 3D Blood Vessel Search and Automatic Blood Sampling System by Using Hybrid Stereo- Autofocus Method”, International Journal of Optics, Volume 2012, Article ID 258626, 1-11 (2012).
10) V. V. Tuchin, Tissue Optics: Light Scattering Methods and Instruments for Medical Diagnosis, (SPIE, Washington, 2007).
11) T. L. Troy, S. N. Thennadil, “Optical Properties of Human Skin in the Near-Infrared Wavelength Range of 1000 to 2200 nm”, Journal of Biomed. Opt., 6, 167-176 (2001).
12) H. W. Jensen, S. R. Marscher, M. Levoy, P. Hanrahan,
“A Practical Model for Subsurface Light Transport”, SIGGRAPH Conference Proceedings, 511-518 (2006).
13) M. Amiri, M. Keivani, F. S. Tafreshi, “Retinal Blood Vessel Segmentation Using Gabor Filter and Morphological Reconstruction”, Int. Journal of Rev. Life.
Sci., 5[10], 1014-1020 (2015).
14) R. Vega, E. Guevara, L. E. Falcon, G. S. Ante, H. Sossa,
“Blood Vessel Segmentation in Retinal Images Using Lattice Neural Networks”, Advances in Artificial Intelligence and Its Applications, 8265, 532-544 (2013).
15) L. H. Wang, S. L. Jacques, L. Q. Zheng, “MCML - Monte Carlo Modeling of Photon Transport in Multi-
layered Tissues”, Computer Methods and Programs in Biomedicine, 47, 131-146 (1995).
16) L. H. Wang, S. L. Jacques, L. Q. Zheng, “CONV - Convolution for Responses to a Finite Diameter Photon Beam Incident on Multi-layered Tissues”, Computer Methods and Programs in Biomedicine, 54, 141-150 (1997).
17) H. Assadi, R. Karshafian, A. Douplik, “Optical Scattering Properties of Intralipid Phantom in Presence of Encapsulated Microbubbles”, International Journal of Photoenergy, Volume2014, Article ID 471764, 1-9 (2014).
18) E. Salomatina, B. Jiang, J. Novak, A. N. Yaroslavsky,
“Optical Properties of Normal and Cancerous Human Skin in the Visible and Near-infrared Spectral Range”, Journal of Biomed. Opt., 11, 1-9 (2006).
19) A. Inoue, K. Ishii, N. Ito, N. Honda, T. Terada, K. Awazu,
“Development of the Phantom of Human Herniated Nucleus Pulposus Based on the Optical Properties with a Wavelength Range of 350-1000 nm”, Journal of Japan Society for Laser Surgery and Medicine, 32[4], 375-381 (2012).