1
18
F
-Fluorodeoxyglucose Positron Emission Tomography for Evaluating the Response to Neoadjuvant Chemotherapy in Advanced Esophageal
Cancer
YUKIKO TANI1, MASANOBU NAKAJIMA1, MAIKO KIKUCHI1, KEISUKE IHARA1, HIROTO MUROI1, MASAKAZU TAKAHASHI1, YASUSHI DOMEKI1, KENTARO OKAMOTO1, SATORU YAMAGUCHI1, KINRO SASAKI1, TAKASHI
TSUCHIOKA1, SETSU SAKAMOTO2, and HIROYUKI KATO1
1First Department of Surgery, Dokkyo Medical University, Shimotuga-gun, Tochigi, Japan;
2PET Center, Dokkyo Medical University, Shimotuga-gun, Tochigi, Japan.
Correspondence to: Dr. Yukiko Tani, First Department of Surgery, Dokkyo Medical University, 880 Kitakobayashi Mibu, Shimotuga-gun, Tochigi 321-0293, Japan.
Tel.: +81 282872157, Fax: +81 282866213, e-mail: [email protected]
Key Words: Esophageal cancer, positron emission tomography, metabolic tumor volume, neoadjuvant chemotherapy.
Running Title: Tani et al: FDG-PET for Evaluating NAC in Esophageal Cancer
2
3
Abstract. Background/Aim: The purpose of the present study was to improve the diagnostic precision of 18F-fluorodeoxyglucose positron emission tomography/computed tomography (FDG-PET/CT) after neoadjuvant chemotherapy (NAC) in patients with advanced esophageal cancer. Materials and Methods: Thirty patients underwent FDG- PET/CT before and after NAC. The maximum standardized uptake value (SUVmax) and metabolic tumor volume (MTV) were measured. Patients were divided into two pathological response groups: “responders” (grades 1b3) or “non-responders” (grades 01a). Results: Overall, 11 patients were responders. Significant differences were present for the post-NAC SUVmax (p=0.070), %decrease in SUVmax (p=0.017), post-NAC MTV (p=0.014), and %decrease in MTV (p=0.003). Conclusion: Receiver operating characteristic curve analysis showed that the %decrease in MTV of the primary tumor was the best indicator of the response to NAC. We are currently striving to improve the accuracy of this assessment method.
4
Esophageal cancer is the eighth most common form of cancer worldwide and is one of the most difficult malignancies to cure. Prognosis remains unsatisfactory despite significant advances in surgical techniques and perioperative management (1). The optimal treatment strategy for localized esophageal cancer has not yet been established.
Surgical resection remains the mainstay for treating esophageal cancer, and curative resection is the most important surgery (2). In Japan, neoadjuvant chemotherapy (NAC) is the recommended treatment for clinical stage II and III esophageal cancer, with the aim of prolonged overall survival (OS).
The response to NAC has been assessed according to the Response Evaluation Criteria in Solid Tumors (RECIST) using diagnostic imaging modalities, such as computed tomography (CT) and esophagogastroduodenoscopy images. However, we often find that a RECIST-based result is not in accordance with the clinical diagnosis.
The response of the primary tumor after NAC has an important prognostic significance (3-5). Because the evaluation of the primary tumor is sometimes difficult using RECIST criteria, 18F-fluorodeoxyglucose positron emission tomography/CT (FDG- PET/CT) is generally used to predict the histopathologic response to NAC (6-1312). The present study determined the precision of using PET/CT scans to evaluate the response to NAC as well as the scanning methods best suited to evaluate the effectiveness of NAC.
When analyzing the prognostic capability of PET/CT, one of the most common parameters is the maximum standardized uptake value (SUVmax). Recently, the metabolic tumor volume (MTV) has also been found to be a useful diagnostic modality. Therefore, the present study used SUVmax and MTV for its evaluations.
The presence of metastatic lymph nodes is an important prognostic factor, although
5
there exist few reports that included lymph nodes in their data. We, therefore, investigated this aspect as well (5, 14-2013-18).
The purpose of the present study was to improve the diagnostic precision of PET/CT for evaluating the efficacy of NAC.
Materials and Methods
Patients. From January 2010 to April 2015, a total of 208 esophageal cancer patients underwent surgical treatment at the Dokkyo Medical University Hospital (Mibu-machi, Tochigi, Japan). Among them, 57 patients underwent NAC as initial therapy, another 10 patients underwent chemoradiotherapy (CRT) as initial therapy, and the remaining 141 patients underwent surgery as initial therapy. Out of these 57 patients (27 men, 3 women;
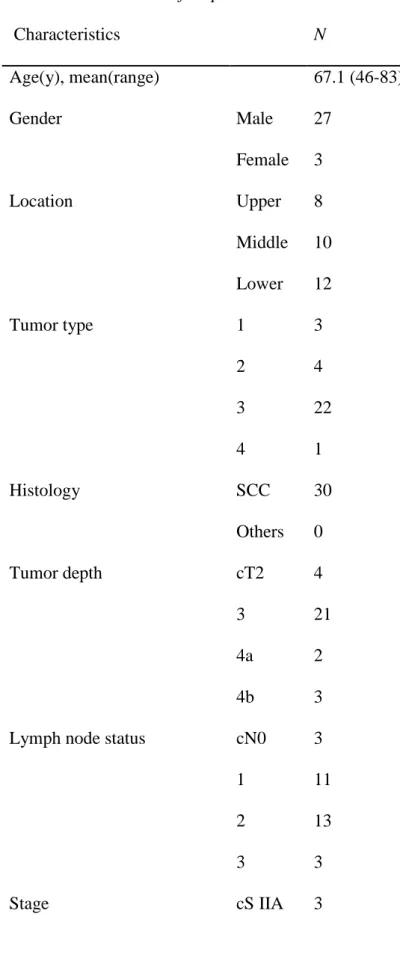
mean age=67.1 years), 30 were enrolled in this study (Table I). Informed consent was obtained from all participants. Each was histologically confirmed to have squamous cell carcinoma (SCC) of the esophagus without distant organ metastasis. These patients underwent PET/CT scanning before and after NAC. To stage the tumor in accordance with TNM classification (7th edition) of the Union for International Cancer Control, all patients underwent esophagogastroduodenoscopy, endoscopic ultrasonography, CT scanning, and PET/CT scanning from the neck to the abdomen. All patients provided written informed consent for data access. Patients excluded from analysis were those with a complete response who were shifted to radical CRT and those who were found by PET/CT to have an unresectable advanced esophageal cancer after NAC.
Treatment. After staging, two courses of chemotherapy were administered separated by a
6
4-week interval. After NAC, eligible patients underwent surgical resection. Among the 30 patients, 25 (83.3%) received docetaxel, cisplatin, and 5-fluorouracil (DCF) therapy;
three patients received docetaxel, nedaplatin, and 5-fluorouracil (DNF) therapy; and two patients received cisplatin and 5-fluorouracil (CF) therapy. The DCF regimen comprised of intravenous docetaxel (70 mg/m2) and cisplatin (70 mg/m2) on day 1 and continuous intravenous 5-fluorouracil (700 mg/m2) on days 1–5. The DNF regimen comprised intravenous docetaxel (70 mg/m2) and nedaplatin (70 mg/m2) on day 1 and continuous intravenous 5-fluorouracil (700 mg/m2) on days 1–5. The CF regimen comprised of intravenous cisplatin (80 mg/m2) on day 1 and continuous intravenous 5-fluorouracil (800 mg/m2) on days 1-5. Surgery was performed 3 weeks after completion of the NAC.
Standard esophagectomy using the McKeown method and three-field lymph node dissection were performed.
PET/CT protocol. The PET/CT was performed before and approximately 2 weeks after NAC with an integrated scanner (Biograph 16 or Biograph LSO scanner; Siemens, Erlangen, Germany). All patients fasted for at least 6 h. Before administration of FDG, the blood glucose level had to be <150 mg/dL. Whole-body images were obtained approximately 60 min after intravenous administration of 18F-FDG at a dose of 4.5 MBq/kg body weight (up to 450 MBq). Imaging was performed in six to eight bed positions based on the patient’s height. Low-dose CT was performed (nine effective mAs) to reduce radiation exposure.
Imaging assessment. The primary tumor and lymph node metastasis were assessed by PET/CT before and after NAC, and the SUVmax and MTV were measured. Only lymph
7
nodes that had a SUVmax value of ≥2.5 before NAC were assessed. For patients with multiple lymph node metastases, we assessed the lymph nodes with the highest SUVmax
before NAC. The SUVmax was measured by setting the region of interest with syngo.via software (Siemens Healthcare, Malvern, PA, USA). The MTV on PET/CT images was defined as the total tumor volume with an SUV of ≥2.5. The %decrease in the tumor volume was expressed using the following formulas:
%decrease in SUVmax=(preNAC SUVmax − post-NAC SUVmax)/preNAC SUVmax × 100,
%decrease in MTV = (preNAC MTV − post-NAC MTV)/preNAC MTV × 100.
The response to NAC was also assessed using the RECIST and the PET Response Criteria in Solid Tumors (PERCIST).
RECIST criteria. In the RECIST criteria, changes in the longest diameter of non-target lesions were measured from enhanced CT images. Primary lesions were measured from enhanced esophagogastroduodenoscopy images. Based on the response criteria of RECIST 1.1 (18, 1917, 18), the responses to NAC were the following: complete response (CR), all target lesions disappeared; partial response (PR), at least a 30% decrease in the sum of the longest diameters of the target lesions, using the baseline sum diameters as a reference; progressive disease (PD), at least a 20% increase in the sum of the longest diameters of the target lesions, using the smallest sum of the longest diameters as a reference (including one or more new lesions); stable disease (SD), neither sufficient shrinkage to qualify for PR nor sufficient increase to qualify for PD, using the smallest
8
sum of the longest diameters as a reference.
PERCIST criteria. With PERCIST, changes in the volume of the primary lesions are based on measurements from enhanced PET/CT images (1918). The response to NAC was assessed by the following criteria: complete metabolic response (CMR), complete resolution of 18F-FDG uptake within the tumor volume so that it is indistinguishable from the surrounding normal tissue; partial metabolic response (PMR), post-chemotherapy reduction of more than 30% in the tumor 18F-FDG SUV; progressive metabolic disease (PMD), an increase in tumor 18F-FDG SUV of <30% or a decrease of <15% and no visible increase in the extent of 18F-FDG tumor uptake; stable metabolic disease (SMD), an increase in 18F-FDG tumor SUV of >30% within the tumor region defined on the baseline scan, a visible increase in the extent of 18F-FDG tumor uptake, or the appearance of new
18F-FDG uptake in metastatic lesions.
Pathological assessment. The pathological response to NAC was assessed using the 2008 Guidelines for Clinical and Pathological Studies on Carcinoma of the Esophagus (10th edition) of the Japanese Society for Esophageal Diseases: grade 0, neither necrosis nor cellular or structural changes are evident throughout the lesion; grade 1a, necrosis or the tumor shrank to less than one-third of the whole lesion, or only cellular or structural changes are present in varying amounts; grade 1b, necrosis or the tumor shrank to no more than two-thirds of the whole lesion; grade 2, necrosis or the tumor shrank to more than two-thirds of the whole lesion, but viable tumor cells remain; grade 3, the entire lesion is necrotic and/or is replaced by fibrosis with or without granulomatous changes (no viable tumor cells are present). Patients were divided into two pathological response
9
groups: “responder” (grade 1b, 2, or 3) or “non-responder” (grade 0 or 1a).
Statistical analysis. The relation between responders and non-responders was determined using the Mann-Whitney U-test. The receiver operating characteristics (ROC) curve was used to obtain the optimal threshold. OS was determined by the Kaplan–Meier test. A value of p<0.05 indicates statistical significance.
Results
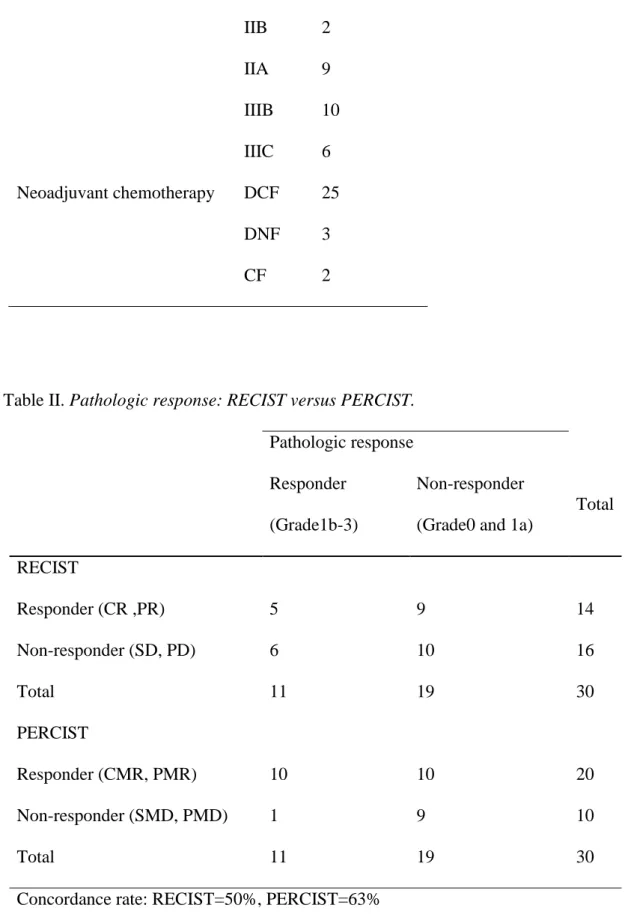
Response of primary lesion to NAC and PET/CT evaluation. A pathological response to NAC occurred in no patients with grade 0 tumors, 19 patients with grade 1a tumors, 5 patients with grade 1b tumors, 3 patients with grade 2 tumors, and 3 patients with grade 3 tumors. Patients were divided into two groups: those with grade 0 or 1a tumors (non- responders) and those with grade 1b3 tumors (responders). The concordance rates of these groups for RECIST and PERCIST were 50% and 63%, respectively (Table II). The PET/CT images before and after NAC are shown in Figure 1.
The Mann-Whitney U-test revealed significant differences in the post-NAC SUVmax
for responders (1.59–9.27, mean=4.32) and non-responders (2.15–21.35, mean=8.78) (p=0.007), and in the %decrease in SUVmax for responders (56.8–100%, mean=89.7%) and non-responders (−26.1% to 100%, mean=54.6%) (p=0.017). There were significant differences in the post-NAC MTV for responders (0–15.84; mean=3.35) and non- responders (0–76.11, mean=14.48) (p=0.014) and in the %decrease in MTV for responders (56.8–100%, mean=89.7%) and non-responders (26.1–100%, mean=54.6%) (p=0.003) (Table III).
10
Response of metastatic lymph nodes to NAC and PET/CT evaluation. The lymph nodes were similarly tested by 18F-FDG uptake on PET/CT scans. There were significant differences in the post-NAC SUVmax for responders (0.98-3.32, mean=2.04) and non- responders (1.50-14.51, mean=5.18) (p=0.002) and in the %decrease in SUVmax for responders (51.4-93.4, mean 73.4%) and non-responders (−72.9%-79.9%, mean=33.7%) (p=0.002). There were significant differences in the post-NAC MTV for responders (0- 1.83, mean=0.37) and non-responders (0-106.10, mean=10.40) (p=0.002). Significant differences in the %decrease in the MTV were similarly evident for responders (88.4- 100%, mean=98.4%) and non-responders (−55.7%- 100%, mean=53.4%) (p=0.001) (Table IV).
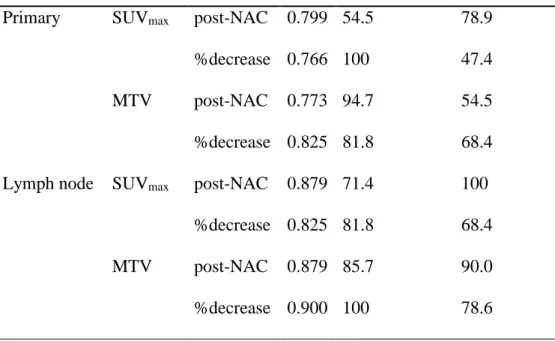
Relation between the primary tumor and metastatic lymph nodes regarding %decrease in SUVmax and MTV. The extent of 18F-FDG uptake by the primary tumor and lymph nodes and the %decrease in the MTV may be a significant indicator of surviving tumor cells in the primary tumor and lymph nodes. The evaluation of the primary tumor and lymph nodes using ROC curves suggested that the %decrease in the MTV is the best indicator for both types of pathological change (Table V).
Spearman’s correlation coefficient for the primary tumor and lymph node metastasis was also analyzed. There was no correlation after NAC between the primary tumor and lymph nodes regarding the %decrease in SUVmax or MTV (Figure 2).
Relation between the OS and the %decrease in SUVmax and MTV. To evaluate the 2-year OS using Kaplan-Meier analyses, patients were divided into two groups based on the %decrease of the SUV and MTV that were obtained using PET/CT. The cutoff value
11
was 30%, which is generally used to divide these patients into CMR/PMR and PMD/SMD categories in PERCIST (18, 19, 2117, 18, 20). Evaluation of the %decrease in the SUV showed no significance (p=0.142) for OS, whereas the %decrease in the MTV was significant for predicting OS (p=0.040) (Figure 3). We also evaluated the 2-year OS according to the %decrease in the MTV and found that the %decrease in the MTV predicted the prognosis correctly at a significantly high rate.
Discussion
PET/CT can detect the primary tumor and lymph node and distant metastases in patients with esophageal cancer (5-7, 13, 14). Lymph node metastasis before treatment and the primary tumor’s response to NAC are important prognostic predictors in patients with advanced esophageal cancer (8, 14, 2013). The response to NAC can be an important factor when determining treatment strategies. The response of solid tumors to NAC is typically assessed using the RECIST criteria. The response of esophageal cancer to NAC is similarly determined by the RECIST criteria, but these criteria often fail to indicate a pathological response (6).
The current study examined the use of PET/CT to determine more accurately the response to NAC in patients treated in our Hospital. It determined that assessment of the primary tumor — based on the post-NAC SUVmax, %decrease in the post-NAC SUV, post-NAC MTV, %decrease in the post-NAC MTV— and effectively determined the response to NAC. Among these indicators, the %decrease in MTV after NAC may particularly help improve the accuracy with which the response to chemotherapy is determined. In addition, the therapeutic response of lymph nodes may be estimated by the %decrease in the MTV, as confirmed in patients with a primary tumor. However, no
12
correlation was confirmed between the %decrease in the lymph nodes and the %decrease in the primary tumor.
The RECIST system assesses the size of a tumor but often fails to reflect the tumor’s viability. Thus, there may be instances in which the tumor does not shrink despite the treatment’s anticancer action. A better option, proposed by Wahl et al. (1918) in 2009, is to assess treatment response using the PERCIST system, which analyses the metabolic response, thus reflecting the treatment response. The PERCIST system is useful for determining the response of head and neck cancers and esophageal cancer to NAC (14, 15, 21-24).
The SUVmax is typically used (27, 2825, 26), although it indicates the maximum point of tumor metabolism. The MTV measures the volume of the portion of a tumor that has glucose metabolism at or above a certain level. Thus, few studies have used the MTV to indicate a tumor’s response to treatment (29, 3027, 28). The SUVmax is generally used to predict tumor response. Results of the current study demonstrated that the SUVmax can be used to predict a primary tumor’s response to treatment and indicated that MTV may more accurately predict the response.
Our experience suggests that FDG uptake is sometimes inconsistent when assessing the pathological response of some patients and that its uptake varies among patients.
Pathological response is evaluated by estimating the size of a tumor before chemotherapy.
After chemotherapy, however, the therapeutic effects may be underestimated when the fibrotic response is small. Thus, it is different from the response to NAC. Therefore, to evaluate the 2-year OS using Kaplan-Meier analysis, patients were divided into two groups based on the %decrease of the SUV and MTV, that were obtained with PET/CT.
The cutoff value was 30%, which is generally used to divide them into CMR/PMR and
13
PMD/SMD categories in the PERCIST system (19, 20, 2318, 19, 21). We found that using the %decrease in the MTV to predict prognosis in regard to the 2-year OS resulted in correct predictions at a significantly high rate. The therapeutic effects could also be evaluated accurately by concomitantly examining the pathological response and the %decrease in the MTV. Thus, the %decrease in the MTV of the primary tumor and lymph nodes may be the most promising indicator of the response to NAC.
The OS appeared to be significantly prolonged when the %decrease in the MTV was
≥30%. Thus, when assessing the post-NAC pathological response, the %decrease in the MTV could be used to estimate the patient’s prognosis.
Several investigators have found the PERCIST system better than the RECIST system for evaluating the response to NAC in patients with advanced esophageal cancer (6-12).
The evaluation method, however, has not been established. The present study was designed to examine the precision of PET/CT scans for evaluating the response to NAC and determining the scanning methods best suited to evaluate the effectiveness of NAC.
Among them, the %decrease in MTV of the primary tumor and lymph nodes after NAC could particularly help improve the accuracy with which the response to chemotherapy is determined. The PERCIST system analyzes the metabolic response and thus reflects the treatment response.
Conclusion
The %decrease in the MTV of the primary tumor was the best indicator of the patients’
response to NAC. Furthermore, patients have a favorable prognosis when there is a high %decrease in the MTV, although it is difficult to confirm a difference in the pathological response. We are striving to improve the accuracy of this assessment method.
14
Acknowledgments
The authors thank Lecturer Hiroyuki Mitomi for advice on the pathological assessment, Masaya Seki and Kazufumi Suzuki for their excellent technical assistance on the PET/CT and Hitomi Ozeki, Yuki Ohashi, and Nozomi Yuzawa for their excellent secretarial assistance.
15
References
1. Kato H, Nakajima M: Treatments for esophageal cancer: a review. Gen Thorac Cardiovasc Surg 61: 330-335, 2013.
2. Kato H, Fukuchi M, Miyazaki T, Nakajima M, Tanaka N, Inose T, Kimura H, Faried A, Saito K, Sohda M, Fukai Y, Masuda N, Manda R, Ojima H, Tsukada K, Kuwano H:et al. Surgical treatment for esophageal cancer: current issues. Dig Surg 24: 88-95, 2007.
3. Jeong Y, Kim JH, Kim SB, Yoon DH, Park SI, Kim YH, Kim HR, Jung HY, Lee GH, Ryu JS:et al. Role of surgical resection in complete responders on FDG-PET after chemoradiotherapy for locally advanced esophageal squamous cell
carcinoma. J Surg Oncol 109: 472-477, 2014.
4. Myslivecek M, Neoral C, Vrba R, Vomackova K, Cincibuch J, Formanek R, Koranda P, and Zapletalova J:et al. The value of 18F-FDG PET/CT in assessment of
metabolic response in esophageal cancer for prediction of histopathological response and survival after preoperative chemoradiotherapy. Biomed Pap Med Fac Univ Palacky Olomouc Czech Repub 156: 171-179, 2012.
5. Okumura H, Uchikado Y, Matsumoto M, et al. Prognostic factors in esophageal squamous cell carcinoma patients treated with neoadjuvant chemoradiation therapy. Int J Clin Oncol 18: 329-334, 2013.
6. Kato H, Kuwano H, Nakajima M, Owaki T, Kita Y, Omoto I, Sasaki K, Sakurai T, Setoyama T, Nabeki B, Matsushita D, Ishigami S, Hiraki Y, Nakajo M and Natsugoe S:et al. Comparison between positron emission tomography and computed tomography in the use of the assessment of esophageal carcinoma.
16
Cancer 94: 921-928, 2002.
7. Kato H, Miyazaki T, Nakajima M, akita J, Kimura H, Faried A, Sohda M, Fukai Y, Masuda N, Fukuchi M, Manda R, Ojima H, Tsukada K, Kuwano H, Oriuchi N and Endo K:et al. The incremental effect of positron emission tomography on diagnostic accuracy in the initial staging of esophageal carcinoma. Cancer 103:
148-156, 2005.
8. Nguyen A, Luginbuhl A, Cognetti D, Van Abel K, Bar-Ad V, Intenzo C, Keane W and Curry J:et al. Effectiveness of PET/CT in the preoperative evaluation of neck disease. Laryngoscope 124: 159-164, 2014
9. Roedl JB, Harisinghani MG, Colen RR, Fischman AJ, Blake MA, Mathisen DJ and Mueller PR:et al. Assessment of treatment response and recurrence in esophageal carcinoma based on tumor length and standardized uptake value on positron emission tomography-computed tomography 86: 1131-1138, 2008.
10. Pak K, Cheon GJ, Nam HY, Kim SJ, Kang KW, Chung JK, Kim EE and Lee DS:et al. Prognostic value of metabolic tumor volume and total lesion glycolysis in head and neck cancer: a systematic review and meta-analysis. J Nucl Med 55: 884-890, 2014.
11. Kato H, Fukuchi M, Miyazaki T, Nakajima M, Tanaka N, Inose T, Kimura H, Faried A, Saito K, Sohda M, Fukai Y, Masuda N, Manda R, Ojima H, Tsukada K, Oriuchi N, Endo K, Nonaka T, Shioya M, Ishikawa H, Sakurai H, Nakano T amd Kuwano H:et al. Prediction of response to definitive chemoradiotherapy in esophageal cancer using positron emission tomography. Anticancer Res 27: 2627- 2633, 2007.
12. Yanagawa M, Tatsumi M, Miyata H, Morii E, Tomiyama N, Watabe T, Isohashi K,
17
Kato H, Shimosegawa E, Yamasaki M, Mori M, Doki Y and Hatazawa J:et al.
Evaluation of response to neoadjuvant chemotherapy for esophageal cancer: PET response criteria in solid tumors versus response evaluation criteria in solid tumors. J Nucl Med 53: 872-880, 2012.
13. Tao CJ1, Lin G1, Xu YP1 and Mao WM2: Predicting the Response of Neoadjuvant Therapy for Patients with Esophageal Carcinoma: an In-depth Literature Review: J Cancer 6: 1179-86, 2015.
14. Miyata H, Yamasaki M, Takahashi T, Murakami K, Kurokawa Y, Nakajima K, Takiguchi S, Mori M and Doki Y:et al. Relevance of [18F]fluorodeoxyglucose positron emission tomography-positive lymph nodes after neoadjuvant
chemotherapy for squamous cell oesophageal cancer.Br J Surg 100: 1490-1497, 2013.
15. Kato H, Nakajima M, Sohda M, Tanaka N, Inose T, Miyazaki T, Fukuchi M, Oriuchi N, Endo K and Kuwano H:et al. The clinical application of (18)F-
fluorodeoxyglucose positron emission tomography to predict survival in patients with operable esophageal cancer. Cancer 115: 3196-3203, 2009.
16. Yasuda T, Yano M, Miyata H, Yamasaki M, Higuchi I, Takiguchi S, Fujiwara Y, and Doki Y:et al. Systemic control and evaluation of the response to neoadjuvant chemotherapy in resectable thoracic esophageal squamous cell carcinoma with 18F-fluorodeoxyglucose positron emission tomography-positive lymph nodes.
Surg Today 45: 335-345, 2014
17. Yasuda T, Yano M, Miyata H, Yamasaki M, Takiguchi S, Fujiwara Y, and Doki Y:
Prognostic Significance of (18)F-fluorodeoxyglucose Positron Emission Tomography (FDG-PET)-Positive Lymph Nodes Following Neoadjuvant
18
Chemotherapy and Surgery for Resectable Thoracic Esophageal Squamous Cell Carcinoma. Ann Surg Oncol.: 2599-2607, 2015.
18. Therasse P, Arbuck SG, Eisenhauer EA Wanders J, Kaplan RS, Rubinstein L, Verweij J, Glabbeke MV, Oosterom AT, Christian MC and Gwyther SG: et al. New Guidelines to Evaluate the Response to Treatment in Solid Tumors. Journal of the National Cancer Institute 92: 205-216, 2000.
19. Wahl RL, Jacene H, Kasamon Y and Lodge MA: From RECIST to PERCIST:
Evolving Considerations for PET response criteria in solid tumors. J Nucl Med 50S: 122S-150S, 2009.
20. Miyata H, Yamasaki M, Makino T, Tatsumi M, Miyazaki Y, Takahashi T, Kurokawa Y, Takiguchi S, Mori M and Doki Y: Impact of number of [18
F]fluorodeoxyglucose-PET-positive lymph nodes on survival of patients receiving neoadjuvant chemotherapy and surgery for oesophageal cancer: Br J Surg: DOI:
10.1002/bjs.9965, 2015.
21. Metser U, Rashidi F, Moshonov H, Kasamon Y and Lodge MA:et al. (18)F-FDG- PET/CT in assessing response to neoadjuvant chemoradiotherapy for potentially resectable locally advanced esophageal cancer. Ann Nucl Med 28: 295-303, 2014.
22. Kato H and Nakajima M. The efficacy of FDG-PET for the management of
esophageal cancer: review article. Ann Thorac Cardiovasc Surg 18: 412-419, 2012.
23. Kikuchi M, Nakamoto Y, Shinohara S, Fujiwara K, Yamazaki H, Kanazawa Y, Kurihara R, Kishimoto I, Harada H and Naito Y: et al. Early evaluation of neoadjuvant chemotherapy response using FDG-PET/CT predicts survival prognosis in patients with head and neck squamous cell carcinoma. Int J Clin Oncol 18: 402-410, 2013.
19
24. Schollaert P, Crott R, Bertrand C, D'Hondt L, Borght TV and Krug B. A systematic review of the predictive value of (18) FDG-PET in esophageal and
esophagogastric junction cancer after neoadjuvant chemoradiation on the survival outcome stratification.J. Gastrointest Surg 18: 894-905, 2014.
25. Ding Q, Cheng X, Yang L, Zhang Q, Chen J, Li T and Shi H:et al. PET/CT evaluation of response to chemotherapy in non-small cell lung cancer: PET response criteria in solid tumors (PERCIST) versus response evaluation criteria in solid tumors (RECIST). J Thorac Dis 6: 677-683, 2014.
26. Stiekema J, Vermeulen D, Vegt E, Voncken FE, Aleman BM, Sanders J, Boot H and van Sandick JW:et al. Detecting interval metastases and response assessment using 18F-FDG PET/CT after neoadjuvant chemoradiotherapy for esophageal cancer. Clin Nucl Med 39: 682-867, 2014.
27. Park JS, Choi JY, Moon SH, Ahn YC, Lee J, Kim D, Kim K and Shim YM:et al.
Response evaluation after neoadjuvant chemoradiation by positron emission tomography-computed tomography for esophageal squamous cell carcinoma.
Cancer Res Treat 45: 22-30, 2013.
28. Miyata H, Yamasaki M, Takahashi T, Murakami K, Tanaka K, Yukinori K, Nakajima K, Takiguchi S, Morii E, Hatazawa J, Mori M and Doki Y:et al.
Determinants of response to neoadjuvant chemotherapy for esophageal cancer using 18F-fluorodeoxiglucose positron emission tomography (18F-FDG-PET).
Ann Surg Oncol 21: 575-582, 2014.
29. Blom RL, Steenbakkers IR, Lammering G, Vliegen RF, Belgers EJ, de Jonge C, Schreurs WM, Nap M, Sosef MN:et al. PET/CT-based metabolic tumour volume for response prediction of neoadjuvant chemoradiotherapy in oesophageal
20
carcinoma. Eur J Nucl Med Mol Imaging 40: 1500-506, 2013.
30. Li Y, Lin Q, Wang L, Sun L, Dai M, Luo Z, Zheng H, Zhao L and Wu H:et al.
Application of sequential (18)F-FDG PET/CT scans for concurrent
chemoradiotherapy of non-surgical squamous cell esophageal carcinoma. J BUON 19: 517-523, 2014.
21
Table I. Characteristics of 30 patients.
Characteristics N
Age(y), mean(range) 67.1 (46-83)
Gender Male 27
Female 3
Location Upper 8
Middle 10 Lower 12
Tumor type 1 3
2 4
3 22
4 1
Histology SCC 30
Others 0
Tumor depth cT2 4
3 21
4a 2
4b 3
Lymph node status cN0 3
1 11
2 13
3 3
Stage cS IIA 3
22
IIB 2
IIA 9
IIIB 10 IIIC 6 Neoadjuvant chemotherapy DCF 25
DNF 3
CF 2
Table II. Pathologic response: RECIST versus PERCIST.
Pathologic response Responder
(Grade1b-3)
Non-responder (Grade0 and 1a)
Total
RECIST
Responder (CR ,PR) 5 9 14
Non-responder (SD, PD) 6 10 16
Total 11 19 30
PERCIST
Responder (CMR, PMR) 10 10 20
Non-responder (SMD, PMD) 1 9 10
Total 11 19 30
Concordance rate: RECIST=50%, PERCIST=63%
23
RECIST, response evaluation criteria in solid tumors; PERCIST, PET response criteria in solid tumors; C(M)R, complete (metabolic) response; P(M)R, partial (metabolic) response; S(M)D, stable (metabolic) disease; P(M)D, progressive (metabolic) disease.
24
Table III. Correlations between the pathological response and PET/CT findings for the primary tumor.
Responder (Grade1b-3) Non-responder (Grade0 and 1a)
(n=11) (n=19)
p- Value SUVmax
pre-NAC 15.58(3.52-21.53) 14.72 (6.73-21.99) 0.366 post-NAC 4.32 (1.59-9.27) 8.78(2.15-21.35) 0.007 %decrease 68.8% (40.1-89.5%) 35.4% (-57.0-87.1%) 0.017 MTV
pre-NAC 39.53 (1.41-102.01) 29.79(4.58-60.62) 0.401 post-NAC 3.35 (0.00-15.84) 14.48 (0.00-76.11) 0.014 %decrease 89.7% (56.8-100%) 54.6% (-26.1-100%) 0.003
MTV, Metabolic tumor volume.
25
Table IV. Correlations between the pathological response and PET/CT findings for the lymph nodes.
Responder (Grade1b-3) Non-responder (Grade0 and 1a)
(N=10) (n=14)
p- Value SUVmax
pre-NAC 9.52(3.15-20.81) 8.41 (3.17-17.88) 0.598 post-NAC 2.04(0.98-3.32) 5.18 (1.50-14.51) 0.002 %decrease 73.4% (51.4-93.4%) 33.7% (-72.9-79.9%) 0.002 MTV
pre-NAC 20.59(0.92-126.9) 18.26(1.34-136.02) 0.639 post-NAC 0.37 (0.00-1.83) 10.40(0.00-106.10) 0.002 %decrease 98.4% (88.4-100%) 53.4% (-55.7-100%) 0.001
MTV, Metabolic tumor volume.
26
Table V Diagnostic predictive values of PET/CT in the prediction of pathological responders after NAC, by ROC analysis.
AUC Sensitivity(%) Specificity(%) Primary SUVmax post-NAC 0.799 54.5 78.9
%decrease 0.766 100 47.4
MTV post-NAC 0.773 94.7 54.5
%decrease 0.825 81.8 68.4 Lymph node SUVmax post-NAC 0.879 71.4 100
%decrease 0.825 81.8 68.4
MTV post-NAC 0.879 85.7 90.0
%decrease 0.900 100 78.6
AUC, Area under the receiver-operating-characteristic curve.
27
Figure 1.
Figure 2.
28
Figure 3.
29
Figure 1. Two patients with grade 1a tumors based on the pathological assessment. (A and B): A 46-year-old man had a primary tumor in the lower esophagus. (A): Pre-treatment with 18F-fluordeoxyglucose positron emission tomography/computed tomography (PET/CT) shows a maximum standard uptake value (SUVmax) of 13.60 and a metabolic tumor volume (MTV) of 60.34. (B): The post-treatment PET/CT shows an SUVmax of 21.35 and an MTV of 76.11. The reduction rate of the SUV is −57%, and that of the MTV is −26%. (C and D): A 66-year-old man with a primary tumor in the lower esophagus.
(C): Pretreatment PET/CT shows an SUVmax of 21.51 and an MTV of 102.01. (D): Post- treatment PET/CT shows an SUVmax of 2.25 and an MTV of 0. The reduction rate of the SUV is 89.5%, and the MTV is 100%.
Figure 2. Spearman’s correlation coefficients for a primary tumor and lymph node metastasis. There is no correlation between (A) the %decrease in SUV after neoadjuvant chemotherapy NAC (R2=0.079) or (B) the %decrease in MTV after NAC (R2=0.123).
Figure 3. Kaplan–Meier analysis of the patients with a diagnosis of esophageal cancer.
(A): The overall survival shows no significant difference between the %decrease in SUVmax of ≥30 and SUVmax <30. (B): Prediction of overall survival shows a significant difference between the %decrease in the MTV ≥30 and MTV <30.