Assessment in Urban Industrial Concentration Areas
著者 Maocheng Zhen, Xiaolu Gao, Haihong Yuan journal or
publication title
International Review for Spatial Planning and Sustainable Development
volume 5
number 2
page range 17‑34
year 2017‑04‑15
URL http://hdl.handle.net/2297/47853
doi: 10.14246/irspsd.5.2_17
17
Copyright@SPSD Press from 2010, SPSD Press, Kanazawa
An Empirical Study on Environmental Efficiency Assessment in Urban Industrial Concentration Areas
Maocheng Zhen
1,2, Xiaolu Gao
1,2*, Haihong Yuan
31. Key Laboratory of Regional Sustainable Development Modeling, Institute of Geographic Sciences and Natural Resources Research, Chinese Academy of Sciences
2. University of Chinese Academy of Sciences
3. Department of Scientific Research of the urban, Ningbo University
*Corresponding Author, Email: [email protected] Received: Nov 05, 2016; Accepted: Feb 03, 2017
Keywords: Environmental efficiency, Industrial concentration area (ICA); Spatial planning; Spatial governance
Abstract: Many urban industrial concentration areas are becoming mixtures of intensive industrial and residential land use. While they play important roles in urban economy and employment, the energy consumption and pollution discharge in the process of industrial production bring mang negative effects on surrounding people and environments. In this paper, a tool is proposed to evaluate the environmental efficiency (EE) of the industrial concentration areas in order to coordinate the functioning of economic activities and environmental protection. Based upon discussion on the principal and significance of EE assessment in urban industrial concentration areas, an empirical study is conducted in Fengtai district, Beijing, to elaborate the idea from three aspects: socio-economic contribution, environmental load, and environmental risk. The study area was divided into 1379 grids of 500 m*500 m as the basic spatial unit while the spatial size effect and its rationality of the environmental functions have been testified. As the result, it turned out that the amount of the low EE grids account for 71.15% of the total districts while the rather high environmental load grids 20.18%. In the meantime, we found out that the area of low EE value grids have the tendency to aggregate towards the central urban areas, along urban express ring roads and around wholesale markets. These results shed light to implementing the refined environmental spatial management and control.
1. INTRODUCTION
Since the reform and opening up in early 1980s, Chinese economy has
maintained a very high growth rate. From 2000 to 2013, the gross domestic
production increased from 9.8 trillion Yuan to 56.7 trillion Yuan, with an
annual growth rate of above 10% on average. Meanwhile, the growth rate of
resources and energy consumption is also very high. The energy
consumption increased to 3.75 billion tons in 2013 from 1.46 billion tons in
2000, with an annual average growth rate as high as 8%. Along with the
swift economic development and incremental energy consumption, urban
environment has been constantly worsened. What concerns more is that, with
the promotion of large-scale urbanization, the aggregations of industries and
population in large cities has become more and more obvious, and the imbalance of economic activities in industrial concentration areas among the overall spatial layout is the most intensive (Bai et al., 2004).
In practice, industrial concentration areas (ICAs), including various kinds of industrial parks, economic development zones, high-tech industrial areas, have not only become the most important carriers for cities and regions to attract economic elements (Cohen & Paul, 2005; Casper, 2007), but also made huge threat to the health of urban population and ecosystem due to the extensive aggregation of heavy and polluting industries and the mixture of them with people’s living space.
In existing studies, researchers presented two perspectives to define ICAs: the first focuses on industrial elements. That is, ICA is mainly dominated by one or several leading industries, and the enterprise cluster is formed due to the chaining relationship of upstream and downstream enterprises (Martin & Sunley, 2003; Hannigan, Cano-Kollmann, &
Mudambi, 2015). The second defines ICA according to the geographical features. That is, ICA refers to the special area with many firms of the industrial and service sectors gathering within a certain region. In particular, the agglomeration of industries with pollution characteristics in ICA is focused in this paper, where the air pollution, solid waste pollution, soil pollution, degradation of ecosystem and other urban environmental problems are apparent. In practice, the problems with ICA have affected the stability of ecological environmental system at different spatial scales and become the restrictive condition of urban and regional development, (Ren, Yu, &
Wang, 2009; Zeng & Zhao, 2009; Liu, Dong, & Li, 2011; Ma, Jin, & Liu, 2012). According to Gowd, Reddy, and Govil (2010), the main reason of heavy metal pollution of soil in Jajmau and Unnao in India is the waste discharged from 450 leather manufacturers. Virkanen (1998) showed that the ICAs in the south of Finland were the main source of heavy metal pollution in water and air pollution. de Leeuw et al. (2001) proved that the change of air quality of more than 200 high-density urban areas in EU (European Union) is closely related to the large scale clustering of industrial productions in these regions.
In ecological economy field, ecological efficiency has drawn considerable concern as an analysis tool of sustainable development (Schaltegger & Synnestvedt, 2002; Bleischwitz, 2003; Reith & Guidry, 2003). With a focus on the combinational relationship of economic and ecological impact, indices of social service and ecological load were composed to ecological efficiency, in short, in order to boost up the idea of using as few as resources and making as little as environmental impact to create the maximum amount of product and services (Maia, Silva, & Costa, 2016; Yuan, Huang, & Xu, 2016). Apparently, the ecological efficiency can be improved either by both raising the economic production or by reducing the negative environmental impact of human activities (Huppes, 2009). This general idea is quite similar to the assessment of environmental efficiency (EE).
Based on previous studies, the object of environmental impact
assessment can be divided into four types: product, enterprise, industry and
region. At present, most of EE indicators focused on the performance of
enterprise and product. For example, Kerr and Ryan (2001) conducted the
research on EE of Australian Branch of Fuji Xerox and found that the role of
implementing recycling production in duplicator industry was not obvious
for the improvement of EE. Lately, more research work has been emphasized on the environmental performance of production process of goods at a micro scale and the environmental impact of certain region at a macro scale. Because it is difficult to acquire detailed and reliable pollution data of each factory in a industry, environmental assessment are studied only for a limited number of industrial fields such as power plant, petrochemical, mining industry, papermaking industry and some other heavy pollution industries (Peng et al., 2005; Kuosmanen, 2005; Shi et al., 2012). For example, Nguyen and Hens (2015) conducted environmental impact evaluation for cement manufacturing in Vietnam according to ISO 14001, finding that the emission of SO
2and NO
2was reduced significantly after the application of ISO 14001 Certification. The research results showed that, for the developing countries, ISO 14001 could improve the environmental performance effectively. Meanwhile, the government departments and international organizations were interested in the measurement of environmental performance of a region at macro scale greatly, in order to facilitate urban construction and industrial development strategies. However, at present the research on regional EE evaluation is insufficient (Mickwitz et al., 2006). Zaim and Taskin (2000) ever formulated the indicator system to evaluate the environmental performance of OECD countries and compared them with the panel data in different periods. With a similar purpose, Färe, Grosskopf, and Hernandez-Sancho (2004) proposed to compare the evaluation indicator of OCED countries with a DEA (data envelop analysis) method.
The concept of EE was introduced to China at the end of 1990s, and the theoretical system of western countries was adapted to reflect the environmental and resources characteristics of China and meet the domestic development needs. In recent years, Chinese geographers paid more attention to the regional pattern and spatial differentiation of EE. Up till now, some comparative researches were conducted on the environmental and economic efficiency with the spatial unit of province or larger economic zones, such as the North and Northeast Economic Zones (Gai, Lian, & Tian, 2014; Fei, Liu, & Yang, 2015). For example, Wang et al. (2010) used the data envelopment analysis model to analyze and evaluate the EE of 31 provinces in China, and the results showed that the overall level of provincial EE was low but it was improving gradually. In general, the current researches on EE focus on micro level of individual products, enterprises as well as macro-level provincial or national comparison. On the other hand, research on the meso level centering on different urban functional areas were few, though this is significant for the optimization of urban structure. In view of this, in this article, we attempt to investigate the spatial needs of environmental protection and socio-economic development in ICAs and to raise solutions to the key problems in this kind of urban areas.
So far a holistic theoretical framework for EE in urban ICAs has not been
founded. This is mainly reflected in two aspects: Firstly, the system for EE
evaluation has not been established. In ICAs, although the contradictions
between the industrial production and urban population aggregation are
prominent, it is difficult to accurately quantify the negative effects on
residents’ life and ecosystem, let alone to justify them. Secondly, the scale
effect of EE evaluation is short of profound research. While there were many
studies on the evaluation of environmental impact or associated economic
performance at regional scales, few have investigated the issue of
appropriate scales for identifying and summarizing the environmental characteristics within cities, despite that people generally agree that improper selection of spatial units will bring bias to the research result.
In this article, we attempt to present a comprehensive empirical study on EE evaluation in ICAs in Fengtai District, Beijing and give suggestion to the policies of environmental management and spatial governance according to the evaluation result.
2. DATA AND METHOD 2.1 The study area
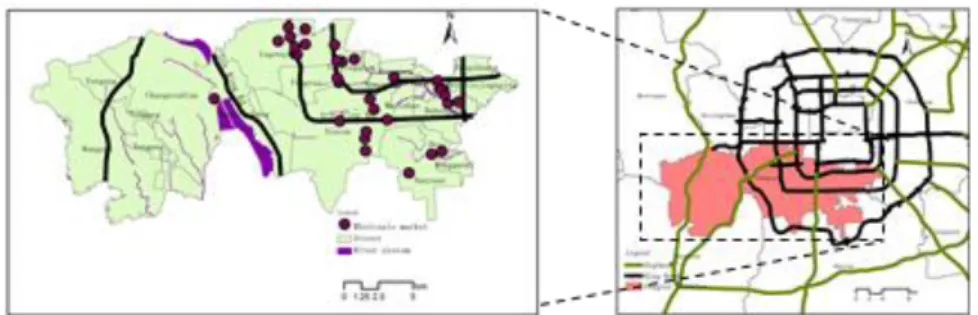
A typical ICA in Beijing is taken as the case study area. Fengtai District is located in the southwest of Beijing, with a total area of 306 km
2. The Yongding River, the largest river in Beijing, divides it into two parts:
Hedong area in the east part, which is the center of commerce, economy and industry, and Hexi area in the west part, which is an important ecological barrier of Beijing. Fengtai District governs 17 lower level administrative units including 14 Jiedaos (applied to urbanized areas) and 5 towns and townships (applied to less urbanized areas), and the number of permanent resident population is 2.32 million at the end of 2015 (Figure 1).
Fengtai District is characterized by the concentration of a variety of industries and urban factors. Therefore, the conflict between urban construction and the protection of ecological system is sharp. As one of the six center districts of Beijing, its environmental problem is politically sensitive. In 2013, it was established as one of the 24 national pilot areas by the Ministry of Environmental Protection for making urban environment master plan.
Generally speaking, Fengtai District is conventionally functioned for industrial production. The distribution of enterprises has the significant spatial agglomeration and mainly concentrates in the north and northeast of Hedong arear, and develops a high-grade ICA in the Fengtai Jiedao and Fangzhuang Jiedao. Besides, the industry structure of Fengtai District is complicated and many industries are pollutant industries. It has numbers of second industry enterprises , which including food (179), mechanical (1600), medical (27), chemical (282), building materials and furniture (165), paper printing (223), and is also consist of some third industry enterprises with heavy pollution covering catering, wash service and car wash. In addition, the characteristic of high risk is very obviously. There are 21 dangerous chemical enterprises, 28 printing enterprises and 31 city control monitoring enterprises. From the perspective of the overall Beijing, Fengtai District currently has the lowest land use intensity, the lowest urban population density and relatively low real estate prices among the center districts.
Therefore, Fengtai has experienced a rapid urban development in the past
five years, which made the negative environmental effects evidently. There
is an urgent need to adjust the industrial production and spatial pattern, and
strengthen controls over the environment.
2.2 Research data
We use POI (point of interest) data in 2011 associated with Baidu Map, the largest map service in China (http:// map.baidu.com), to get the point data of various enterprises. We acquire the emission data of polluting enterprises including waste water, waste gas and sulfur dioxide, according to Fengtai district’s pollution census conducted in 2007, which covered all registered enterprises in the district. To correct the time difference, we compare the list of enterprises with the POI dataset, whereby those closed or relocated enterprises are removed, and the emissions of new comer polluting enterprises are estimated according to the average value of enterprises with the same code (indicating industrial type). Then we identify the main polluting industries with the reference of Directory of Classification Management of Environmental Protection Verification Industry of Listed Companies (HBH No. [2008] 373) issued, the urban environmental statistic data and the polluting resources census data. Finally, we get the list and attribute data of Fengtai’s enterprises as well as their distribution (Figure 2).
The dataset includes the annual production output value and employee number of registered enterprises in Fengtai district. In addition, based on the list, we identify 88 petrochemical enterprises, 21 endangered enterprises and 80 above level hospitals as environmental risk source.
Figure 2. The distribution of industrial agglomeration in Fengtai District
2.3 The method of evaluation
In order to balance the advantages and disadvantages of the ICAs, many basic researches were conducted on the relationship of economic performance and environments. The concept of environmental performance was then formed. It can be traced back to 1970s as the concept of
“ environmental efficiency ” (Freeman, Haveman, & Kneese, 1973; McIntyre
& Thornton, 1978). In 1990s, Schaltegger and Sturm (1990) proposed the term of ecological efficiency, which to defines eco-efficiency as a
Figure 1.The location of Fengtai District in Beijing
combination of economic and environmental (ecological) values, expressed by the ratio of economic value/environmental impact. Subsequently, the World Business Council for Sustainable Development (WBCSD) inherited and developed the concept, which means the ratio of the economic value of products and services to the environmental load (Schmidheiny, 1992).
The focus of the environmental management of the ICAs is the conflict of interest caused by the industrial activities between the urban residents and the ecological environment. Under the function positioning of “Industrial Concentration Areas”, how to weigh the relationship between the economic development and environmental protection scientifically is the key problem to be solved by the EE evaluation. Therefore, we believe that it is necessary to consider the benefit brought by the industrial activities and environmental cost from two aspects of the production activity and urban recipient comprehensively.
In a broad meaning, ICAs reveals both positive and negative impacts. Its positive effect on urban and regional development can be summarized as socio-economic contribution, and be evaluated in two aspects, i.e., production contribution and employment contribution. The negative effects of pollution industry in ICAs on the environment include the negative effects of pollutants discharged on surrounding people and environments, which can be described from the perspective of amount, intensity and spatial distribution of various emissions. Concerning the objectivity and accessibility of indicators, we take waste water, waste gas, sulfur dioxide, industrial dust, nitrogen oxides, chemical oxygen demand and other indicators as the emission indicator. In view of special discharged pollutants generated from some enterprises, we take the heavy metal pollution, electromagnetic pollution, thermal pollution, photochemical pollution and so on as the special pollutants. Because of the technical difficulty or data confidentiality in the aspect of statistics, these pollution datas are difficult to be acquired and will not be analyzed in the following cases. On the other hand, the agglomeration of industry (especially the agglomeration of risk enterprises) increases the environmental risk with uncertainty, it will cause the great threat on the human health, ecological system and other sensitive receptors. Therefore, the environmental risks caused by the industrial on the residents and ecological environment also constitute the important contents of EE evaluation of ICAs.
According to the theoretical construction above, to objectively and comprehensively weigh the pros and cons of ICAs on the urban and regional development, we think that the EE evaluation of ICAs should be done in three aspects of socio-economic contribution, environmental load, and the environmental risk, from which the evaluation model for EE index of the ICAs is proposed:
(1)
where, BEE
iindicates the EE level of spatial unit i, the numerator C
iis the
social economic contribution index of i, and the denominator is constituted by the environmental load index (L
i) and environmental risk index (R
i) which are generated by social and economic activities in the spatial unit.
Upon investigation to the availability of data, we propose the evaluation indicator system as shown in Table 1.
i i
i i
BEE
(L ,R )CTable 1. Indices for EE assessment in urban industrial concentration areas
Component Evaluation index Variable
Socio-economic contribution
industrial contribution
GDP or output value employment
contribution
employment population
Environmental load
waste water Amount of waste water produced in production process
waste gas Amount of vehicle tailpipe emission, and waste gas in production process solid waste
emissions
Solid waste from living and production activities
sulfur dioxide Amount of sulfur dioxide produced in the process of firing coal and other fuel burning
Oxynitride Amount of oxynitride produced in production process
COD Amount of COD in waste water
industrial dust Amount of dusts and particles produced in production process
specific pollutant Amount of heavy metal, electromagnetic, thermal, and photochemical pollutant Environmental risk risk factor number, intensity, and distribution of risk
factors
Exposure Size/density of surrounding residents/vulnerable population;
distribution of sensitive and important ecological areas
2.4 The choice of spatial unit
Considering the spatial distribution of pollution enterprises, we compare the grids of 1000 meters, 500 meters, 200 meters. With 1000 m * 1000 m, we divide the area into 384 grids. the pattern of pollution is rough, and it is hard to make clear distinction of grids of industrial function. With 200 m mesh, the number of grid reaches 8067. The excessive fragmentation of the spatial distribution may bring difficulties to the regulation of the grids.
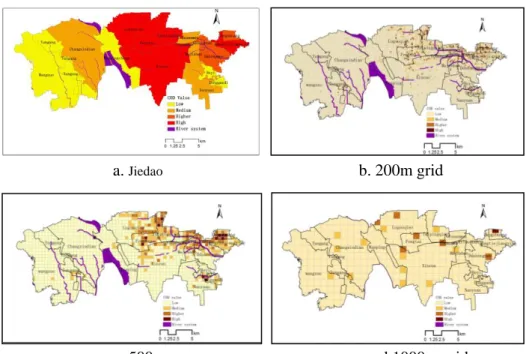
By comparison, the spatial patterns of pollution emission of 200 m * 200 m grid and 500 m * 500 m grid are similar relatively, but once the grid is larger than 1000 m * 1000 m, the resolution of detected extreme value points would reduce significantly (Figure 3). This result has a strong correlation with the scale of land use and the size of manufacturing enterprises. For the spatial distribution of polluting enterprises in Fengtai district, it is appropriate to select 500 m * 500 m grid , which not only allows for precise evaluation result (the accurat distribution of environment load and environment risk), but also helps to identify the spatial pattern of environmental problems and heavy polluting enterprises.
As a result, Fengtai District is divided into 1379 grids of 500 m*500 m as
the basic evaluation unit. Taking the emissions intensity of chemical oxygen
demand (COD) for example, our comparison of different sized spatial units
in Figure 3 shows, in the Jiedao scale, the distribution patterns of emissions
intensity of COD has a huge difference. In the 1000 m grid, the distribution
of COD is too coarse and can not reflect the internal differences. In the 200
m grid, the number of grids is too much. Based on the 500 m grid scale, the
evaluation is much more refined and well reflected the characteristics of
spatial differentiation of pollution emissions.
a.
Jiedaob. 200m grid
c. 500m d.1000m grid
Figure 3. Intensity of COD discharge at different grid scale in Fengtai District
3. RESULTS
3.1 Evaluation of social and economic contribution
In this study, socio-economic contribution of the ICAs is measured from two aspects, i.e., with the annual turnover of enterprise as the output value contribution index, and with the number of employees as the indicator of employment. We estimate the output and employment indices of each spatial unit, and then sum up the standardized indices to get the socio-economic contribution of each unit. The equations are as follows:
(2) (3) where, W
iis the sum of enterprise output in unit i; w
iis the output of the j- t h enterprise in unit i; E
iis the sum of quantity of employment in unit i; E
ijis the quantity of employing of the j- t h enterprise in unit i.
From Figure 4-a and Figure 4-b, we can find that, the high-grade grids of the output value and employment contribution are relatively consistent with each other in the spatial distribution, basically covering the northeast Jiedaos such as Fangzhuang and Dongtiejiangying, and the central regions such like Fengtai and Lugouqiao. Summarizing data in accordance with the grid, and then analyze the principal components of output value and employment contribution, the first main content is contribution rate of “economic contribution” factor, reaches 80.7%. Based on the statistical distribution features of this factor, with Natural Breaks classification method to divide the socio-economic contribution of each grid into four grades (Figure 4-c).
n j j 1
i
w
iW
n j j 1
i
e
iE
The results show that the social-economic contribution degree of different areas presents obvious spatial differences, the economic contribution degree such as Fangzhuang, Youanmen and Majiabao are relatively high with multiple extreme value grids. These regions have a quantity of large-scale industrial enterprises, which provide more jobs and meanwhile the industrial economic strength of enterprises in these grids are stronger than other areas.
On the other hand, the mid-high grades of the grids in Hexi area show the
“scattered” distribution, with relatively less enterprise output and jobs. It can be seen that functional orientation and functional division of different urban areas have a significant impact on spatial distribution of industrial development and employment.
a. Aggregated employment
b.
Aggregated output valuec. Comprehensive contribution value Figure 4. Social and economic contribution by grid
3.2 Environmental load evaluation
We select waste gas, waste water, sulfur dioxide and other indicators as the main pollution indicators, according to the environmental pollution characteristics of Fengtai. We further obtain emissions data of Jiedaos and primary monitored enterprises on the basis of the pollution source census and environment statistics And we distribute the known data of the key monitoring enterprises with large emission to all the grids through the spatial matching. The remaining part of the emission data will be allocated, taking into account of the pollution emission conditions (productivity and total emissions of the enterprises, etc.) and the pollution volume will be distributed to the enterprises. Summarizing the grids of pollution emissions (waste water, waste gas, waste residue), it can get the class of various spatial pollution degrees. According to the value of from low to high, assign the value 1,2,3,4 respectively, the equation is as follows:
(4) where, L
iis comprehensive environmental impact of unit i, M
iis population
1
( )
n
n
i i
i i
M W
L
density of unit i, W
iis emissions intensity level of the pollutant factor, such as chemical oxygen demand (COD), ammonia nitrogen, sulphur dioxide and nitrogen oxides, and n is the species of pollutants. At last, through the Natural Breaks method, severity for environmental pollution can be divided into 4 grades, that is, low, medium, high, very high.
(1)Spatial distribution of population density
In this article, we adopt the population density to represent the exposure of sensitive receptor. Taking into account that it is difficult to reflect the spatial distribution features of population within the administrative region, while using traditional administrative unit to represent the population spatial information. This article will discuss the negative impacts of environmental pollution and environmental risk on the population under the micro scale.
Therefore, the first step is to solve the problem of population data gridding.
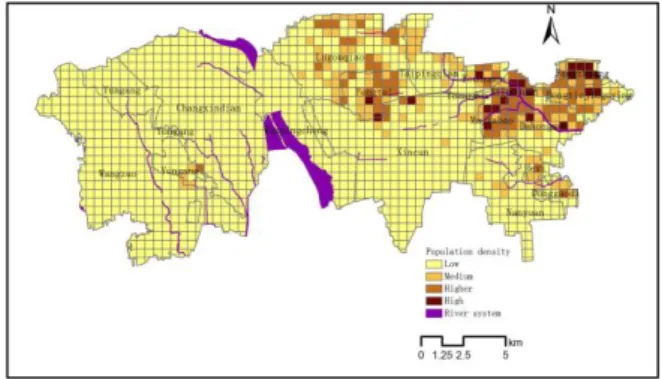
On the basis of the existing academic research on population density gridding (Yue et al., 2005; Ding et al., 2014), we using GIS spatial analysis technology to carry on the gridding of Fengtai population density (Figure 5), We find that the population of Fengtai District is mainly concentrated in the northern and eastern, especially in Jiedao like Dongtiejiangying, Fangzhuang, and Ma Jiabao, where have many grids with high level of population density.
As the core of Fengtai District, with the highest population density, it leads to the concentration of sensitive receptors, and pollution created in the process of residents' lives and enterprise production also has quite a big influence. In addition, the tourist area and rural area of Hexi area have little population distribution, because of the western area lies in the ecological conservation area, with A large number of mountains and farmland. In general, the spatial distribution of population from northeast to southwest presents a significant decline trend from urban core to urban fringe areas and to the suburbs. In particular, the population of the outer suburbs in Wangzuo and Changxingdian are small, and there is no high density grid.
Figure 5. Distribution of population density
(2) Evaluation of environment loads
In order to grasp the impact of the evaluation scale on the spatial
differentiation pattern, we conducted the summary statistics and comparison
for the emission of pollutant in 500m grid and Jiedao unit. What follows in
this article are the analysis results taking waste water and sulfur dioxide as
examples.
The results are shown in Figure 6-a and Figure 6-c. The areas concentrating the sources of pollution include: Taipingqiao, Xiluoyuan, Fengtai, Majiabao, Nanyuan, Fangzhuang, and the EE of these Jiedaos are relatively low, and they are the focus of environmental regulation. From the perspective of the spatial differentiation of various pollutants, the northern Jiedaos are the relatively rapid development area of Fengtai District, gathering many industries which cause a large amount of pollution emissions.
In addition, in the Yungang Jiedao and Changxindian Jiedao of Hexi area, the amount of emissions sulfur dioxide, nitrogen oxides and soot are quite large, which should be paid a special attention.
Because the spatial scope of Jiedao is fairely large, it is difficult to identify the extreme value of pollution, and this may bring some barriers to the actual environmental management. Therefore, we conducted the more detailed analysis by the unit of grid. Figure 6-b and Figure 6-d show the hot spots of the distribution of different pollution with 500 m * 500 m grid respectively. In Figure 6-b, for example, the Yungang and Changxindian marked with a circle existing in the pollution extremum point in wastewater discharge. The extreme value of Yungang is mainly caused by the intensive wastewater emission of the Beijing No.27 Vehicle Factory of China South Railway, and the extreme value of Changxindian is caused by the high intensity emission of wastewater of the China North Railway and two subsidiaries of the Capital Iron and Steel Corp.
a.
Wastewater discharge at Jiedao scaleb.
wastewater discharge on 500m gridc.
SO2 emission at Jiedao scaled.
SO2 emission on 500m grid Figure 6. Comparison of the spatial pattern of pollutant emission at different scalesTable 2 shows the high intensive emission of pollution source of each
Jiedao in Fengtai District. Taipingqiao, Xiluoyuan, Dongtiejiangying,
Majiabao, Fangzhuang, and Donggaodi, are the hot spots of distributing
many pollution sources, with the high environmental load. In general,
compared to the Hedong area where pollution is relatively concentrated, the
distribution characteristics of pollution sources of Hexi area is overall
scattered, but it also has some grids with extreme value, which have a huge
impact on the environment.
It can be seen that through the comparison of different spatial scales, there is obvious consistency on the evaluation results of the spatial distribution of pollution intensity in grid scale and in Jiedao scale. For example, Taipingqiao is characterized by high environmental pollution both in Jiedao scale and in grid scale, while Wanpincheng shows low pollution emissions in the aspect of the Jiedao and the grid. On the other hand, it also has some extreme points to cause that the intensity of pollution and pollution volume of Jiedao are not matched, such as Majiabao Jiedao. Obviously, when there are a large number of extreme value points, it would benefit for spatial environment control to explore the spatial difference pattern based in a more refined grid scale.
Table 2. Statistics of pollution discharge at Jiedao and extreme point Name of Jiedao,
town, and township
Waste water
Waste gas
Sulfur dioxide
Dust Industri al dust
Nitrog en oxide
COD
Taiping qiao ● ● ● ● ● ● ●
Xiluoyuan ● ● ● ● ●
Majiabao ● ▲ ● ●
Dongtiejiangying ● ● ● ●
Fangzhuang ● ● ●
Donggaodi ● ● ●
Fengtai ● ● ●
Lugouqiao ● ● ●
Youanmen ●
Yungang ▲ ● ▲ ▲
Changxindian ▲ ▲ ▲
Dahongmen ● ●
Xincun ● ● ●
Nanyuan ●
Wanpingcheng Heyi
Wangzuo
Note: “●” represents that it is subject to certain kind of pollutant; “▲” represents that existence of extreme point in the grid.
We calculate the integrated environmental load of all kinds of pollutants with formula (4), and the comprehensive evaluation results are shown in Figure 7. In terms of the spatial distribution, the pollution sources including wastewater, waste gas, sulphur dioxide and nitrogen oxides are mainly concentrated in the north of Hedong area, while the distribution of pollution sources in Hexi area are scattered, but it also needs to be monitored because of the existence of extreme value points.
Figure 7. Distribution of the impact of environmental pollution in Fengtai District
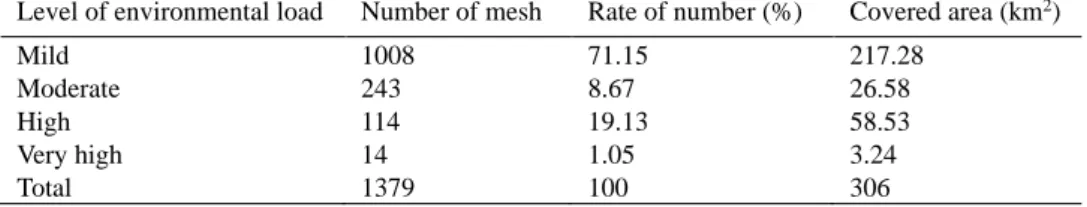
The statistics in Table 3 show that the number of grids with high and
very high-level environmental load accounts for 20.2% of the total area, and that of moderate level accounts for 8.7% of total area. If effective environmental control is absent, the moderate-level grids are likely to become high load area in the future. These areas are mainly distributed in the east of Yongding River with high concentrated population and intense pressure for land use in the process of urbanization. Many Jiedaos will still face with the environment pressure in the future.
Table 3. Statistics of areas with different impact level of environmental pollution
Level of environmental load Number of mesh Rate of number (%) Covered area (km2)
Mild 1008 71.15 217.28
Moderate 243 8.67 26.58
High 114 19.13 58.53
Very high 14 1.05 3.24
Total 1379 100 306
3.3 Environmental risk evaluation
The receptors of environmental risks in ICAs include residents and natural ecological system. We adopt the following equation to estimate R
i, the environmental risk of spatial unit i:
(5) where, R
iis the level of environmental risk in unit i, P
iis the exposure of environment receptors and F
iis the risk level associated with unit i.
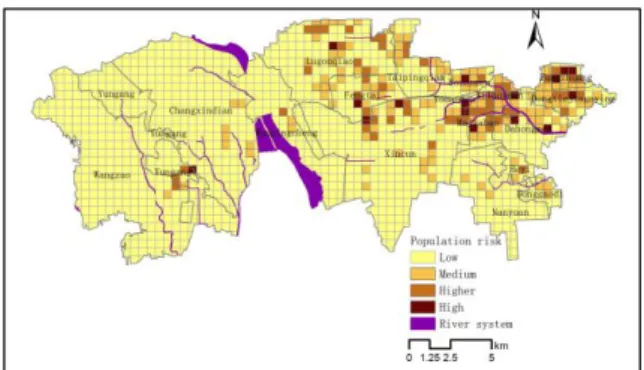
In view of the data limit, we primarily consider health risks of the population of residents, and evaluate the population risk caused by enterprises based on the quantity of enterprises and distribution of residential area. According to the pollution source census data and list of pollution sources of Fengtai District, we screen industries of poisonous, harmful, flammable and explosive, including petrochemical, chemical fuel, dangerous chemical production, storage and transportation, as well as hospitals as environmental risk source. Taking the level of risk source number in each grid as the substitute index of the level of risk source, based on the quantity of residential area in the grid. According to the number of residential districts in each grid, and refine the space for the resident population data to get the number of resident population in each grid to represent the sensitivity of receptor. According to equation (5), we get the spatial distribution of environmental risks of population (Figure. 8).
The results indicate that high environmental risk grids are primarily located in the northeast Jiedaos, such as Youanmen and Xiluomen, where are the economic development core of Fengtai District with large population, and would lead to a great loss in the event of sudden environmental risk events. Due to a certain spatial inertia of residential and business location, although the environmental protection department established the environment negative list, however, plenty of high-risk enterprises outside of the list, such as gas stations are still playing an irreplaceable role in the whole area with the difficulty to evade environmental risk by relocation in the short term. Aiming at this situation, the key in the urban planning is to define a reasonable protective distance, control the population density of the protection zone surrounding, strengthen the ability of prevention and supervision with the risk source, as well as to conduct the risk education to
i i
F
iR P
the surrounding residents.
Figure 8. The spatial variation of population risk in Fengtai district
4. COMPREHENSIVE EVALUATION AND SUGGETION
4.1 Integration of the indices in three aspects
In the above sections, we evaluate the socio-economic contribution, the environmental load and environmental risks at the 500m*500m grid network.
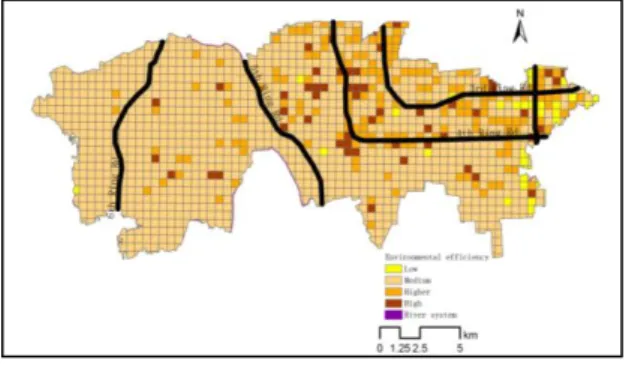
The EE of the ICAs can be comprehensively evaluated based on the above three aspects. Due to different measuring scales, it is hard to estimate EE by summing up directly each value in the grid. Therefore, we firstly standardize environmental pollution and environmental risk indices, including enterprise output, employment, waste water, waste gas and sulphur dioxide, respectively, and transform them into four hierarchies. According to the aggregated score of each grid, we can get the grid values of socio-economic contribution, environmental load and environmental risk respectively. On the basis of equation (1) and with a Natural Breaks method, we get the EE score of each grid. The ultimate spatial distribution of EE is shown in Figure 9.
It can be seen that the spatial layout of EE in Fengtai District has three
characteristics. The first is that the low EE grids have the tendency to
agglomerate towards the eastern central urban areas. The Jiedaos in the
Northeast, such as Fangzhuang and Dongtiejiangying have multiple low
value grids of EE. This indicates a certain relationship between EE and the
behavior of enterprises, which would prefer some location at the edge of
core urban areas in order to achieve a balance of convenient transportation,
proximity to urban market and easy access to information. The second is that
low value grids obviously concentrate along urban express ring roads. In
particular, the low value areas in the Hedong area are mainly distributed
between the fourth and the fifth rings of Beijing, highlighting that
traditional manufacturing industries with high levels of pollution (chemical,
furniture, beverages, metal processing) have strong transportation
dependence. The third is that areas with low EE accumulate around
wholesale markets. For example, there are many low-end industries in the
Dahongmen wholesale market with high pollution, and they make the place
difficult for environmental management. Overall, as the center of economic
development, Hedong area has higher concentration of industry and
population than Hexi area. Despite of a high economic contribution, the
score of environmental load and environmental risk is quite high, resulting in
poor EE in parts of Jiedao. As an important ecological barrier of the city center of Beijing, the Hexi area has carried out strict entry permission for industries for years, so the socio-economic contribution and environmental pressure of existing enterprises are relatively satisfactory.
Figure 9. Spatial difference of EE in Fengtai District
4.2 Suggestions for environmental regulation in Fengtai district
The analysis of EE has provided a variety of viewpoints to deal with the spatial planning and environmental problems in ICAs. From a new perspective, it can help local decision makers to understand and measure the social, economic and environmental performance of ICA areas, and provide basis for developing planning policies to reducing the environmental load and risk of specific areas.
According to spatial features of EE in Fengtai District, we propose the following policy suggestions on environmental control.
First, it is important to adjust the industrial distribution and increase environmental compatibility. The evaluation results of EE clarify the location of enterprises with high intensity pollution. The distribution of these pollution enterprises should be re-examined, in order to avoid the exacerbation of environmental problems because of unreasonable planning.
It is necessary to study the environmental compatibility of existing land use types, and adopt methods of segregation to separate living space and sensitive ecological space with specific production space such as petrochemical, metal products and chemical industries, which may yield harmful or poisonous substances.
Second, it is necessary to apply fixed-spot environmental management, i.e., setting sub-station and appointing managers to the lowest EE areas in ICAs. It is necessary in the pollution concentration areas and wholesale markets, it is anticipated that shrinking the unit of environmental management would improve the efficiency of environmental governance, such as for conducting in-depth analysis on the cause of conflict in each spot, and applying place-sensitive countermeasures.
Thirdly, according to the spatial characteristics of low EE areas, including center city-orientated, along urban express ring roads and market-orientated, some ecological corridor could be planned. Green space should be set up in a certain range, to form a spatial structure suitable to the mixture degree of ICAs so as to spatially prevent the negative effects of waste water, waste gas etc. on the living space and ecological space.
Finally, appropriate control on population increase should be
implemented, especially in identified areas of high environmental risks
brought by industrial concentration. Given the fact that polluting enterprises
may be difficult to relocate in short term, it is needed to make up supplementary plan to control the excessive mixture with population.
5. CONCLUSION
In china, the contradiction between economic development and environmental protection is very prominent. One of the important scientific problems needed to solve is how to design goals of environmental protection rationally according to the functions of different urban areas, and how to promote displacement of stock space and improve its function and efficiency through the assessment and space governance based on the evaluation for ICAs, where have the most sharp contradiction among the living space, ecological space and the industrial space. The existing planning and governance mode which relies on the land use and development intensity (volume ratio) control is difficult to realize the environmental control. In this paper, we put forward an evaluation system of EE for ICAs, through spatial analysis and semi-quantitative assessment, it could located and diagnosed environmental problems in ICAs. Main contributions in this paper including:
The first is that construct a theory model of urban EE evaluation for ICAs.
The concept of urban EE puts more emphasis on general urban areas, and paying attention to application of the evaluation results in the environment governance policies. Secondly, this paper presents a medium scale evaluation index system and technical process for EE assessment of ICA, and proposes the evaluation index system of three dimensions including socio-economic contribution, environmental load and environmental risk.
Especially, through the empirical analysis, it reveals the scale effect of EE evaluation. Taking Fengtai District as a case, it demonstrates the superiority of 500m*500m grid for EE evaluation with rationality compared with the administrative boundaries. In addition, based on the Beijing Fengtai case, this paper expounds the space control method on the basis of comprehensive EE evaluation results. The area of low EE value grids have the tendency to aggregate towards the central urban areas, the characteristics of distributed along urban express ring roads, the low value areas in the Hedong area are mainly distributed between the fourth and the fifth rings of Beijing, and the characteristics of distributed accumulate around wholesale markets, such as Dahongmen wholesale market area, the largest wholesale market of costume and cloth in Beijing and Hebei province. These conclusions provide a scientific basis for developing plans of spatial adjustment, environmental management, and population regulation.
The above research reveals the spatial characteristics of environmental efficiency brought by the industry and spatial structure, and it contributes to the planning policies of ICAs. A deficiency of the current study is that the evaluation index system and the method to integrate different indices need to be further improved. In addition, it is necessary to solve the bottleneck of the spatial resolution of EE assessment through integration of a wider range of data sources.
ACKNOWLEDGMENTS
This research is conducted with the support of the Natural Science
Foundation of China (NSFC No. 41171138) and grant from the Key Programs of the Chinese Academy of Sciences (NO.KZZD-EW-06).
REFERENCES
Bai, C.-E., Du, Y., Tao, Z., & Tong, S. Y. (2004). "Local Protectionism and Regional Specialization: Evidence from China's Industries". Journal of international economics, 63(2), 397-417.
Bleischwitz, R. (2003). "Cognitive and Institutional Perspectives of Eco-Efficiency".
Ecological Economics, 46(3), 453-467.
Casper, S. (2007). "How Do Technology Clusters Emerge and Become Sustainable?: Social Network Formation and Inter-Firm Mobility within the San Diego Biotechnology Cluster".
Research Policy, 36(4), 438-455.
Cohen, J. P., & Paul, C. J. M. (2005). "Agglomeration Economies and Industry Location Decisions: The Impacts of Spatial and Industrial Spillovers". Regional Science and Urban Economics, 35(3), 215-237.
de Leeuw, F. A. A. M., Moussiopoulos, N., Sahm, P., & Bartonova, A. (2001). "Urban Air Quality in Larger Conurbations in the European Union". Environmental Modelling &
Software, 16(4), 399-414.
Ding, W., Li, X., Li, Z., Zhang, Y., & Temu, Q. (2014). "Population and Housing Grid Spatialization in Yunnan Province Based on Grid Sampling and Application of Rapid Earthquake Loss Assessment: The Jinggu Ms6. 6 Earthquake". Geodesy and Geodynamics, 5(4), 25-33.
Färe, R., Grosskopf, S., & Hernandez-Sancho, F. (2004). "Environmental Performance: An Index Number Approach". Resource and Energy economics, 26(4), 343-352.
Fei, W., Liu, X., & Yang, C. (2015). "Economic and Environmental Efficiencies Based on Material Flow Analysis and Data Envelopment Analysis: A Case Study of Liaoning Province". Acta Ecologica Sinica, 35(11), 3797-3807.
Freeman, M. A., Haveman, R. H., & Kneese, A. V. (1973). The Economics of Environmental Policy.The Economics of Environmental Policy. New York: John Wiley & Sons.
Gai, M., Lian, D., & Tian, C. (2014). "The Research for Liaoning Environmental Efficiency and Spatial-Temporal Differentiation". Geographical Research, 33(12), 2345-2357.
Gowd, S. S., Reddy, M. R., & Govil, P. (2010). "Assessment of Heavy Metal Contamination in Soils at Jajmau (Kanpur) and Unnao Industrial Areas of the Ganga Plain, Uttar Pradesh, India". Journal of Hazardous Materials, 174(1), 113-121.
Hannigan, T. J., Cano-Kollmann, M., & Mudambi, R. (2015). "Thriving Innovation Amidst Manufacturing Decline: The Detroit Auto Cluster and the Resilience of Local Knowledge Production". Industrial and Corporate Change, 24(3), 613-634.
Huppes, G. (2009). "Eco-Efficiency: From Focused Technical Tools to Reflective Sustainability Analysis". Ecological Economics, 68(6), 1572-1574.
Kerr, W., & Ryan, C. (2001). "Eco-Efficiency Gains from Remanufacturing: A Case Study of Photocopier Remanufacturing at Fuji Xerox Australia". Journal of Cleaner Production, 9(1), 75-81.
Kuosmanen, T. (2005). "Measurement and Analysis of Eco‐Efficiency: An Economist's Perspective". Journal of Industrial Ecology, 9(4), 15-18.
Liu, J. J., Dong, S. C., & Li, Z. H. (2011). "Comprehensive Evaluation of China’s Water Resources Carrying Capacity". Journal of Natural Resources, 26(2), 258-269.
Ma, L., Jin, F. J., & Liu, Y. (2012). "Spatial Pattern and Industrial Sector Structure Analysis on the Coupling and Coordinating Degree of Regional Economic Development and Environmental Pollution in China". Acta Geographica Sinica, 67(10), 1299-1307.
Maia, R., Silva, C., & Costa, E. (2016). "Eco-Efficiency Assessment in the Agricultural Sector:
The Monte Novo Irrigation Perimeter, Portugal". Journal of Cleaner Production, 138(2), 217-228.
Martin, R., & Sunley, P. (2003). "Deconstructing Clusters: Chaotic Concept or Policy Panacea?". Journal of economic geography, 3(1), 5-35.
McIntyre, R. J., & Thornton, J. R. (1978). "On the Environmental Efficiency of Economic Systems". Soviet Studies, 30(2), 173-192.
Mickwitz, P., Melanen, M., Rosenström, U., & Seppälä, J. (2006). "Regional Eco-Efficiency Indicators–a Participatory Approach". Journal of Cleaner Production, 14(18), 1603-1611.
Nguyen, Q. A., & Hens, L. (2015). "Environmental Performance of the Cement Industry in
Vietnam: The Influence of Iso 14001 Certification". Journal of Cleaner Production, 96, 362-378.
Peng, J., Jiang, Y., Wu, J., & Liu, S. (2005). "Eco-Environmental Effects of Mining and Related Land Reclamation Technologies in China". Progress In Geography, 24(2), 38-48.
Reith, C. C., & Guidry, M. J. (2003). "Eco-Efficiency Analysis of an Agricultural Research Complex". Journal of environmental management, 68(3), 219-229.
Ren, J.-M., Yu, Y.-X., & Wang, R.-S. (2009). "Problems and Countermeasures of Agricultural Environment in China". Chinese Journal of Ecology, 28(7), 1399-1405.
Schaltegger, S., & Sturm, A. (1990). "Ökologische Rationalität: Ansatzpunkte Zur Ausgestaltung Von Ökologieorientierten Managementinstrumenten". die Unternehmung, 44(4), 273-290.
Schaltegger, S., & Synnestvedt, T. (2002). "The Link between ‘Green’and Economic Success:
Environmental Management as the Crucial Trigger between Environmental and Economic Performance". Journal of Environmental Management, 65(4), 339-346.
Schmidheiny, S. (1992). Changing Course: A Global Business Perspective on Development and the Environment. Cambridge, MA: MIT press.
Shi, X., Li, X., Zhao, L., & Yang, J. (2012). "Resources Metabolism Analysis for the Pulp and Paper Industry in Wuhan, China". Shengtai Xuebao/Acta Ecologica Sinica, 32(24), 7706-7715.
Virkanen, J. (1998). "Effect of Urbanization on Metal Deposition in the Bay of Töölönlahti, Southern Finland". Marine Pollution Bulletin, 36(9), 729-738.
Wang, J. N., Xu, Z. C., Hu, X.-B., Peng, X.-c., & Zhou, Y. (2010). "Analysis of Environmental Efficiencies and Their Changes in China Based on Dea Theory". China Environmental Science, 30(4), 565-570.
Yuan, H., Huang, Z., & Xu, P. (2016). "A Framework for Eco-Efficiency of C&D Waste Management". Procedia Environmental Sciences, 31, 855-859.
Yue, T. X., Wang, Y. A., Liu, J. Y., Chen, S. P., Qiu, D. S., Deng, X. Z., . . . Su, B. P. (2005).
"Surface Modelling of Human Population Distribution in China". Ecological modelling, 181(4), 461-478.
Zaim, O., & Taskin, F. (2000). "A Kuznets Curve in Environmental Efficiency: An Application on Oecd Countries". Environmental and resource economics, 17(1), 21-36.
Zeng, D.-Z., & Zhao, L. (2009). "Pollution Havens and Industrial Agglomeration". Journal of Environmental Economics and Management, 58(2), 141-153.