Analysis on long‑term bed adjustment to human impacts and bore inundation in a lower river
著者 ダン ミン ハイ
著者別表示 Dang Minh Hai journal or
publication title
博士論文要旨Abstract 学位授与番号 13301甲第3960号
学位名 博士(工学)
学位授与年月日 2013‑09‑26
URL http://hdl.handle.net/2297/37359
Creative Commons : 表示 ‑ 非営利 ‑ 改変禁止 http://creativecommons.org/licenses/by‑nc‑nd/3.0/deed.ja
1
Abstract
In the first part, an attempt was made to clarify the effects of sediment extraction and dam construction on the change in the riverbed characteristics over yearly to decadal scales in the lower Tedori River, Japan. The results indicate that the riverbed degraded in excess of 0.5–3.5 m in the entire study area over the period 1950–1991. Concurrently, the riverbed sediment volume of the reach 0–16 km decreased by 12.7
106m
3. The intensive sediment extraction was the dominant cause of degradation of the riverbed in this period. In the period 1991–2007, the increase in the riverbed sediment volume of 0.6
106m
3was observed. Operation of the Tedorigawa Dam was responsible for the degradation. Temporal change in the riverbed elevation during the period 1950-2007 indicates that it experienced five phases of adjustment and an established empirical model well described four of such phases. Over the period 1950–1979, the response of the riverbed and its controlling factors were clearly captured by the first four modes of EOF analysis.
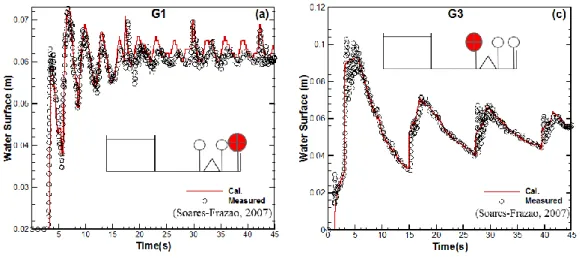
In the second part, a numerical model is developed to solve the Nonlinear Shallow Water Equations on the basis of TVD-MacCormack scheme in order to reproduce the bore propagation over a channel with complex topography. The model incorporates the surface gradient method, the improved surface gradient method and a simple wetting and drying method. The model was verified with several analytical solutions. Excellent agreement between analytical and numerical results was achieved. Subsequently, the model was validated with the experimental data. In general, numerical results agree well with the experimental one and the high applicability of the developed model has been validated.
Long term response of the riverbed to sediment extraction and dam construction
1.
1.1. Needs and objective
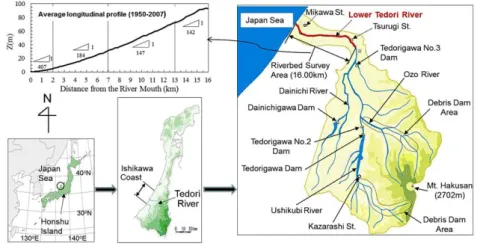
Figure 1. Tedori River Basin
Comprehensive understanding of the long-term variation in the riverbed in relation to
its controlling factors is essential to the rational management of disturbed rivers. Recently,
the Tedori River, Ishikawa, Japan has been profoundly affected by continuous
2
anthropogenic activities such as dredging activities, sand and gravel mining and multi- purpose constructions. These impacts have induced intensive change in the riverbed elevation as well as the corresponding riverbed sediment volume from 1950 and 2007.
The present study uses a 58-year topographic survey of the lower Tedori River (Fig. 1), Japan and related data on human impacts to clarify the characteristics of long-term adjustments of the riverbed.
The specific objectives of the present investigation are (i) to analyze the variation in the riverbed of the lower Tedori River, focusing on establishing an empirical model of temporal variation in the riverbed elevation, (ii) to quantify the effect of sediment extraction and Tedorigawa Dam construction on the riverbed, and (iii) to highlight the variation in the riverbed in relation to its controlling factors through Empirical Orthogonal Function (EOF) analysis.
1.2. Anthropogenic impacts in the Tedori River
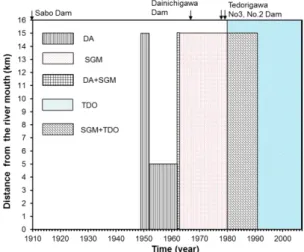
During the 20th century, the morphological features of the lower Tedori River were strongly affected by a variety of anthropogenic activities (Fig. 2). Such activities including dredging activity (DA), sand and gravel mining (SGM), Tedorigawa dam construction (TDO) and sabo dam construction significantly reduced the sediment supply and changed the flow regime of the lower Tedori River. Among these human activities in the Tedori River, sand and gravel mining was considered as the most serious impact on the riverbed change.
Figure 2. Temporal and spatial ranges of anthropogenic effects on the Tedori River (DA: Dredging activities; SGM: Sand and gravel mining; TDO: Tedorigawa Dam operation).
1.3. Vertical adjustment
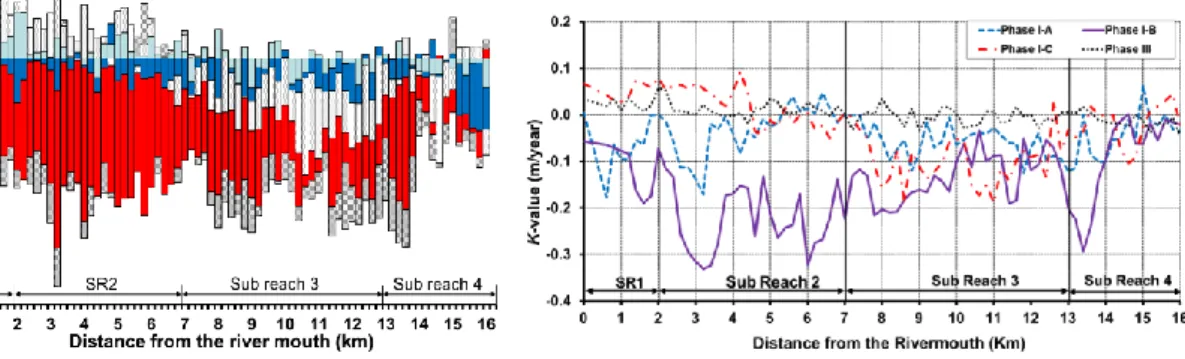
The eroding depth was in excess of 0.30–3.50 m over the period 1950–2007 (Fig. 3).
The adjustments of the riverbed simultaneously occurred along the lower Tedori River.
Temporal change in the riverbed elevation during the period 1950-2007 indicates that it
experienced five phases of adjustment and an established empirical model well described
four of such phases (Fig. 4). The sub period (I) 1950-1979 includes first three phases I-A,
I-B and I-C. Given the paucity of data, the sub period (II) 1979–1991, assumed as phase II,
3
was not described by the empirical model. The remaining sub period (III) 1991-2007 corresponded to the phase III. Depending on the magnitude and extent of sediment extraction, the riverbed degraded moderately in phase I-A and rapidly in phase I-B; in phase I-C, the aggradation was observed in the downstream area while the riverbed remained degraded in the upstream area. The slight to moderate degradation was observed in the phase II. Subsequently, the light variation in the riverbed was witnessed in phase III.
This indicates that the Tedori River was gradually re-gaining its equilibrium condition after the cease of sand and gravel mining in 1991.
Figure 3. Variations of the riverbed elevation of the Tedori River (T.P.) in different phases.
Figure 4. Temporal and spatial variations in the rate of vertical adjustment
1.4.Horizontal variation
No significant change in the major morphology of the lower Tedori River has been observed since 1950. The embankment has confined the river channel, resulting in no widening due to no bank failure in the lower Tedori River during the period 1950-2007.
However, the variation in the riverbed elevation is accompanied with the variation in the bankfull channel width: namely, decreased bankfull width and the river bed degradation;
increased bankfull width and the river bed aggradation. The river configuration changed from braided in 1955 into transitional patterns in 1968. Subsequently, the river pattern became braided in 2000.
1.5. Variation in sediment budget components
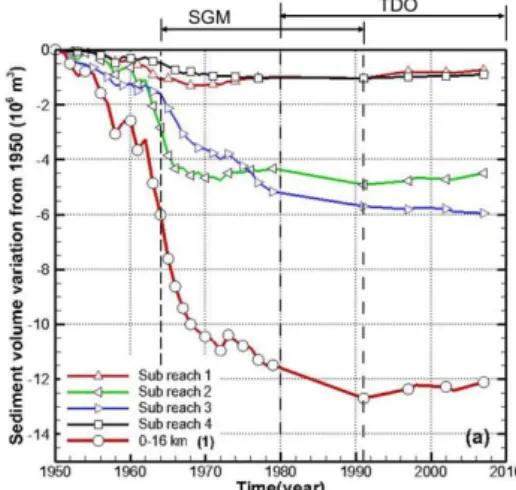
Overall variation in the riverbed sediment volume (RSV) for all the spatial scales was a significant decrease from 1950 to 1979, and there was subsequently a slight decrease until 1991 (Fig. 5). RSV of the study area decreased at 0.38 10
6m
3/yr during the first 30 years, then declined gradually at 0.09 10
6m
3/yr from 1979 to 1991 (Fig. 6). The decrease in RSV as shown above was primarily a consequence of the extraction rate being higher than the replenishment rate of upstream bed sediment (Fig. 6).
From 1991 to 2007, RSV of the study area increased at 0.04 10
6m
3/yr (Fig. 6). Such
a trend was attributed to the sediment supplied from the Ozo River in flood seasons at the
estimated rate of 0.11 10
6m
3/yr and a substantial reduction in the sediment-carrying
4
capacity of the lower river because of construction of the Tedorigawa dam. Additionally, vegetation cover in the lower Tedori River could partially contribute to slight aggradation from 1991 to 2007. This is also is indicated by a significant correlation (Spearman R=- 0.83, p<0.1) between increase in vegetation cover and reduction in the cumulative variation of the riverbed sediment volume.
Figure 5.Temporal variation of sediment volume in the lower Tedori River
Figure 6. Temporal variation in components of sediment budget of the lower Tedori River 1.6. EOF analysis
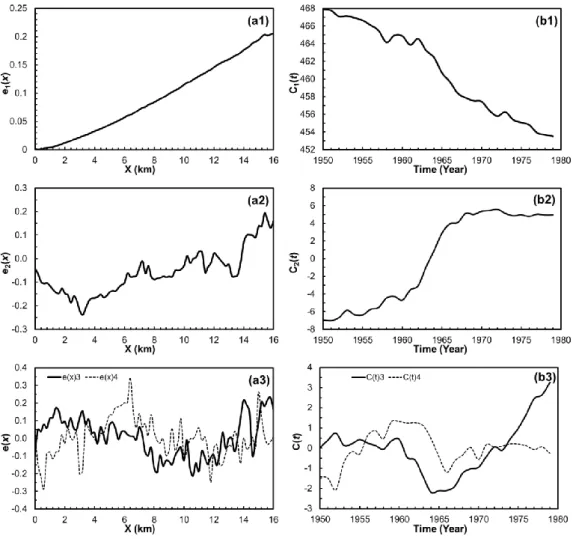
EOF analysis was applied to highlight the decadal variation in the riverbed level and its controlling factors over the period of 1950-1979. The variance associated with the first eigenfunction was 99.9854% of total variability of the data. The second, third and fourth modes account for 0.0119%, 0.0008% and 0.0003% of the variations, respectively. The spatial function of the first mode e
1(x) (Fig. 7a1) represents the longitudinal profile of the mean riverbed over the period 1950–1979. C
1(t) is considered to strongly correlate (with correlation coefficient R
2=0.97) to the reduction in the riverbed sediment volume of the reach of 0–16 km from 1950 to 1979. The spatial function of the second mode e
2(x) (Fig.
7a2) is found to reflect the variations in the rate of the vertical adjustment of the riverbed
for phase I-B (R
2=0.48). C
2(t) most likely corresponds (R
2=0.97) to the trend of the
variation in SGM. e
3(x) is considered to correlate (R
2=0.58) to the variation in the rate of
the vertical adjustment of the riverbed in the phase I-C. C
3(t) was considered to reflect
both SGM from 1974 to 1979 and imbalance between sediment transport capacity and
sediment supply. e
4(x) (Fig. 7a3) could be interpreted (R
2=0.56) as the variation in the
rate of the vertical adjustment over the phase I-A. A highly significant correlation
(R
2=0.89) exists between C
4(t) and the curve describing the cumulative volume of DA
from 1949 to 1963. In addition, a collation of river and coastal EOF results indicates that
the time lag of the onset of accelerated erosion in Mikawa coast was several years when
compared with that in the downstream river.
5
Figure 7. Temporal and spatial eigenfunctions for the first four modes: (a1) the first spatial eigenfunction;(b1) the first temporal eigenfunction; (a2) the second spatial eigenfunctions;(b2) the second temporal eigenfunctions; (a3) the third and fourth spatial eigenfunctions;(b3) the third and fourth temporal eigenfunctions
Numerical study on bore propagation over a channel with complex topography
2.
2.1. Needs and objective
Recently, tsunami intrusions on inland in general and into rivers in particular following massive earthquakes have more frequently taken place in several countries. As a result of this, the increasing water level in the river may cause damages in the upstream area far from the coastline. In order to mitigate the destruction due to the tsunami intrusion, it is necessary to understand the behavior of bore under different boundary conditions. For this purpose, numerical simulation is considered as a powerful tool to reproduce various hydrodynamic processes.
The object of this part is to develop a numerical model which is capable of solving the
Nonlinear Shallow Water Equations based on the TVD-MacCormack scheme. It aims to
achieve well-balancing property through modifying local bed elevation and using the
surface gradient instead of the depth gradient for TVD corrections. Concurrently, the
model is capable of capturing well the moving wet-dry interface by incorporating with the
6
surface gradient method. The accuracy and robustess of the model will be tested against several analytical solutions and experimental data in order to confirm that the model is able to simulate the 1D, 2D discontinuous flow over a complex topography. The model is then applied to the study of wave run up over banks of a curved channel with a parabolic cross-section.
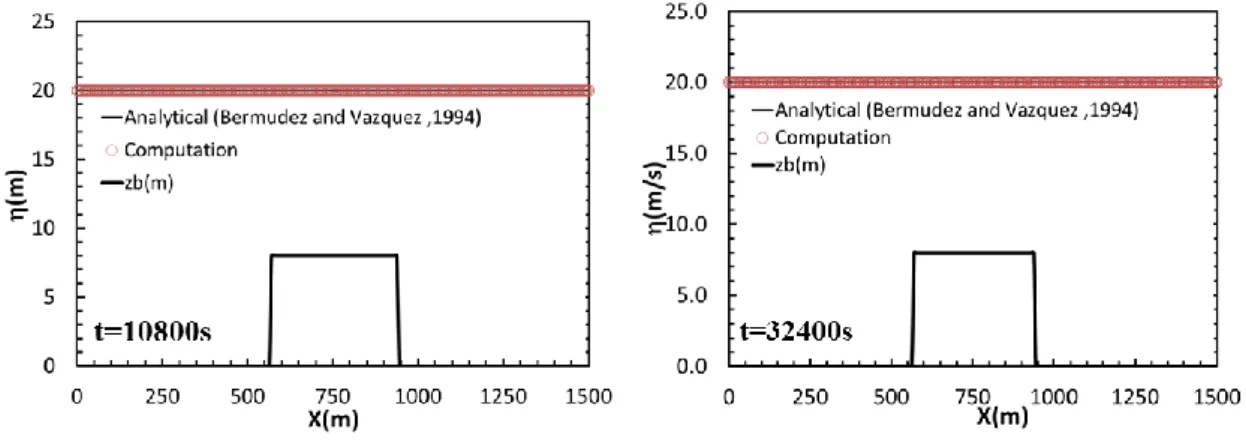
2.2. Tidal wave over steps
To validate the well-balanced ability of the model in reproducing the flow over the abruptly varying topography, tidal wave over two steps is investigated. Figure 8 reveals that the numerical results for water surface agree very well with the analytical ones (Bermudez and Vazquez, 1994). The water surface is constant along the channel. The model has proven its well-balanced capability of dealing with the complex topography.
Figure 8. Tidal wave over steps
2.3. Long wave oscillation in a canal with a parabolic cross-section
Figure 9. Comparison between the analytical and numerical water oscillation
The numerical model is further validated through comparison with the theory for the
long wave oscillation in a canal with a parabolic cross-section (Thacker, 1981). The
comparison between the numerical and analytical water surface considered reveals very
good agreements (Fig. 9). No obvious distortion is found in the wet-dry interface. This
result thus validates the high capability of the numerical model in tracking the moving
boundary on a sloping bathymetry.
7