クリープ・非地震性滑り)によって歪みを解消している 非 地 震 性 滑 り 領 域 と さ れ る。 例 え ば,2000年東海ス ロースリップイベントは,アスペリティ領域の深部延長 で発生している (Ohta et al., 2004)。このような非地震 性の滑りは,地震発生層の深部延長だけではなく,アス ペリティ領域の浅部延長や断層走行方向にも存在するこ とが期待される。これらは断層の歪み蓄積過程を知る上 で極めて重要な情報にもかかわらず,現状の日本の観測 網では詳細に把握することは難しい。沈み込み帯での観 測では,アスペリティは多くの場合海底下であり直上で
はじめに
日本を含むプレート境界に位置する地域は,定期的に そのプレート境界部で発生するプレート間巨大地震によ り繰り返し災害を被ってきた。プレート間の巨大地震発 生モデルとして,アスペリティモデルが提案されている (Lay and Kanamori, 1980;Lay and Kanamori, 1981)。プ レート境界部には,アスペリティ (固着域) と称される, 通常時強く固着して歪みを蓄積し,地震時に大きく滑る 領域があり,その周辺部は,ゆっくりとした滑り(断層村瀬雅之
*・松多信尚
**・小澤和浩
**・Cheng-Hong Lin
***・Wen-Shan Chen
****・Jui-Jen Lin
***The Longitudinal Valley fault, a major reverse fault dipping eastward in eastern Taiwan, is commonly considered as the collision boundary between the Eurasian plate and Philippine Sea plate. Some aseismic creep motions had been detected across the central and southern part of the Longitudinal Valley fault based on the GPS measurements and creep-meters. In order to discuss the spatio-temporal distribution of the aseismic creep motion in the central part of this fault, we established four precise leveling routes (the Yuli , Dongli , Fuli , and Chike-shan routes). At first, four precise leveling surveys along the Yuli route were repeatedly conducted in every August from 2008 to 2011. The overview of the deforma-tion detected in the Yuli route is as follows. An uplift rate of about 30 mm/year has been detected within 2 km in width across the fault. To the east of the fault, the uplift rate gradually reduce eastward with the distance, and down to 15 mm/ year at the east coast. Since there was no significant earthquake occurred in the fault during the 3-year observation peri-od, the detected deformation has been resulted from the aseismic creep motion. The creeping motion might occur at the same location of the fault with a constant rate in that the deformation denoted the same tendency and rate during all mea-surement periods. Furthermore, we conducted another three routes in the Dongli, Fuli, and Chike-shan areas to detect the spatial distribution of the aseismic creep motion in August 2010 and 2011. The results show vertical deformation rates of 25 mm/year and 10 mm/year were detected in the Fuli route and the Chike-shan route, respectively.
Keywords: Taiwan, Longitudinal valley fault, precise leveling survey, aseismic creep motion
水準測量によって検出された台東縦谷断層中部における
大規模断層クリープ現象(
2008-2011)
Large Aseismic Creep Detected by Precise Leveling Survey at the Central Part of
the Longitudinal Valley Fault, Southeast Taiwan (2008-2011)
Masayuki MURASE
*, Nobuhisa MATSUTA
**, Kazuhiro OZAWA
**, Cheng-Hong Lin
***,
Wen-Shan Chen
****and Jui-Jen Lin
****(Received October 31, 2011)
* Department of Geosystem, College of Humanities and Sciences, Nihon University: 3-25-40 Sakurajousui, Setagaya-ku, Tokyo 156-8550, Japan
** Graduate School of Environmental Studies, Nagoya University: D2-1(510), Furo-cho, Chikusa-ku, Nagoya, JAPAN 464-8601
*** Institute of Earth Sciences, Academia Sinica: No. 128, Sec. 2, Academia Rd., Nankang, Taipei, Taiwan (R.O.C.)
**** National Taiwan University: No. 1, Sec. 4, Roosevelt Road, Taipei, Taiwan (R.O.C.) * 日本大学文理学部地球システム科学科: 〒156-8550 東京都世田谷区桜上水3-25-40 ** 名古屋大学環境学研究科: 〒464-8601 名古屋市千種区不老町 D2-1(510) *** 中央研究院地球科学研究所(中華民国台湾) **** 国立台湾大学(中華民国台湾)
の精密な地殻変動観測は困難であるため,アスペリティ 周辺の浅い部分で起こる非地震性滑りに関しては,ほと んど先行研究が存在しない。 そこで,本研究では,陸上に存在するプレート境界断 層である台東縦谷断層を対象にすることで,アスペリ ティ周辺の非地震性滑り領域において,どのような現象 が進行しているのかを明らかにすることを目指す。台東 縦谷断層は,陸上に存在する断層であるため,直上での 稠密かつ精密な測量によって,詳細な地殻変動の取得が 可能である。また,陸上であるために,地形や地質に関 する調査も容易であり,得られた地殻変動と比較検討す ることによってアスペリティ領域と非地震性滑り領域の 地質的な違いを議論することも可能になる。 ここでは台東縦谷断層の概要を記す。台湾島はユーラ シア プ レ ー ト と フ ィ リ ピ ン 海 プ レ ー ト が82mm/year (Yu et al., 1997) で収束し,フィリピン海プレート上の ルソン弧がユーラシアプレートに衝突する造山帯である (Chai, 1972; Biq, 1973; Bowin et al., 1978; Teng, 1996)。 台湾島の中央部には,西ほど変成度が低い変成岩から構 成される4000m近い標高の中央山脈があり,東海岸に はルソン弧の島弧岩体で構成される1000m前後の海岸 山脈がある (e.g. Chen, 1988, Ho, 1988)。両山脈の間に は台東縦谷と呼ばれる長さ150km・幅 4kmの南北に延 びる谷があり,地質学的なプレート境界となっている (Fig.1)。その縦谷の東縁に東上がりの逆断層である台 東縦谷断層が走っている (Ho, 1986)(Fig.2a)。海岸山 脈を構成する島弧の岩体は,中新統から鮮新統初期の火 山岩とタービダイトの堆積物からなり,南部ではリッチ メランジェと呼ばれる前弧海盆が著しく短縮し,堆積岩 がつよい剪断を受け粘土化した地層が発達し,台東縦谷 断層に接する。この地層中にみられる苦鉄質とウルトラ 苦鉄質の岩石断片は海洋地殻の断片の可能性があり,そ の考えに基づけばこのリッチメランジェは衝突帯になる 前の沈み込み帯で形成されたと考えられる (e.g., Chang et al., 2001)。リッチメランジェ中には数キロの砂岩の ブロックなどが分布している (陳・王,1996)。 台東縦谷断層は1951年に地表地震断層を出現させる 地震を立て続けに起こした。地表地震断層は光復の南か ら池上の南まで報告されている (Hsu, 1962;Shyu et al., 2005, 2007)。この断層の北部の活動度は古地震学的調査 から,活動間隔が約150年間隔 (Yen et al., 2008),170- 210年間隔 (Chen et al., 2007) で地震を発生させると考 えられている。トレンチ掘削調査の壁面から求めた平均 変位速度は17-24.4mm/year (Yen et al., 2008) とされる。
近年の地球物理的・測地学的な手法において,断層の 北部地域と中部~南部地域は性質が異なる事が報告され ている。GPS観測によって,台東縦谷断層において高 い歪み速度が検出されている。断層は,北部と中・南部 地域で歪み速度や変化のパターンが異なっており,中・ 南部地域の歪み速度は北部地域に比べて高く台東縦谷断 層を挟んで急激に変化している (Yu et al.,1997)。加え て,池上(断層南部)に設置されたクリープメータに よって非地震的に進行する地殻変動が検出されている (Lee et al., 2003)。また,地震波トモグラフィーの結果 からは,断層中部地域では地下浅部10 km程度まで高 Vp/Vs域が推定されており,水の存在が示唆される (Wu et al., 2007)。 上述の先行研究をまとめると,台東縦谷断層の地下浅 部では,北部地域で固着し,中部~南部地域でゆっくり とした非地震性滑りが進行していると示唆される。一般 的に非地震性滑り領域では,非地震性滑りによってひず みが解消されており大きな地震が発生しないと考えられ ている。しかし,1951年の地震発生が示すように,台 東縦谷断層中・南部の非地震性滑りが報告されている地 域においても地震を発生する能力がある事は明らかであ る。つまり,台東縦谷断層の中部・南部では非地震性滑
120˚
122˚
22˚
24˚
0
50
km
Central
Range
(中央山脈)←Coastal
Range
(海岸山脈)Longitudinal
valley
(台東縦谷断層)Fig.1 Location of the Longitudinal Valley in Taiwan. The Longitudinal Valley, marked by two arrows, is a narrow valley located between the central mountain range and the coastal mountain range.
震防災にも役に立つことが期待される。 上記目的を達成するには,長期にわたる地殻変動調査 が必要であり,今後も継続して調査を続けていく予定で ある。本稿では,台東縦谷断層中部において2008年~ 2011年に行われた水準測量のデータを示し,台東縦谷 断層中部のクリープ現象の時間・空間的な変化を速報と して報告する。なお,2008年の調査については,村瀬・ 他 (2009) に報告済みであるため,本稿では詳細を省く こととする。
精密水準測量の概要
本研究では,クリープ現象の空間分布を把握するため に,台東縦谷断層中部に位置する瑞穂郷・玉里鎮・富里 郷にわたる複数の水準測量路線を新設した。ここでは, 複数回の測定がなされ,地殻変動が明らかになっている 玉里路線,東里路線,富里路線,赤科山路線の4 路線に ついて,概要を記す。 り領域と固着領域が複雑に分布していることが予想され る。しかし,池上に設置されているクリープメータで検 出できるのは地表面での食い違い変位のみであり,断層 の非地震性滑り領域がどの程度の深さまで続いているの かは明確になっていない。また,クリープメータが設置 してある領域は池上郷の狭い領域に限られており,断層 中部・南部において非地震性滑り領域がどのように空間 分布しているのか明らかになっていない。詳細な地殻変 動観測をおこなうことにより,非地震性滑りが起こって いる領域を明らかにすることは重要である。また,近年 発見されている短期的・長期的なスロースリップ現象の ように,非地震性滑りを起こしている場所や滑り量が時 間変化をする可能性も考えられ,長期にわたる調査の継 続が必要である。これら台東縦谷断層中部における,非 地震性滑り領域と固着領域の分布を明らかにすること は,地震学的に重要であるだけでなく,台東縦谷断層周 辺における地震発生可能性を評価する事につながり,地121˚30'
23˚00'
23˚30'
24˚00'
0
10
20
km
North
Part
Central
Part
South
Part
Longitudinal
valley fault
→
(Locked)
(Creeping)
121˚18'
121˚24'
23˚12'
23˚18'
23˚24'
0
5
km
Pacific
Ocean
Longitudinal
valley fault
(台東縦谷断層)→
Yuli route
(玉里路線)
(2008年設置)
Chike-shan route
(赤科山路線)
Fuli route
(富里路線)
↑
Dongli route
(東里路線)
(a)
Longitudinal valley
(b)
Central part of Longitudinal valley
(Transition
area)
Fig.2 (a) Locations of the Longitudinal Valley, divided into north, central and south parts. The Gray line denotes the Longitudinal Valley fault. Black lines denote the precise leveling routes in the central part.
(b) Detailed map in the central part of Longitudinal valley for showing the Yuli leveling route (solid-black line) installed at 2008 as well as the Chike-shan route, the Dongli route, and the Fuli route (dashed lines) installed at 2010.
2010年 8月,2011年 8月の 2 回測定がなされた。 水準点は,断層の近傍では約100m間隔,それ以外の 場所でも約300m間隔と稠密な配置をおこなった。水準 点は既存コンクリート構造物上にステンレスピンを設置 した簡易的なものであるが,御嶽山や台湾七星山で行わ れた水準測量により水準点としての安定性を十分に持つ ことが確認されている (e.g., Kimata et al. 2004 ;Murase et al. 2007)。 測定には国土地理院認定1 級指定のLeica社製電子レ ベルDNA03と,インバールバーコード標尺GPCL3 を使 用した。測定は往復2 回行い,往復誤差を用いて後に測 量の誤差を議論することとする。測量時,往復誤差の許 容範囲として式(1)に示す国土地理院の1等水準測量 の基準値を用いた。 δ=2.5
√
L ・・・(1) こ こ でδ は 許 容 範 囲 (mm),Lは 水 準 点 間 の 距 離 (km) である。(1) で計算される閾値を往復誤差が超え た場合は,閾値以内に収まるまで再測量をおこなうこと とした。観測結果
玉里路線の2009年8月,2010年8月,2011年8月の測 量結果をTable 1 に示す。 2008年8月の測量結果は,村 瀬・他(2009)を参照されたい。東里路線の2010年8 月,2011年8月の測量結果をTable 2 に示す。富里路線 の2010年8月,2011年8月 の 測 量 結 果 をTable 3 に 示 す。赤科山路線の2010年8月,2011年8月の測量結果を Table 4 に示す。水準測量の測量誤差
水準測量の測量誤差としては,主に以下の2 つがあげ られる。測定毎に発生するランダムな誤差と,系統誤差 である。 水準測量のランダムな誤差は,水準点間を2回測定す ることによる往復誤差と,水準路線が環をなしている場 合にその閉合誤差によってチェックが可能である。本研 究で設置された路線は環をなさないため,往復誤差に よって精度の検討をおこなった。 環をなさない水準路線におけるランダムな測量誤差 σ (h)として,以下の式が提案されている。 σ (h)=―
β
√
j
√
L ・・・(2) 玉里路線では玉里―長浜間の約28 kmに123点の水準 点を設置した (Fig.2b)。この路線より約 6km北に台湾 国営鉄道の東部幹線の旧鉄橋があり,その橋脚に目視で 確認できるほどの高低差が生じており,この地域で大規 模な断層クリープが起こっていることが予想される。ま た,約6km程度の短路線であるが,1986年-1996年に 水準測量が行われ,約24mm/yearで進行する上下変動 が検出されている (Yu and Kuo, 2001)。本研究では,東 海岸までの長路線を測定することにより,現在まで明ら かになっていない,非地震性滑りが起こっている深さに ついて推定することを目指している。玉里路線は2008 年8月に水準点を設置し第一回測定をおこなった。その 後,2009年 8月,2010年 8月に路線全体の再測量をおこ なっている。2011年は,時間の関係上,断層近傍の約 10km (MB101~BM166-1) のみを再測量した。 東里路線は,玉里路線の支線である (Fig.2b)。玉里路 線のBM119より分岐するこの路線は,21点の水準点で 構成され路線長は約2kmである。2010年に設置され, 2010年 8月,2011年 8月の 2 回測定された。玉里路線 は,東海岸に至る道路 (玉長公路) に接続するため,断 層を超えた後,BM119で国道 9 号線に入り断層とほぼ 平行方向に約5km北上しており,路線がクランク状に なっている。本研究では,玉里路線の地殻変動を断層直 行方向に投影し,2 次元モデルで議論を試みている。し かし,5kmという短距離で断層の走向方向に滑り量の 変化があった場合,投影することは危険である。した がって,玉里路線が断層を超えた後,できるだけ断層に 直行する方向に路線を延長することとした。東里と玉里 路線の結果を比較し,両者がほぼ等しい変動を示すこと を確認することが目的である。 富里路線・赤科山路線は,非地震性滑りの断層走向方 向の変化を議論することを目的に設置された (Fig.2b)。 地質構造に注目すると,台東縦谷断層と前述のリッチメ ランジェが接している領域は,玉里路線周辺から南であ る (陳・王,1996)。リッチメランジェの分布域は,ク リープの確認されている領域に,重なるように分布して いる。ここではリッチメランジェの分布が中部~南部で の断層クリープに影響を与えていると仮説を立て,リッ チメランジェの分布域に位置する富里路線,地表にリッ チメランジェは確認されていない赤科山路線を設置し, リッチメランジェの有無による地殻変動の比較を試み た。富里路線は,153点の水準点で構成され,路線長は 約6km。2010年に設置され,2010年 8月,2011年 8月 の2回測定がなされた。赤科山路線は,151点の水準点 で 構 成 さ れ, 路 線 長 は 約5km。2010年に設置され,benchm
ark Lat (°) Lon (°) distance(km)
2009 2010 2011 height between adjoining benchmarks (m) height referred to BM 90 (m) height between adjoining benchmarks (m) height referred to BM 90 (m) height between adjoining benchmarks (m) height referred to BM 101 (m) 90 23.29624 121.27620 0.000 0.00000 0.00000 92 23.29667 121.27807 0.200 -2.28924 -2.28924 -2.28904 -2.28904 B0007L 23.29283 121.27743 0.629 10.15967 7.87044 10.15849 7.86945 R07 23.2903 121.27850 0.931 0.59878 8.46921 0.60182 8.47127 93 23.29007 121.28010 1.099 5.22596 13.69518 5.22574 13.69701 94 23.28839 121.28225 1.384 -10.00280 3.69238 -10.00418 3.69283 95 23.28656 121.28502 1.734 -5.61163 -1.91925 -5.61144 -1.91861 96 23.28421 121.28713 2.103 -3.57276 -5.49201 -3.57478 -5.49338 97 23.28129 121.28720 2.428 -4.19686 -9.68887 -4.19765 -9.69104 98 23.27782 121.28535 2.858 -3.16223 -12.85110 -3.16147 -12.85251 99 23.27622 121.28754 3.182 -3.19071 -16.04181 -3.19242 -16.04493 101 23.2737 121.28462 3.566 -2.17510 -18.21691 -2.17415 -18.21908 0.00000 102 23.27263 121.28567 3.675 -1.63089 -19.84780 -1.63059 -19.84966 -1.63081 -1.63081 103 23.27222 121.28647 3.770 -0.76884 -20.61664 -0.77068 -20.62035 -0.77193 -2.40274 104 23.27178 121.28730 3.866 -0.11466 -20.73129 -0.11323 -20.73357 -0.11281 -2.51556 BG097 23.27102 121.28875 4.045 5.72811 -15.00318 5.72776 -15.00582 5.72689 3.21134 GF22 23.26902 121.29245 4.478 -0.08967 -20.82096 -0.09245 -20.82602 -0.09226 3.11908 105 23.26833 121.29360 4.623 -3.99442 -24.72571 -3.99170 -24.72527 -3.99034 -0.87126 106 23.26982 121.29385 4.794 -2.16220 -26.88791 -2.16224 -26.88751 -2.16239 -3.03365 107 23.27077 121.29465 4.930 -3.02403 -29.91194 -3.02331 -29.91083 -3.02335 -6.05700 108 23.27142 121.29517 5.023 -0.50247 -30.41441 -0.50225 -30.41308 -0.50228 -6.55927 109 23.272 121.29580 5.115 -0.41843 -30.83284 -0.41840 -30.83148 -0.41846 -6.97773 110 23.27262 121.29660 5.221 -0.30099 -31.13383 -0.30058 -31.13207 -0.29991 -7.27764 111 23.27303 121.29747 5.321 -0.28304 -31.41688 -0.28268 -31.41475 -0.28230 -7.55994 112 23.27303 121.29843 5.423 -0.70333 -32.12021 -0.70286 -32.11761 -0.70203 -8.26198 113 23.27275 121.29962 5.544 -0.36475 -32.48496 -0.36365 -32.48126 -0.36316 -8.62513 114 23.2725 121.30068 5.663 -0.37354 -32.85849 -0.37287 -32.85413 -0.37165 -8.99678 115 23.27227 121.30158 5.760 -0.25621 -33.11471 -0.25517 -33.10931 -0.25450 -9.25128 116 23.27203 121.30275 5.880 -0.53992 -33.65463 -0.53895 -33.64826 -0.53767 -9.78895 117 23.2712 121.30432 6.093 1.13740 -32.51723 1.14958 -32.49868 1.16287 -8.62608 118 23.27017 121.30535 6.243 2.56395 -29.95328 2.57066 -29.92802 2.57587 -6.05021 119 23.26927 121.30605 6.366 2.61728 -27.33600 2.61836 -27.30965 2.61841 -3.43180 120 23.26975 121.30703 6.484 -0.54236 -27.87836 -0.54143 -27.85108 -0.54002 -3.97182 121 23.27055 121.30830 6.640 -1.03738 -28.91574 -1.03694 -28.88802 -1.03674 -5.00857 122 23.2711 121.30930 6.761 -1.14803 -30.06377 -1.15291 -30.04093 -1.15284 -6.16141 123 23.27167 121.31027 6.883 0.18785 -29.87592 0.18990 -29.85103 0.19041 -5.97100 124 23.27217 121.31127 7.002 -0.90014 -30.77606 -0.90276 -30.75379 -0.90545 -6.87645 125 23.2728 121.31233 7.132 0.49359 -30.28248 0.49576 -30.25803 0.49883 -6.37762 126 23.27365 121.31338 7.278 0.41319 -29.86929 0.40981 -29.84822 0.40590 -5.97172 127 23.27462 121.31480 7.460 -3.17920 -33.04849 -3.17751 -33.02573 -3.17680 -9.14851 128 23.27547 121.31605 7.618 -0.85693 -33.90541 -0.85652 -33.88226 -0.85613 -10.00464 129 23.27613 121.31698 7.738 -0.51913 -34.42454 -0.51913 -34.40139 -0.51947 -10.52412 130 23.27678 121.31795 7.859 0.04003 -34.38451 0.04096 -34.36043 0.04177 -10.48235 131 23.2772 121.31858 7.966 0.67152 -33.71299 0.67149 -33.68894 0.67171 -9.81064 132 23.2777 121.31960 8.060 -0.42872 -34.14171 -0.43006 -34.11899 -0.42965 -10.24029 133 23.27857 121.32115 8.247 -0.55481 -34.69653 -0.55369 -34.67268 -0.55410 -10.79438 134 23.2798 121.32248 8.440 -2.99093 -37.68746 -2.98937 -37.66205 -2.98884 -13.78322 135 23.28123 121.32370 8.644 -0.67347 -38.36093 -0.67341 -38.33546 -0.67325 -14.45647 136 23.28287 121.32442 8.835 -2.18368 -40.54460 -2.18352 -40.51898 -2.18408 -16.64055 137 23.28405 121.32510 8.986 -0.26165 -40.80626 -0.26105 -40.78003 -0.26051 -16.90106 138 23.28462 121.32562 9.073 0.28406 -40.52220 0.28429 -40.49574 0.28432 -16.61674 139 23.28578 121.32648 9.233 -1.74656 -42.26876 -1.74939 -42.24513 -1.75062 -18.36736 140 23.28703 121.32722 9.390 -0.06917 -42.33793 -0.06589 -42.31101 -0.06460 -18.43197
benchm
ark Lat (°) Lon (°) distance(km)
2009 2010 2011 height between adjoining benchmarks (m) height referred to BM 90 (m) height between adjoining benchmarks (m) height referred to BM 90 (m) height between adjoining benchmarks (m) height referred to BM 101 (m) 141 23.2884 121.32815 9.569 1.08343 -41.25450 1.08381 -41.22720 1.08400 -17.34797 142 23.28955 121.32917 9.739 1.48290 -39.77160 1.48231 -39.74489 1.48202 -15.86595 143 23.29077 121.33053 9.931 -3.14081 -42.91240 -3.14077 -42.88565 -3.14005 -19.00600 144 23.29203 121.33165 10.120 -0.98919 -43.90160 -0.98938 -43.87504 -0.99022 -19.99622 145 23.29322 121.33267 10.308 -0.41522 -44.31682 -0.41496 -44.29000 -0.41477 -20.41099 146 23.29533 121.33333 10.548 0.47799 -43.83883 0.47843 -43.81157 0.47826 -19.93273 147 23.29663 121.33343 10.694 2.43863 -41.40020 2.43807 -41.37349 2.43766 -17.49507 148 23.29742 121.33348 10.779 -0.35697 -41.75717 -0.35773 -41.73123 -0.35757 -17.85264 148-1 23.29423 121.33443 11.161 8.84588 -32.91129 8.84407 -32.88716 8.84171 -9.01093 148-2 23.29228 121.33468 11.384 4.53841 -28.37288 4.54209 -28.34506 4.54517 -4.46575 149 23.29125 121.33488 11.511 2.27763 -26.09525 2.27750 -26.06757 2.27766 -2.18810 150 23.29064 121.33581 11.629 2.44981 -23.64544 2.45018 -23.61738 2.44984 0.26174 151 23.2906 121.33695 11.748 2.14691 -21.49853 2.14737 -21.47002 2.14773 2.40948 152 23.28987 121.33820 11.936 2.32987 -19.16866 2.32139 -19.14863 2.31578 4.72526 153 23.28892 121.33858 12.059 2.69937 -16.46929 2.70677 -16.44186 2.71157 7.43683 154 23.28826 121.33929 12.158 1.30931 -15.15998 1.30882 -15.13304 1.30734 8.74417 155 23.28763 121.33995 12.262 1.46044 -13.69954 1.46132 -13.67172 1.46236 10.20653 156 23.28682 121.34020 12.368 1.30593 -12.39361 1.30534 -12.36638 1.30477 11.51130 157 23.28564 121.34033 12.496 0.16039 -12.23322 0.16147 -12.20490 0.16229 11.67359 158 23.28439 121.34038 12.639 -1.07712 -13.31034 -1.07930 -13.28420 -1.08050 10.59309 159 23.28341 121.34027 12.755 1.86770 -11.44264 1.86186 -11.42234 160 23.28161 121.34055 12.966 2.18646 -9.25618 2.19069 -9.23165 4.05129 14.64439 161 23.28061 121.34161 13.122 -0.07988 -9.33606 -0.07940 -9.31105 -0.07962 14.56477 162 23.2806 121.34324 13.321 6.26394 -3.07213 6.26456 -3.04648 6.26532 20.83008 163 23.28096 121.34440 13.463 3.87566 0.80353 3.87451 0.82802 3.87380 24.70388 164 23.28018 121.34633 13.822 12.79429 13.59782 12.79445 13.62247 12.79482 37.49870 165 23.27911 121.34742 14.036 4.06913 17.66696 4.06675 17.68922 4.06540 41.56410 165-1 23.27754 121.34934 14.302 16.82380 34.49076 16.82436 34.51358 16.82507 58.38917 166 23.27686 121.34976 14.387 5.81954 40.31031 5.81936 40.33294 5.81816 64.20732 166-1 23.27677 121.34995 14.412 0.61357 40.92388 0.61429 40.94723 0.61490 64.82222 167 23.27482 121.35208 14.743 18.82432 59.74820 18.82535 59.77258 168 23.27354 121.35158 15.228 28.71382 88.46202 28.71409 88.48667 169 23.27028 121.35164 15.587 18.53148 106.99350 18.53054 107.01721 170 23.26791 121.35090 15.873 14.15728 121.15078 14.15832 121.17553 171 23.26801 121.34827 16.433 30.02396 151.17474 30.02540 151.20093 172 23.26568 121.35001 16.754 19.34551 170.52025 19.34672 170.54765 173 23.26613 121.35353 17.128 23.91890 194.43915 23.91454 194.46219 174 23.26647 121.35681 17.505 9.48706 203.92620 9.48764 203.94983 175 23.26815 121.36027 17.907 7.37538 211.30159 7.37461 211.32445 176 23.26766 121.36317 18.253 1.83599 213.13758 1.83527 213.15972 177 23.26717 121.36608 18.566 1.48960 214.62718 1.48841 214.64813 178 23.26668 121.36898 18.883 1.18107 215.80825 1.18063 215.82876 179 23.26619 121.37188 19.217 -6.03680 209.77145 -6.03778 209.79098 180 23.2656 121.37479 19.544 -6.19086 203.58059 -6.19136 203.59962 181 23.2652 121.37769 19.851 -5.98993 197.59066 -5.99032 197.60929 182 23.26471 121.38059 20.159 -6.06217 191.52849 -6.06303 191.54626 183 23.26422 121.38350 20.478 -5.84266 185.68584 -5.84346 185.70280 184 23.26373 121.38640 20.816 -8.45630 177.22954 -7.89355 177.80924 185 23.2616 121.38606 21.172 -21.06362 156.16592 -21.62480 156.18445 186 23.25907 121.38795 21.696 -23.40111 132.76481 -23.40234 132.78211 187 23.25608 121.38863 22.053 -23.66633 109.09848 -23.66559 109.11652 188 23.2549 121.38561 22.451 -17.91578 91.18270 -17.91480 91.20172 189-1 23.25443 121.38733 22.851 -21.71740 69.46530 -21.71780 69.48391
benchm
ark Lat (°) Lon (°) distance(km)
2009 2010 2011 height between adjoining benchmarks (m) height referred to BM 90 (m) height between adjoining benchmarks (m) height referred to BM 90 (m) height between adjoining benchmarks (m) height referred to BM 101 (m) 189 23.25395 121.38905 23.685 -20.59808 48.86722 -20.59815 48.88576 190 23.25309 121.39171 23.974 -6.10374 42.76348 -6.10348 42.78228 191 23.25279 121.39484 24.316 -21.01595 21.74753 -21.01457 21.76771 191-1 23.25234 121.39685 24.535 -3.71744 18.03009 -3.71782 18.04989 192 23.25168 121.39861 24.737 -15.35073 2.67936 -15.35210 2.69779 193 23.25129 121.40183 25.093 -13.58021 -10.90085 -13.58788 -10.89009 194 23.25177 121.40588 25.562 -29.04103 -39.94189 -29.03823 -39.92831 195 23.2498 121.40882 26.127 -40.07146 -80.01335 -40.07596 -80.00427 195-1 23.2483 121.40883 26.300 -12.41881 -92.43216 -12.41685 -92.42112 196 23.2513 121.41049 26.761 -12.10136 -104.53352 -12.09751 -104.51863 196-1 23.25157 121.41141 26.896 -4.58989 -109.12340 -4.58909 -109.10772 197 23.24944 121.41387 27.265 -29.23000 -138.35340 -29.23048 -138.33820 197-1 23.24764 121.41527 27.524 -20.50119 -158.85459 -20.50127 -158.83946 198 23.24719 121.41719 27.733 -15.45086 -174.30545 -15.45138 -174.29084 199 23.24826 121.41758 27.855 -0.57892 -174.88436 -0.57915 -174.86999 200 23.24904 121.41802 27.960 0.80631 -174.07805 0.80660 -174.06339 台東64 23.24917 121.41850 27.979 0.60629 -173.47176 0.60361 -173.45978
Table 1 (3) Relative elevatations of benchmarks of Yuli route (3)
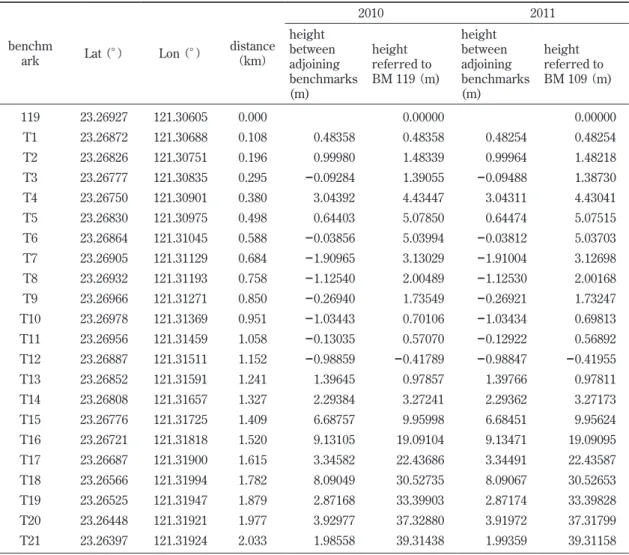
Table 2 Relative elevatations of benchmarks of Dongli route
benchm
ark Lat (°) Lon (°) distance(km)
2010 2011 height between adjoining benchmarks (m) height referred to BM 119 (m) height between adjoining benchmarks (m) height referred to BM 109 (m) 119 23.26927 121.30605 0.000 0.00000 0.00000 T1 23.26872 121.30688 0.108 0.48358 0.48358 0.48254 0.48254 T2 23.26826 121.30751 0.196 0.99980 1.48339 0.99964 1.48218 T3 23.26777 121.30835 0.295 -0.09284 1.39055 -0.09488 1.38730 T4 23.26750 121.30901 0.380 3.04392 4.43447 3.04311 4.43041 T5 23.26830 121.30975 0.498 0.64403 5.07850 0.64474 5.07515 T6 23.26864 121.31045 0.588 -0.03856 5.03994 -0.03812 5.03703 T7 23.26905 121.31129 0.684 -1.90965 3.13029 -1.91004 3.12698 T8 23.26932 121.31193 0.758 -1.12540 2.00489 -1.12530 2.00168 T9 23.26966 121.31271 0.850 -0.26940 1.73549 -0.26921 1.73247 T10 23.26978 121.31369 0.951 -1.03443 0.70106 -1.03434 0.69813 T11 23.26956 121.31459 1.058 -0.13035 0.57070 -0.12922 0.56892 T12 23.26887 121.31511 1.152 -0.98859 -0.41789 -0.98847 -0.41955 T13 23.26852 121.31591 1.241 1.39645 0.97857 1.39766 0.97811 T14 23.26808 121.31657 1.327 2.29384 3.27241 2.29362 3.27173 T15 23.26776 121.31725 1.409 6.68757 9.95998 6.68451 9.95624 T16 23.26721 121.31818 1.520 9.13105 19.09104 9.13471 19.09095 T17 23.26687 121.31900 1.615 3.34582 22.43686 3.34491 22.43587 T18 23.26566 121.31994 1.782 8.09049 30.52735 8.09067 30.52653 T19 23.26525 121.31947 1.879 2.87168 33.39903 2.87174 33.39828 T20 23.26448 121.31921 1.977 3.92977 37.32880 3.91972 37.31799 T21 23.26397 121.31924 2.033 1.98558 39.31438 1.99359 39.31158
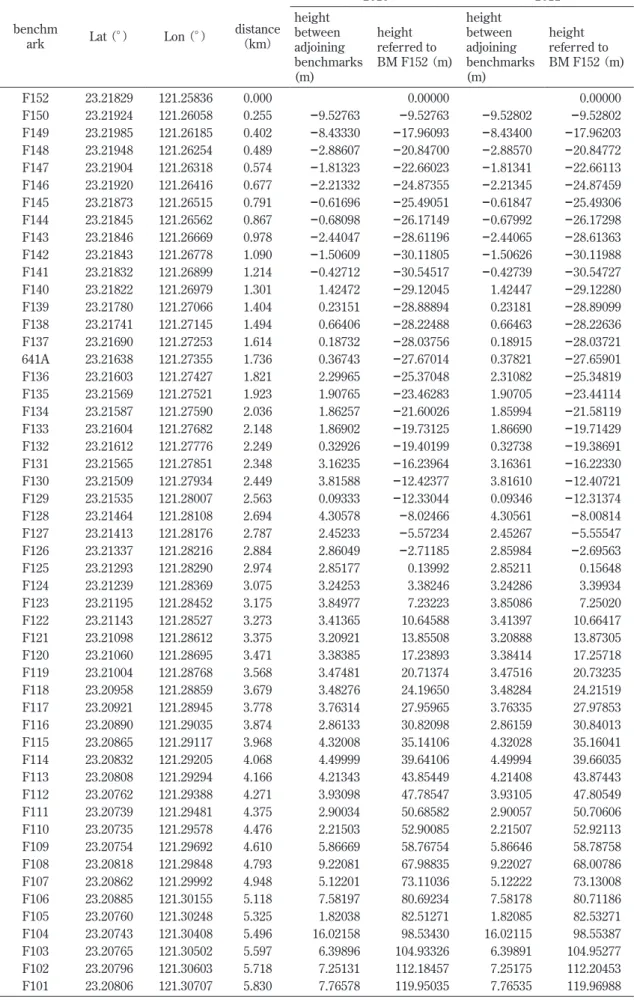
Table 3 Relative elevatations of benchmarks of Fuliroute
benchm
ark Lat (°) Lon (°) distance(km)
2010 2011 height between adjoining benchmarks (m) height referred to BM F152 (m) height between adjoining benchmarks (m) height referred to BM F152 (m) F152 23.21829 121.25836 0.000 0.00000 0.00000 F150 23.21924 121.26058 0.255 -9.52763 -9.52763 -9.52802 -9.52802 F149 23.21985 121.26185 0.402 -8.43330 -17.96093 -8.43400 -17.96203 F148 23.21948 121.26254 0.489 -2.88607 -20.84700 -2.88570 -20.84772 F147 23.21904 121.26318 0.574 -1.81323 -22.66023 -1.81341 -22.66113 F146 23.21920 121.26416 0.677 -2.21332 -24.87355 -2.21345 -24.87459 F145 23.21873 121.26515 0.791 -0.61696 -25.49051 -0.61847 -25.49306 F144 23.21845 121.26562 0.867 -0.68098 -26.17149 -0.67992 -26.17298 F143 23.21846 121.26669 0.978 -2.44047 -28.61196 -2.44065 -28.61363 F142 23.21843 121.26778 1.090 -1.50609 -30.11805 -1.50626 -30.11988 F141 23.21832 121.26899 1.214 -0.42712 -30.54517 -0.42739 -30.54727 F140 23.21822 121.26979 1.301 1.42472 -29.12045 1.42447 -29.12280 F139 23.21780 121.27066 1.404 0.23151 -28.88894 0.23181 -28.89099 F138 23.21741 121.27145 1.494 0.66406 -28.22488 0.66463 -28.22636 F137 23.21690 121.27253 1.614 0.18732 -28.03756 0.18915 -28.03721 641A 23.21638 121.27355 1.736 0.36743 -27.67014 0.37821 -27.65901 F136 23.21603 121.27427 1.821 2.29965 -25.37048 2.31082 -25.34819 F135 23.21569 121.27521 1.923 1.90765 -23.46283 1.90705 -23.44114 F134 23.21587 121.27590 2.036 1.86257 -21.60026 1.85994 -21.58119 F133 23.21604 121.27682 2.148 1.86902 -19.73125 1.86690 -19.71429 F132 23.21612 121.27776 2.249 0.32926 -19.40199 0.32738 -19.38691 F131 23.21565 121.27851 2.348 3.16235 -16.23964 3.16361 -16.22330 F130 23.21509 121.27934 2.449 3.81588 -12.42377 3.81610 -12.40721 F129 23.21535 121.28007 2.563 0.09333 -12.33044 0.09346 -12.31374 F128 23.21464 121.28108 2.694 4.30578 -8.02466 4.30561 -8.00814 F127 23.21413 121.28176 2.787 2.45233 -5.57234 2.45267 -5.55547 F126 23.21337 121.28216 2.884 2.86049 -2.71185 2.85984 -2.69563 F125 23.21293 121.28290 2.974 2.85177 0.13992 2.85211 0.15648 F124 23.21239 121.28369 3.075 3.24253 3.38246 3.24286 3.39934 F123 23.21195 121.28452 3.175 3.84977 7.23223 3.85086 7.25020 F122 23.21143 121.28527 3.273 3.41365 10.64588 3.41397 10.66417 F121 23.21098 121.28612 3.375 3.20921 13.85508 3.20888 13.87305 F120 23.21060 121.28695 3.471 3.38385 17.23893 3.38414 17.25718 F119 23.21004 121.28768 3.568 3.47481 20.71374 3.47516 20.73235 F118 23.20958 121.28859 3.679 3.48276 24.19650 3.48284 24.21519 F117 23.20921 121.28945 3.778 3.76314 27.95965 3.76335 27.97853 F116 23.20890 121.29035 3.874 2.86133 30.82098 2.86159 30.84013 F115 23.20865 121.29117 3.968 4.32008 35.14106 4.32028 35.16041 F114 23.20832 121.29205 4.068 4.49999 39.64106 4.49994 39.66035 F113 23.20808 121.29294 4.166 4.21343 43.85449 4.21408 43.87443 F112 23.20762 121.29388 4.271 3.93098 47.78547 3.93105 47.80549 F111 23.20739 121.29481 4.375 2.90034 50.68582 2.90057 50.70606 F110 23.20735 121.29578 4.476 2.21503 52.90085 2.21507 52.92113 F109 23.20754 121.29692 4.610 5.86669 58.76754 5.86646 58.78758 F108 23.20818 121.29848 4.793 9.22081 67.98835 9.22027 68.00786 F107 23.20862 121.29992 4.948 5.12201 73.11036 5.12222 73.13008 F106 23.20885 121.30155 5.118 7.58197 80.69234 7.58178 80.71186 F105 23.20760 121.30248 5.325 1.82038 82.51271 1.82085 82.53271 F104 23.20743 121.30408 5.496 16.02158 98.53430 16.02115 98.55387 F103 23.20765 121.30502 5.597 6.39896 104.93326 6.39891 104.95277 F102 23.20796 121.30603 5.718 7.25131 112.18457 7.25175 112.20453 F101 23.20806 121.30707 5.830 7.76578 119.95035 7.76535 119.96988
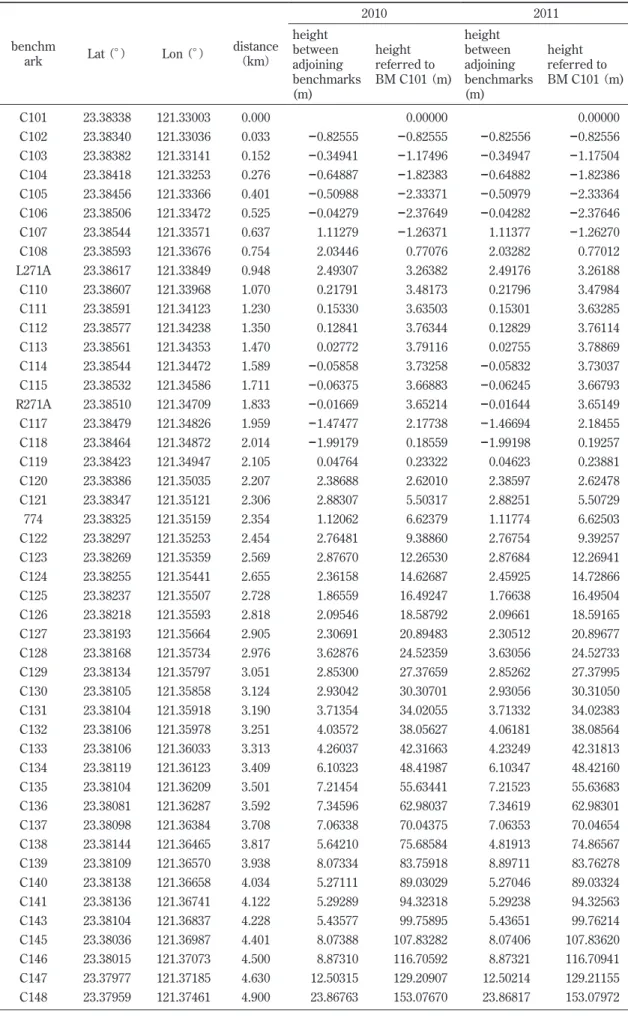
Table 4 Relative elevatations of benchmarks of Chike-shan route
benchm
ark Lat (°) Lon (°) distance(km)
2010 2011 height between adjoining benchmarks (m) height referred to BM C101 (m) height between adjoining benchmarks (m) height referred to BM C101 (m) C101 23.38338 121.33003 0.000 0.00000 0.00000 C102 23.38340 121.33036 0.033 -0.82555 -0.82555 -0.82556 -0.82556 C103 23.38382 121.33141 0.152 -0.34941 -1.17496 -0.34947 -1.17504 C104 23.38418 121.33253 0.276 -0.64887 -1.82383 -0.64882 -1.82386 C105 23.38456 121.33366 0.401 -0.50988 -2.33371 -0.50979 -2.33364 C106 23.38506 121.33472 0.525 -0.04279 -2.37649 -0.04282 -2.37646 C107 23.38544 121.33571 0.637 1.11279 -1.26371 1.11377 -1.26270 C108 23.38593 121.33676 0.754 2.03446 0.77076 2.03282 0.77012 L271A 23.38617 121.33849 0.948 2.49307 3.26382 2.49176 3.26188 C110 23.38607 121.33968 1.070 0.21791 3.48173 0.21796 3.47984 C111 23.38591 121.34123 1.230 0.15330 3.63503 0.15301 3.63285 C112 23.38577 121.34238 1.350 0.12841 3.76344 0.12829 3.76114 C113 23.38561 121.34353 1.470 0.02772 3.79116 0.02755 3.78869 C114 23.38544 121.34472 1.589 -0.05858 3.73258 -0.05832 3.73037 C115 23.38532 121.34586 1.711 -0.06375 3.66883 -0.06245 3.66793 R271A 23.38510 121.34709 1.833 -0.01669 3.65214 -0.01644 3.65149 C117 23.38479 121.34826 1.959 -1.47477 2.17738 -1.46694 2.18455 C118 23.38464 121.34872 2.014 -1.99179 0.18559 -1.99198 0.19257 C119 23.38423 121.34947 2.105 0.04764 0.23322 0.04623 0.23881 C120 23.38386 121.35035 2.207 2.38688 2.62010 2.38597 2.62478 C121 23.38347 121.35121 2.306 2.88307 5.50317 2.88251 5.50729 774 23.38325 121.35159 2.354 1.12062 6.62379 1.11774 6.62503 C122 23.38297 121.35253 2.454 2.76481 9.38860 2.76754 9.39257 C123 23.38269 121.35359 2.569 2.87670 12.26530 2.87684 12.26941 C124 23.38255 121.35441 2.655 2.36158 14.62687 2.45925 14.72866 C125 23.38237 121.35507 2.728 1.86559 16.49247 1.76638 16.49504 C126 23.38218 121.35593 2.818 2.09546 18.58792 2.09661 18.59165 C127 23.38193 121.35664 2.905 2.30691 20.89483 2.30512 20.89677 C128 23.38168 121.35734 2.976 3.62876 24.52359 3.63056 24.52733 C129 23.38134 121.35797 3.051 2.85300 27.37659 2.85262 27.37995 C130 23.38105 121.35858 3.124 2.93042 30.30701 2.93056 30.31050 C131 23.38104 121.35918 3.190 3.71354 34.02055 3.71332 34.02383 C132 23.38106 121.35978 3.251 4.03572 38.05627 4.06181 38.08564 C133 23.38106 121.36033 3.313 4.26037 42.31663 4.23249 42.31813 C134 23.38119 121.36123 3.409 6.10323 48.41987 6.10347 48.42160 C135 23.38104 121.36209 3.501 7.21454 55.63441 7.21523 55.63683 C136 23.38081 121.36287 3.592 7.34596 62.98037 7.34619 62.98301 C137 23.38098 121.36384 3.708 7.06338 70.04375 7.06353 70.04654 C138 23.38144 121.36465 3.817 5.64210 75.68584 4.81913 74.86567 C139 23.38109 121.36570 3.938 8.07334 83.75918 8.89711 83.76278 C140 23.38138 121.36658 4.034 5.27111 89.03029 5.27046 89.03324 C141 23.38136 121.36741 4.122 5.29289 94.32318 5.29238 94.32563 C143 23.38104 121.36837 4.228 5.43577 99.75895 5.43651 99.76214 C145 23.38036 121.36987 4.401 8.07388 107.83282 8.07406 107.83620 C146 23.38015 121.37073 4.500 8.87310 116.70592 8.87321 116.70941 C147 23.37977 121.37185 4.630 12.50315 129.20907 12.50214 129.21155 C148 23.37959 121.37461 4.900 23.86763 153.07670 23.86817 153.07972
cardelaでのケースではβ =0.7であるとしている。ま た,著者(村瀬) が参加している御嶽火山における水準 測量の誤差の検討の結果も,Long Valley cardelaのケー スと同様β =0.7程度と推定される (木股・他,2004)。 それでは本測定における往復誤差と測定距離との関係を Fig.3aに示す。水準点間の往復誤差は±0.5mm以内に ここで,測量誤差σ (h)はmm,β は水準測量の等級, 観測年代などに起因する定数,j は 1 回の測定の場合に 1,往復測量の場合を2とする。Lは水準点間の距離 (km)である(Pelton and Smith, 1982)。Vanicek et al.(1980)
はNational Geodetic Survey と U.S. Geological Survey の 膨 大 な 経 験 か らβ 値を推定し,アメリカ Long Valley
Fig.3 (a) Distribution of closing errors (pluses) of precise leveling between adjoining benchmarks every year. The line is calculated using from the equation (2) assigned β-value to 0.7.
(b) Accumulation of closing errors along the leveling route from east end of the every route. The gray and black lines are calculated using from the equation (2) assigned β-values to 0.4 and 0.7, respectively.
0 0.5 1 1.5 2 2.5 3 0 5 10 15 20 25 30 0 0.5 1 1.5 2 2.5 3 0 5 10 15 20 25 0 0.5 1 1.5 2 0 2 4 6 8 10
2009 August
2010 August
2011 August
-0.6 -0.4 -0.2 0 0.2 0.4 0.6 0 0.1 0.2 0.3 0.4 0.5 -0.6 -0.4 -0.2 0 0.2 0.4 0.6 0 0.2 0.4 0.6 0.8 1 -0.6 -0.4 -0.2 0 0.2 0.4 0.6 0 0.2 0.4 0.6 0.8 1 closong error(mm) closong error(mm)accumulated closing error(mm)
accumulated closing error(mm)
accumulated closing error(mm)
closong error(mm)
distance from reference point(km)
distance from reference point(km) distance from reference point(km) distance between adjoining benchmarks(km)
distance between adjoining benchmarks(km)
distance between adjoining benchmarks(km)
(a) (b)
(a) (b)
いると思われる。温度膨張係数に5.0×10⁻⁷/℃のズレが あり,10度気温差がある条件で,最も高低差のある玉 里路線の再測定をした場合をシミュレーションすると地 殻変動に最大2mmの誤差が生じる可能性がある。 今回の誤差の議論では,大気の温度勾配による視準線 の屈折誤差については補正をおこなわない。測定時の地 表面付近の温度勾配を測定し誤差を見積もることが,よ り信頼度の高い測定のためには必要となる。しかしなが ら,同じ季節に再測量をおこなう場合,前回測定時と似 た温度勾配が再現されている可能性が高く,地殻変動を 議論する場合には大部分がキャンセルされると考えられ る。
台東縦谷断層中部の地殻変動
各路線の地殻変動をFig.4~Fig.6 に示す。断層と地 殻変動との関係が分かりやすいように,断層に直行した 方向(N70°W)に投影して示している。結果の図中に 周囲の地殻変動の傾向とは異なるスパイク状の変化を示 す水準点が見られる。これは,水準点の設置されたコン クリート構造物が安定でなかった場合に見られる変化で あり,非地震性滑りによる地殻変動を反映していないと 考えられるが,本報告では除外せず示している。 玉里路線の地殻変動を示す (Fig.4a, b, c)。玉里路線 では,2008年-2009年,2009年-2010年,2010年-2011年 の3 回上下変動が取得された。水準路線の西端から東端 に向かって上下変動を概観すると,断層を挟む約2km の領域において30mm/yearで断層上板側が急激に隆起 した直後に20mm/yearまで減少し,再び30mm/yearま で増加するというM字型の変化が見られた。その後, 変動は断層から離れるにしたがい減少し,東海岸で 15mm/yearとなる。3 回の測定を比較してみると,変動 量や変動パターンが非常によく似ている事がわかる。こ れは,地下の断層の非地震性滑りを発生させている領域 の場所・滑り量が共に変化せず安定して継続している事 を示唆する。 次に東里路線の変動について検討する(Fig.4c)。玉 里路線において,断層近傍でM字型の変動を示した事 を述べた。このM字を示す水準点は,断層に沿って北 上するような配置となっている。つまり,断層の平行方 向に存在する上下変動の空間変化によって,M字型に なってしまった可能性がある。この可能性を検討するた めに,断層から直行方向にできるだけ路線を延長したの が東里路線である。その結果は,玉里路線と同様のM 字型を示した。この結果から,断層の走行方向の非地震 性滑りの空間変化によるものではない事が示唆された。 収まっている。上述の (2) 式をβ =0.7とした場合の曲 線もFig.3 中に示すが,ほとんどの測定結果は曲線の内 側にプロットされる。Fig.3bでは,各路線の最西端を基 準とした各観測点の比高の誤差を検討した。上述の (2) 式をβ =0.7とした場合の曲線を黒線で示す。本測量結 果はβ =0.7とした場合の曲線より,後述の一例を除き 十分小さな値をとる。村瀬・他 (2009) では,2008年 8 月に測定された水準測量データでβ を求めると,β =0.4 になることを示した。Fig.3b中にβ =0.4の曲線を灰色 で示す。2009-2011の測定結果もβ =0.4の曲線付近に位 置しており,過去の水準測量を用いた研究結果と比較し て精度の高い地殻変動データが取得できたと考える。例 外として,赤科山路線の2010年の測量結果が多路線の 結果と比較して,測量誤差が大きくβ =0.7とした場合 の曲線付近に位置する (Fig.3bの2010年測量結果)。こ の路線の相対的に大きな往復誤差の理由として,路線に 約1kmの橋が存在する事が挙げられる。交通量が多い ときには橋が振動するため正確な測定が難しい。2011 年の測定時は,交通量の少ない時間帯を選んで測定する 事で誤差の軽減に成功した。 路線毎の往復誤差に注目すると,プラスとマイナスに 均等に分布しておらす,プラスの誤差が多い (Fig.3a)。 水準測量中に時間の経過とともに標尺の台座や三脚が沈 下をした場合,プラスの往復誤差として現れるためであ る。これは,測定時間が多くかかる長い路線で影響が出 やすい。台座・三脚の沈下防止のために設置時には最新 の注意を払っており,その結果,プラスの往復誤差が幾 分多くみられるとはいえ,往復差は十分小さく抑えられ ている。 系統誤差の最も大きな要因と考えられる標尺の熱膨張 によるスケール誤差について検討する。標尺の熱膨張に よって,メモリのズレが引き起こされる。標尺に使用さ れるインバール材は温度膨張が少なく,温度変化による 測定誤差を減らすことが可能である。さらに本研究では 観測時の気温から標尺の温度膨張補正を試みた。日本で 使われる精密水準測量用の標尺は1本ずつ熱膨張係数が 検定されているので膨張係数を知ることは容易である が,本研究で用いた標尺は検定をおこなっていない物で あった。Leica社製インバールバーコード標尺GPCL3 の 公証の線膨張係数は1.0×10⁻⁶/℃以下である。したがっ て線膨張係数1.0×10⁻⁶/℃を使用し,観測時の気温から 標尺の温度膨張補正を行った。Murase et al. (2007) は, 台湾七星山の春と夏に行われた水準測量データを上記方 法で温度補正をすることにより地殻変動中に現れる年周 変化が軽減したことを報告しており温度補正は機能して非地震性滑りに影響を与えている可能性が示唆される。 それぞれの路線の地殻変動から地下の断層モデルの推定 をすることで,地下での滑り領域の違いを明らかにし, リッチメランジェの有無が,赤科山路線と他路線で見ら れた上下変動の違いを生じさせた原因に成りうるのか, 今後検討したい。
まとめ
台東縦谷断層の中央部において複数(玉里路線,東里 路線,富里路線,赤科山路線)を設置し断層中央部の断 層クリープに伴う上下変動を検出した。 玉里路線においては,2008年より 3 年間にわたる上下 変動を得ることができた。その変動速度やパターンは毎 年ほぼ等しく,非地震性滑りのおこっている場所や滑り 量が時間的に変化せず安定していることが示唆された。 M字型の変動を作り出す原因としては,断層の深さ方 向の滑り量の変化や断層形状などが考えられ,今後断層 モデルの推定から詳細に検討したいと考える。 富里路線では,断層を挟む約500mの領域において 25mm/yearの変動が検出された (Fig.5a)。その後,隆 起速度は17mm/yearまで減少し,その後わずかに上昇 し一定になる。富里断層の上下変動は,玉里断層のもの に変動量,パターン共によく似ている。 最後に赤科山路線の上下変動を検討する (Fig.6a)。 赤科山路線では断層を挟む約500mの領域で10mm/year の隆起が検出され,その後500mほどで 5mm/yearに減 少し一定になる。赤科山路線は,上述の玉里路線・富里 路線と比較し,隆起速度が半分以下に減少し,パターン も異なる。赤科山路線は,他の路線と異なり,リッチメ ランジェが存在しない場所であり,リッチメランジェがDeformation(2008-2009)
Deformation(2009-2010)
Deformation(2010-2011)
Relative elevation referred to BM 90
elevation(m)
linear distance along the fault perpendicular direction(km)
(a)
(b)
(c)
(d)
linear distance along the fault perpendicular direction(km)
linear distance along the fault perpendicular direction(km) linear distance along the fault perpendicular direction(km)
vertical deformaion(m) vertical deformaion(m) vertical deformaion(m) -200 -150 -100 -50 0 50 100 150 200 250 0 2 4 6 8 10 12 14 16 -0.010 -0.005 0.000 0.005 0.010 0.015 0.020 0.025 0.030 0 2 4 6 8 10 12 14 16 -0.010 -0.005 0.000 0.005 0.010 0.015 0.020 0.025 0.030 0 2 4 6 8 10 12 14 16 -0.010 -0.005 0.000 0.005 0.010 0.015 0.020 0.025 0.030 0 2 4 6 8 10 12 14 16
Fig.4 (a) Vertical deformation of the Yuli route measured between 2008 and 2009. Reference point is BM 90(east end of the Yuli route). Error bars denote the accumulated closing errors from BM 90. (b) Vertical deformation of the Yuli route measured between 2009 and 2010. (c) Vertical deformation of the Yuli route and the Dongli route. Black and Gray lines denote the vertical deformation of the Yuli and Dongli routes, respectively. (d) Relative elevation referred to BM 90. Black and Gray lines denote the relative elevation of the Yuli and Dongli routes, respectively.
謝辞
本稿を査読いただき,有益なご意見をくださった吉井敏尅 教授に深く感謝いたします。また,本調査を進めるにあた り,中央研究院地球科学研究所のスタッフには多大なるご協 力を賜りました(We would like to thank the staff of Institute of Earth Sciences, Academia Sinica for their support of our survey)。ここに記して感謝いたします。 富里路線,赤科山路線を追加することで,断層クリー プ現象の空間分布を測定した。富里路線・玉里路線で は,似た変動速度やパターンの上下変動が検出されたの に対し,赤科山路線では変動速度が半分以下に減少し, 変動パターンも異なるようである。赤科山路線は,南部 ~中部地域の断層沿いに広く分布するリッチメランジェ が見られなくなる場所である。リッチメランジェがク リープ現象に影響を与えている可能性が示唆されたが, 今後詳細に検討していくべき課題である。 -40 -20 0 20 40 60 80 100 120 140 0 1 2 3 4 5 -0.005 0.000 0.005 0.010 0.015 0.020 0.025 0 1 2 3 4 5 Deformation(2010-2011) (a)
Relative elevation referred to BM F152 (b)
elevation(m)
linear distance along the fault perpendicular direction(km) linear distance along the fault perpendicular direction(km)
vertical deformaion(m)
Deformation(2010-2011) (a)
Relative elevation referred to BM C101 (b)
elevation(m)
linear distance along the fault perpendicular direction(km) linear distance along the fault perpendicular direction(km)
vertical deformaion(m) -20 0 20 40 60 80 100 120 140 160 180 0 1 2 3 4 5 -0.010 -0.005 0.000 0.005 0.010 0.015 0.020 0 1 2 3 4 5
Fig.5 (a) Vertical deformation of the Fuli route measured between 2010 and 2011. Reference point is BM F152(east end of the Fuli route). Error bars denote the accumulated closing errors from BM F152. (b) Relative elevation of the Fuli route referred to BM F152.
Fig.6 (a) Ver tical deformation of the Chike-shan route measured between 2010 and 2011. Reference point is BM C101 (east end of the Fuli route). Error bars denote the accumulated closing errors from BM C101. (b) Relative elevation of the Chike-shan route referred to BM C101.
Biq, C. (1973). Kinematic pattern of Taiwan as an example of actual continental-arc collision, Rep. Seminar on Seismolo-gy, US-ROC Cooperative Science Program, 21-26.
Bowin, C., R. S. Lu, C. S. Lee, and H. Schouten (1978). Plate convergence and accretion in Taiwan-Luzon region, Am. Assoc. Petrol. Geol. Bull., 62, 1645-1672.
Chai, B. H. T. (1972). Structure and tectonic evolution of Tai-wan, Am. J. Sci., 272, 389-422.
Chang, C. P., J. Angelier, C. Y. Huang, and C. S. Liu (2001), Structural evolution and significance of a me′lange in a
collision belt: The Lichi Me′lange and the Taiwan
arc-con-tinent collision, Geol. Mag., 138, 633-651.
Chen, W.-S. (1988), Tectonic evolution of sedimentary basins in Coastal Range, Taiwan (in Chinese), Ph.D. thesis, 304 pp., Natl. Taiwan Univ., Taipei.
陳文山・王源(1996): 台湾東部海岸山脈地質.10万分 1 地
質図,中央地質調査所.
Chen Wen-Shan, I-Chin Yen , Keegan P. Fengler, Charles M. Rubin, Chi-Cheng Yang, Hsiao-Chin Yang , Hui-Cheng Chang , Chii-Wen Lin, Wei-Hsiung Lin, Chiu Liu, Yen-Hui Lin (2007), Paleoseismology of the Rueisuei Segment of the Longitudinal Valley Fault, Eastern, EPSL, 264, 420-437.
Ho, C. S. (1986), A synthesis of the geologic evolution of Taiwan, Tectonophysics, 125, 1-16
Ho, C. S. (1988), An Introduction to the Geology of Taiwan, Ex-planatory Text of the Geologic Map of Taiwan, 2nd ed., 192 pp., Cent. Geol. Surv., Minist. of Econ. Affairs, Taipei, Taiwan.
Hsu, T. L. (1962). Recent faulting in the Longitudinal Valley of eastern Taiwan, Mem. Geol. Soc. China, 1, 95-102.
木股文昭,村瀬雅之,宮島力雄,Dudy Darmawan,伊藤武
男,高野和友,太田雄策,Irwan Meirano, Herri Anderson, David Solim, Fauzan Ibrahim,小山悦郎,辻 浩,高山鐵
郎,内田和也,岡田 純(2004),御嶽山群発地震域に
おいて精密水準測量から検出された地盤の隆起変動 2002年 4月-2004年 4月, 東濃地震科学研究所報告書 14, 7-18.
Kimata, F., R. Miyajima, M. Murase, D. Darwaman, T. Ito, Y. Ohta, M. Irwan, K. Takano, F. Ibrahim, E. Koyama, H. Tsuji, T. Takayama, K. Uchida, J. Okada, D. Solim, and H. Anderson, (2004), Ground uplift detected by precise level-ing in the Ontake earthquake swarm area, central Japan in 2002-2004, Earth Planets Space, 56, e45-e48.
Lay, T. and H. Kanamori (1980), Earthquake doublets in the Solomon Island, Phys. Earth Planet Int., 21, 283-304. Lay, T. and H. Kanamori (1981), An asperity model of large
earthquake sequences, in D. W. Simpson and P. G. Rich-ards (eds.), “Earthquake Prediction, an International Review”, Maurice Ewing Series, IV, 579-592, AGU, Wash-ington, D. C..
引用文献
Lee, Jian-Cheng, Jacques Angelier, Hao-Tsu Chu, Jyr-Ching Hu, Fu-Shu Jeng, and Ruey-Juin Rau (2003), Active fault creep variations at Chihshang, Taiwan, revealed by creep meter monitoring, 1998-2001, JJournal of Geophysical Researc, 108, NO. B11, 2528, doi:10. 1029/2003JB002394. Murase. M., K. Ishikawa, C. H. Lin1, J. J. Lin1, H. C. Pu2, F.
Kimata, R. Miyajima, H. Nakamichi and A. Suzuki (2007), Estimated pressure source and vertical deformation in Ta-tun volcano group, Taiwan, detected by precise leveling in June 2006-August 2007, abstracts of Sixth Taiwan-Japan International Workshop on Hydrological and Geochemical Research for Earthquake Prediction.
村瀬雅之,松多信尚,Jui-Jen Lin,Hsin-Chieh Pu,Wen-Shan Chen,Cheng-Hong Lin (2009),台湾玉里断層における
稠密水準測量調査 ,日本大学文理学部自然科学研究所
研究紀要,44,159-166.
Ohta, Y., F. Kimata, and T. Sagiya (2004), Reexamiation of the interplate coupling in the Tokai region, central Japan, based on the GPS data in 1997-2002, Geophys. Res. Lett., 31, L24604, doi:10.1029/2004GL021404.
Pelton, J. R. and R. B. Smith (1982), Contemporary vertical surface displacements in Yellowstone National Park, J. Geophys. Res., 87, 2745-2761.
Shyu, J. B. H., L. H. Chung, Y. G. Chen, J. C. Lee, and K. Sieh (2007), Reevaluation of the surface ruptures of the No-vember 1951 earthquake series in eastern Taiwan, and its neotectonic implications, J. Asian Earth Sci. 31, 317-331. Shyu, J. B. H., K. Sieh, Y. G. Chen, and C. S. Liu (2005).
Neo-tectonic architecture of Taiwan and its implications for fu-ture large earthquake, J. Geophys. Res. 110, B08402, doi 10.1029/2005JB003251.
Teng, L. S. (1996), Extensional collapse of the northern Taiwan mountain belt, Geology, 24, 945-952.
Yen, IC, Wen-Shan Chen, Chih-Cheng Barry Yang, and Neng-Wei Huang (2008), Paleoseismology of the Rueisuei Seg-ment of the Longitudinal Valley Fault, Eastern Taiwan, Bulletin of the Seismological Society of America, 90, 1737-1749.
Vanicek, P., Castle, R.O., Balazs, E.I. (1980), Geodetic leveling and its applications. Rev. Geophys. 18, 505-524.
Yu, Shui-Beih, Horng-Yue Chen, Long-Chen Kuo (1997), Veloc-ity field of GPS stations in the Taiwan area, Tectonophys-ics, 274, 41-59.
Yu, S. B., and L. C. Kuo (2001), Present-day crustal motion along the Longitudinal Valley Fault, eastern Taiwan, Tec-tonophysics, 333, 199-217.
Wu, Y. M., C. H. Chang, L. Zhao, J. B. H. Shyu, Y. G. Chen, K. Sieh, and J. P. Avouac (2007), Seismic tomography of Tai-wan: Improved constraints from a dense network of strong motion stations, J. Geophys. Res., 112, B08312, doi:10. 1029/2007JB004983.