Action Mechanisms of Arsenic Compounds in Leukemia Cells
XiaoMei Hu
2
TABLE OF CONTENTS
INTRODUCTION••••••••••••••••••••••••••••••••••••••••••••••••••••••••••••••••••••••••• 6 Chapter 1. Arsenic trioxide (As2O3) induces apoptosis equally in T
lymphoblastoid leukemia MOLT-4 cells and P-gp-expressing
daunorubicin-resistant MOLT-4 cells
1.1 INTRODUCTION··· 9
1.2 MATERIALS AND METHODS ···9
1.2.1 Reagents ···9
1.2.2 Cell culture ···9
1.2.3 MTT assay ···10
1.2.4 Cell viability assay ··· 10
1.2.5 Morphological changes ···10 1.2.6 P-gp expression analysis ···10 1.2.7 P-gp efflux function ··· ··· 11 1.2.8 Apoptosis assays ··· ···11 1.2.9 Statistics··· ···11 1.3 RESULTS ··· ··· 11
1.3.1 Effects of As2O3 on parental MOLT-4 and resistant MOLT-4/ DNR cell growth ··· ···11
1.3.2 Additive effect of As2O3 with DNR on MOLT-4/DNR cell growth··· 12
1.3.3 As2O3 did not change the P-gp expression and function of MOLT-4/ DNR cells ··· ···13
1.3.4 As2O3 induces apoptosis in cells of both the MOLT-4 and MOLT-4/DNR cell line ··· ··· 15
1.4 DISCUSSION··· ··· 16
1.5 CONCLUSION ··· ···18
Chapter 2. Arsenic trioxide (As2O3) induces apoptosis in cells of MOLT-4 and its daunorubicin-resistant cell line via depletion of intracellular glutathione, disruption of mitochondrial membrane potential and activation of caspase-3 2.1 INTRODUCTION··· · ···19
2.2 MATERIALS AND METHODS ··· ···19
2.2.1 Reagents··· ··· 19 2.2.2 Cell culture ··· ··· 19 2.2.3 MTT assay ··· ···19 2.2.4 Viability of cells ··· ··· ···19 2.2.5 Measurement of intracellular GSH ··· ···20 2.2.6 Evaluation of MMP ··· ···20
2.2.7 Assessment of caspase-3 activity ··· ···20
2.2.8 Apoptosis assays ··· ···21
2.2.9 Morphological changes of cells··· ··· 21
2.2.10 Statistics··· ···21
2.3.1 Effects of BSO, AA, or NAC on the growth-inhibitory action of As2O3
in MOLT-4 and MOLT-4/DNR cells ··· ··· 21
2.3.2 Intracellular GSH content modulated by BSO, AA, or NAC in MOLT-4 and MOLT-4/DNR cells··· ··· 23
2.3.3 Disruption of MMP in MOLT-4 and MOLT-4/DNR cells··· 24
2.3.4 Activation of caspase-3 in MOLT-4 and MOLT-4/DNR cells··· ···25
2.3.5 Modulation of As2O3-induced apoptosis by AA, BSO, or NAC in MOLT-4 and MOLT-4/DNR cells ··· ···26
2.4 DISCUSSION ··· ···28
2.5 CONCLUSION··· ···30
Chapter 3. Involvement of oxidative stress associated with glutathione depletion and p38 MAPK activation in arsenic disulfide-induced (As2S2) differentiation in HL-60 cells 3.1 INTRODUCTION··· ··· 31
3.2 MATERIALS AND METHODS ··· ···31
3.2.1Reagents··· ··· 31
3.2.2 Cell culture ··· ··· 31
3.2.3 MTT assay··· ··· 32
3.2.4Assessment of Differentiation··· ··· 32
3.2.5 Apoptosis and viability assays ··· ···33
3.2.6 Cellular ROS production measurement··· ··· 33
3.2.7 Determination of level of cellular GSH··· ··· ·33
3.2.8 Analysis for p38 MAPK activation··· ··· 33
3.2.9 Western Blot Analysis··· ···34
3.2.10 Determination of MMP··· ····34
3.2.11 Statistics··· ···35
3.3 RESULTS··· ··· 34
3.3.1Effects of As2S2 on cell growth and Differentiation··· ··· 34
3.3.2 Apoptosis and viability of cells induced by As2S2··· ···36
3.3.3 Involvement of oxidative stress in the As2S2-induced cell differentiation··· ··· 38
3.3.4 Cellular GSH level··· ··· 40
3.3.5 Activation of p38 MAPK ··· ···41
3.3.6 Depletion of MMP··· ··· 42
3.3.7 Effects of inhibition of activation of p38 MAPK on As2S2- induced differentiation ··· ··· 43
3.4 DISCUSSION ··· ···44
3.5 CONCLUSION ··· ···46
4
4.2 MATERIALS AND METHODS··· ··· 47
4.2.1 Reagents··· ···47
4.2.2 Cells and cell culture··· ··· 48
4.2.3 MTT assay··· ··· 48
4.2.4 Apoptosis and viability assays··· ··· 48
4.2.5 Assessment of erythroid differentiation··· ···48
4.2.6 Statistical analysis··· ···48
4.3 RESULTS··· ···48
4.3.1 Cell proliferation inhibited by As2S2··· ··· 48
4.3.2 Apoptotic cells induced by As2S2··· ···49
4.3.3 Cell viability after treatment with As2S2···49
4.3.4 Erythroid differentiation of cells induced by As2S2··· ··· 50
4.4 DISCUSSION··· ··· 50
4.5 CONCLUSION ··· ···52
GENERAL DISCUSSION AND CONCLUSIONS···53
ACKNOWLEDGMENTS ··· ···54
REFERENCES··· ···55
ABBREVIATIONS
AA ascorbic acid
AML acute myeloid leukaemia APL acute promyelocytic leukemia As2O3 arsenic trioxide
As2S2 arsenic disulfide
BSO L-buthionine-[S,R]-sulfoxide DCFH-DA 2’,7’-dichlorofluorescein diacetate DNR daunorubicin
FBS fetal bovine serum GSH glutathione
H2O2 hydrogen peroxide
MFI mean fluorescence intensity MAPKs mitogen activated protein kinases MMP mitochondrial membrane potential MDR multidrug resistance MDS myelodysplastic syndromes NAC N-acetylcysteine NBT nitroblue tetrazolium P-gp P-glycoprotein PBS phosphate-buffered saline PI propidium iodide QHP Qinghuang Powder
ROS reactive oxygen species
R- PE r-phycoerythrin
Rh123 rhodamine 123
SD standard deviation
6
INTRODUCTION
Arsenic is a natural substance that has been used medicinally for over 2400 years [130]. In 1878, potassium arsenite was reported to have an anti-leukemic effect and was used for this purpose in the late 19th and early 20th centuries until it was replaced by busulfan in the 1950s [32, 34, 111]. In the modern era, interest in arsenic as a chemotherapy was rekindled after it was identified as an active ingredient in traditional medicines in China [24, 54, 68]. Arsenic drugs have been generally used for the treatment of malignant hematologic diseases [54, 114]. Although arsenic has been known as a poison, but it has been generally well tolerated as a therapeutic entity.
As2O3 has been confirmed to be an effective treatment for acute promyelocytic
leukemia (APL) both in patients with newly diagnosed APL and in those with refractory and relapsed APL [42, 43, 91, 109, 112, 115, 142]. The inhibitory effects of As2O3 have been shown not only in parental APL NB4 cells [14], but also in retinoic
acid-resistant APL cells [9]. It has been reported that the effects of As2O3 are not
confined to APL cells but can also be observed in various other cell lines of myeloid [125] and lymphoid origin [108, 143, 144] and in drug resistant sublines [31, 97]. The mechanisms of action of As2O3 in APL and other malignancies are thought to involve
inhibition of growth and induction of apoptosis [1, 9, 14, 24, 143, 144].
MOLT-4, a human T-lymphoblastoid leukemia cell line, has been used extensively for studies of leukemia cell biology and antileukemia therapy [4, 25]. We have established a daunorubicin resistant MOLT-4 subline (MOLT-4/DNR) by exposing the parental MOLT-4 cells stepwise to increasing concentrations of DNR over 3 months [77]. These resistant MOLT-4/DNR cells have been shown to overexpress functional P-glycoprotein (P-gp) and MDR1 mRNA [77]. P-gp, a product of the multidrug resistance (MDR) gene, is a transmembrane efflux pump for different lipophilic compounds, including many anticancer drugs and fluorescent dyes [11, 12]. Intracellular drug accumulation in cells expressing functional P-gp has been found to be decreased as a result of drug efflux [26]. Most of the drugs excreted via this efflux pump are hydrophobic organic compounds, and As2O3 may not be excluded from
drug-resistant cell lines expressing functional P-gp. However, whether As2O3 affects
the growth of lymphocytic leukemia cells expressing functional P-gp, or the expression and/or function of P-gp, is unknown. Some data indicate that As2O3 is not
sensitive to the drug efflux pump mechanisms of resistance [26, 142].
Thus, in Chapter 1, the effects of As2O3 on the growth of and apoptosis in
parental MOLT-4 and resistant MOLT-4/DNR cells were investigated. These suppressive effects of As2O3 were also related to P-gp expression or function in
MOLT-4/DNR cells.
Some reports suggest that sensitivity to As2O3 correlates with intracellular
resistant cells are also reported to contain higher levels of GSH [66, 72, 78]. Moreover, cells with increased GSH levels can be sensitized to As2O3 by agents that deplete
intracellular GSH [18, 66]. The cytotoxic effects of As2O3 may be influenced by
modulators of GSH [31, 33, 67, 89], especially in drug-resistant cell lines [28, 100]. A decrease in cellular GSH level acts as a potent early activator of apoptosis signaling [3]. Depletion of GSH, especially mitochondrial GSH, is believed to induce the loss of mitochondrial membrane potential (MMP) [84]. Mitochondrial permeability transition resulting from intracellular thiol depletion is known to be a critical event in apoptosis [75, 136]. Mitochondria undergoes major changes in membrane integrity before classical signs of apoptosis become manifest, and these changes lead to disruption of the MMP [116]. Mitochondrial depolarization precedes caspase-3 activation and apoptosis [107], and apoptotic cells express high caspase-3 activity [56, 147]. Caspase-3 is considered to be a primary executioner of apoptosis [10]. Caspase-3 activation has been causally related to the release of mitochondrial cytochrome c in the cytoplasm as a result of the collapse of the MMP [76]. As2O3 is
known to act at several points in apoptosis induced through mitochondrial pathways [19], which includes the forming of reversible bonds with thiol groups [118] and the depletion of GSH [18, 66, 93, 138], loss of MMP [58], and activation of caspase-3 [28, 58, 59, 83, 96].
From these points of view, the apoptosis-inducing effects of As2O3 in the
presence of GSH modulators in MOLT-4 and MOLT-4/DNR cells were examined in Chapter 2.
It has been recognized that benefit and risk of arsenic are strictly dependent on the individual chemical forms of arsenic instead of arsenic content alone [17]. Although As2O3 has been confirmed to be an effective treatment for APL [42, 127],
which acts through a variety of mechanisms involving numerous signal transduction pathways, and its cellular effects were mediated through apoptosis induction, growth inhibition and differentiation induction [6, 64, 88]. However, serious adverse drug reaction induced by As2O3 was occasionally reported, which deters some physicians
from using it clinically [27].
Arsenic disulfide (As2S2), the most important component of Xiong huang which
contains > 90% As2S2 based on the quality standard in Chinese Pharmacopeia in 2010
edition, was a candidate for its good therapeutic reputation and perceived low toxicity in traditional medicines, and the drug may become another research focus following As2O3. Actually, the clinical use of arsenic-containing formulae to treat malignant
hematologic diseases in China occurred as early as the beginning of medical use of As2O3 [54]. Especially, the famous traditional arsenic-containing formula, Qinghuang
Powder (QHP), which includes Qing Dai (Indigo naturalis) and Xiong huang in the formula, was reported to improve the clinical outcomes of hematologic malignancies in our clinical trials [49], and its therapeutic efficacy could be enhanced by increasing the Xiong huang content in the formula [145], which could be attributed to As2S2.
Some patients treated with these regents have been reported to survive for 9-20 years with relatively good oral safety profiles [126]. These give As2S2 an advantage over
8
in tumor cells by affecting the mitochondria and generation of reactive oxygen species [36, 40, 29, 63]. Mitogen activated protein kinases (MAPKs) are a family of enzymes that transduce signals from the cell membrane to the nucleus in response to a wide range of stimuli, and modulate several important biological functions including gene expression, mitosis, proliferation, motility, and apoptosis. Three major groups of MAPKs exist, the extracellular signal–regulated kinase, c-jun NH2-terminal kinase, and p38 MAPK families [98]. Roles of p38 MAPK in relation to reactive oxygen species (ROS) generation, GSH level and apoptosis induced by As2O3 have been
demonstrated [40, 29, 63]. As2S2-mediated growth inhibition and apoptosis induction
have been found in leukemia K562 cells [73], human ovarian and cervical cancer cells [132], and other cells [120]. However, the effects of As2S2 on HL-60 cells with a
particular focus on proliferation, differentiation, oxidative stress associated with generation of reactive ROS and intracellular GSH depletion, and activation of p38 MAPK have not been addressed.
Thus, in Chapter 3, the effects of As2S2 on HL-60 cells were investigated by
focusing on proliferation, differentiation, generation of ROS, intracellular GSH depletion, and activation of p38 MAPK.
Patients with AML from myelodysplastic syndrome (MDS/AML) have higher probabilities of multidrug resistance to chemotherapy, lower rates of complete remission, and the poor prognosis [71]. Univariate analyses showed that the hemoglobin level and cytogenetic abnormalities were factors that contributed to the overall survival [68]. The data have shown that MDS/AML patients tended to have complex type abnormalities including monosomy-7, which is considered to be an unfavorable risk subgroup [34, 68]. In our recent clinical trials, we have revealed that QHP is effective in the treatment of MDS, especially in patients with the erythroid improvement is significant, without serious adverse drug reaction observed even on long time [133-135]. Furthermore, a high responding rate (80.8%) was also observed in patients with blast cell-decrease and hematologic improvement having moderate- and high-risks, by increasing the daily dose of QHP [74]. These results indicated that QHP is effective in treating MDS or MDS/AML even in patients with the poor karyotype, and its therapeutic efficacy could be enhanced by increasing the Xiong
huang content in the formula, which could be attributed to As2S2. F-36p cell line was
established from a patient diagnosed as refractory anemia with excess blasts, the disease progressed to overt leukemia at approximately 5 months after the initial diagnosis [15]. The majority of the established cells had a homogeneous karyotype. F-36p cells can be induced to differentiate into the erythroid lineage in the presence of erythropoietin.
Thus, in Chapter 4, the effective mechanisms of As2S2 in the treatment of MDS
Chapter 1
Arsenic trioxide induces apoptosis equally in T lymphoblastoid leukemia MOLT-4 cells and P-gp-expressing daunorubicin-resistant MOLT-4 cells
1.1 INTRODUCTION
As2O3 has recently been confirmed to be an effective treatment for APL both in
patients with newly diagnosed APL and in those with refractory and relapsed APL [42, 43, 91, 109, 112, 115, 142]. The effects of As2O3 have been shown not only in
parental APL NB4 cells [14], but also in retinoic acid-resistant APL cells [9].
MOLT-4, a human T-lymphoblastoid leukemia cell line, has been used extensively for studies of leukemia cell biology and antileukemia therapy [4, 25]. A daunorubicin resistant MOLT-4 subline, MOLT-4/DNR, has been established by exposing the parental MOLT-4 cells stepwise to increasing concentrations of DNR over 3 months [77]. MOLT-4/DNR cells have been shown to overexpress functional P-gp and MDR1 mRNA [77].
In this Chapter, the effects of As2O3 on the growth of and apoptosis in parental
MOLT-4 and resistant MOLT-4/DNR cells were investigated, and the possible mechanisms of growth suppression by As2O3 in these cell lines were discussed.
1.2 MATERIALS AND METHODS 1.2.1 Reagents
RPMI-1640 medium and fetal bovine serum (FBS) were purchased from Gibco BRL (Grand Island, N.Y.). Cell proliferation kits I and II (MTT) were purchased from Roche Diagnostics (Indianapolis, Ind.). Trypan blue, Rh123, DNR and As2O3 were
obtained from Sigma Chemical Company (St. Louis, Mo.). DNR stock solutions were made at a concentration of 10 mmol/l with ethanol and diluted to working concentrations before use. As2O3 stock solutions were made at a concentration of 5
mmol/l with phosphate-buffered saline (PBS) and diluted to working concentrations before use. Mouse anti-human P-gp monoclonal antibody conjugated with Rphycoerythrin (R-PE) (monoclonal antibody 17F9) and R-PEconjugated mouse IgG2b isotype control monoclonal antibody were obtained from PharMingen (San Diego, Calif.). The annexin V-FITC apoptosis detection kit I was obtained from BD PharMingen.
1.2.2 Cell culture
MOLT-4 and MOLT-4/DNR cells were maintained in RPMI-1640 medium containing 10% FBS, 100 U/ml penicillin and 100 μg/mL streptomycin as described previously [37, 38]. The leukemia cells were washed and resuspended with the above medium to 5 × 10⁵ cells/mL, then 196 μl of the cell suspension was placed in each well of a 96-well flat-bottomed plate. To the suspension in each well was added 4 μl PBS solution containing As2O3 and 4 μl ethanol solution containing DNR to yield
10
respectively. The cells were incubated for 96 h in an atmosphere of air containing 5% CO2 at 37 °C in a humidified chamber.
1.2.3 MTT assay
After the incubation period, 10 μl of MTT labeling reagent (final concentration 0.5 mg/mL) was added to each well and the plate was placed on a microshaker for 10 s, after which the cells were further incubated for 4 h in a humidified atmosphere. Subsequently, 100 μl of solubilization solution (Roche) was added to each well and the plate was placed on a microshaker for 10 s, after which the plate was left overnight in an incubator in a humidified atmosphere. The spectrophotometric absorbance of the samples was measured on a microplate reader (Corona MT P-32; Corona Company, Japan) at 570 nm. A dose response curve was plotted for each drug, and the concentrations that yielded a 50% inhibition of cell growth (IC50) were
calculated.
1.2.4 Cell viability assay
MOLT-4 and MOLT-4/DNR cell lines were cultured by initially seeding 2 × 10⁵ cells/mL of fresh RPMI-1640 medium containing 10% FBS, 100 U/mL penicillin and 100 μg/mL streptomycin in the presence of various concentrations of As2O3 for 24 to
144 h in an atmosphere of air containing 5% CO2 at 37 °C in a humidified chamber.
To avoid any possible effects of cell density on cell growth and survival, cells were maintained at less than 5 × 10⁵ cells/mL by daily adjusting the cell concentration by adding fresh culture medium and the corresponding concentrations of As2O3 when
necessary. The number or percentage of viable cells was determined by staining the cell populations with trypan blue. Before carrying out the experiments, four parts of 0.2% trypan blue (w/v in water) were mixed with one part of saline (4.25% NaCl w/v in water), and one part of the trypan blue saline solution was added to one part of the cell suspension. The cells were then loaded into a hemocytometer and the number of unstained (viable) cells and stained (dead) cells were counted separately within 3 min of staining with trypan blue. Actual cell numbers were calculated by multiplying the initial cell numbers by the times dilution.
1.2.5 Morphological changes in As2O3-treated MOLT-4 and MOLT-4/DNR cells MOLT-4 and MOLT-4/DNR cells suspended at 5 × 10⁵ cells/mL in fresh medium were cultured in the presence or absence of As2O3 for 24 to 144 h in an
atmosphere of air containing 5% CO2 at 37 °C in a humidified chamber. At the
indicated times, pictures were taken under a microscope (Olympus Optical Company, Japan).
1.2.6 P-gp expression analysis
MOLT-4 and MOLT-4/DNR cells suspended at 1 × 10⁶ cells/mL in fresh medium were cultured in the presence or absence of As2O3 for 3 to 24 h in an
atmosphere of air containing 5% CO2 at 37 °C in a humidified chamber. At the
(PBS/0.1% NaN3, pH 7.2). Cells were resuspended in 50 μl buffer and then incubated
with either 20 μl of monoclonal antibody 17F9 or 20 μl of the R-PEconjugated mouse IgG2b isotype control monoclonal antibody for 30 min in the dark. The cells were then centrifuged again in washing buffer (PBS/0.1% NaN3, pH 7.2) at 1300 rpm for 5
min at 4 °C. The cells were resuspended in 400 μl staining buffer (PBS/ 0.1% NaN3/1% FBS, pH 7.2) and P-gp expression was determined by flow cytometry
(Becton Dickinson). The data were analyzed with Cell Quest software (Becton Dickinson).
1.2.7 P-gp efflux function
Cells (1 × 10⁶) were collected and centrifuged at 1300 rpm for 5 min at 4 °C, resuspended in buffer containing 5 μg/mL of Rh 123, and left to stand for 10 min in an atmosphere of air containing 5% CO2 at 37 °C. After washing, the cells were
incubated in the presence or absence of As2O3 or inhibitor cyclosporine A for the
indicated times in an atmosphere of air containing 5% CO2 at 37 °C. After incubation,
the cells were washed twice in washing buffer and resuspended in 400 μl staining buffer. The remaining intracellular Rh 123 fluorescence intensity was determined by a flow cytometry (Becton Dickinson). The data were analyzed with Cell Quest software (Becton Dickinson).
1.2.8 Apoptosis assays
MOLT-4 and MOLT-4/DNR cells (1 × 10⁶/mL) were treated with the indicated concentrations of As2O3. After the indicated incubation times, cells were washed
twice in cold PBS (pH 7.2) and resuspended in binding buffer at a density of 1 × 10⁶ cells/mL, and then 1 × 10⁵ cells were stained with 5 μl annexin V-FITC and 5 μl propidium iodide (Becton Dickinson) for 15 min at room temperature in the dark. Then 400 μl binding buffer was added to each tube, and the cells were analyzed by flow cytometry (Becton Dickinson) within 1 h of staining. A total of 30,000 non-gated cells were analyzed.
1.2.9 Statistics
Comparison of the data between two groups was carried out using Student’s t-test. Comparison of the data among multiple (more than three) groups was carried out using the Bonferroni-Dun multiple comparison. A value of p<0.05 was considered significant.
1.3 RESULTS
1.3.1 Effects of As2O3 on parental MOLT-4 and resistant MOLT-4/ DNR cell
growth
MOLT-4 and MOLT-4/DNR cells were continuously treated with As2O3 at
12
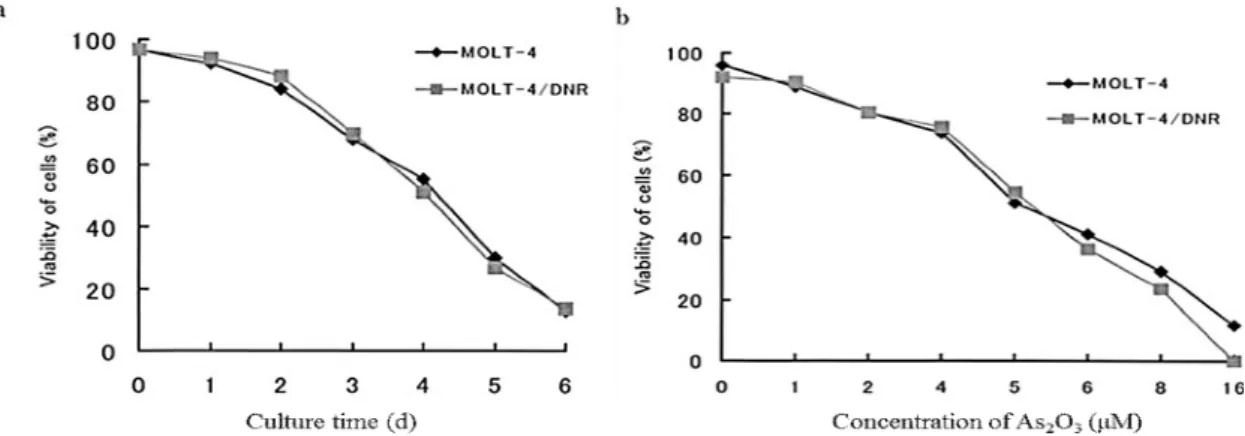
subline cells were 5.1 μM and 5.0 μM, respectively (Fig. 1-1a).
At the same time, the viability of MOLT-4 and MOLT-4/DNR cells similarly decreased when the cells were incubated in the presence of As2O3 at a concentration
of 5 μM for 24 to 144 h in a time-dependent manner (Fig. 1-2a). Following treatment with As2O3 for 4 days at concentrations of 1 to 16 μM, the viability of cells of both
lines decreased to a similar extent in a dose-dependent manner (Fig. 1-2b).
The effects of DNR on the growth of MOLT-4 and MOLT-4/DNR cells were examined after 96 h in culture. The IC50 value of DNR in MOLT-4 cells assessed by
the MTT assay was 0.1 μM, while in MOLT-4/ DNR cells the value was 12 times higher (1.2 μM) (Fig. 1-1b). Thus, DNR was effective against parental MOLT-4 cells, but less effective against MOLT-4/DNR cells, as expected.
Fig. 1-1 Comparative effects of As2O3 (a) and DNR (b) on in vitro growth of MOLT-4 and
MOLT-4/DNR cells. Cells were treated with different concentrations of As2O3 and DNR for 4 days. Cell growth was determined by an MTT assay. Values are the means of three independent experiments.
Fig. 1-2 Comparison of viabilities of cells treated with As2O3 as a function of culture days (a)
and concentration of As2O3 (b) between MOLT-4 and MOLT-4/DNR cells. a: cells treated
with 5 μM of As2O3, b: cells treated with the agent for 4 days. Cell viability was determined by a dye exclusion test. Values are the means of three independent experiments
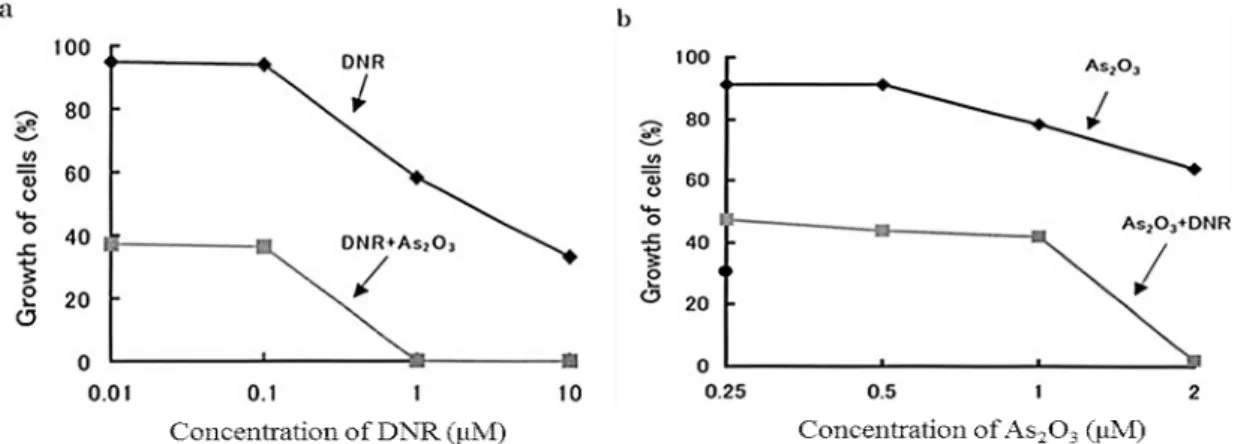
1.3.2 Additive effect of As2O3 with DNR on MOLT-4/DNR cell growth
of DNR combined with As2O3 at 2 μM, their growth was inhibited (Fig. 1-3a). The
suppressive effects of As2O3 and DNR appeared to be additive, and depended on the
dose of DNR (Fig. 1-3a).
As described above, the effects of As2O3 on the growth of MOLT-4/ DNR cells
were observed at As2O3 concentrations > 2 μM (Fig. 1-1a, Fig. 1-2b). However, when
the cells were treated with As2O3 at concentrations in the range 0.25 to 2 μM
combined with 0.1 μM DNR, the effect of As2O3 on cell growth was additively
increased (Fig. 1-3b).
Fig. 1-3 Additive effect of DNR and As2O3 on the growth of MOLT-4/DNR cells. a: DNR
concentrations varied, while As2O3 concentration was kept to be constant at 2 μM. b: As2O3 concentrations varied, while DNR concentration was kept to be constant at 0.1 μM DNR. Cells were treated for 4 days. Cell growth was determined by an MTT assay. Values are the means of three independent experiments
1.3.3 As2O3 did not change the P-gp expression and function of MOLT-4/ DNR
cells
14
Fig. 1-4 Comparison of P-gp expression (a) and function (b) between MOLT-4 and MOLT-4/DNR cells. b; Effects of P-gp inhibitor cyclosporine A at 100 ng/mL on the P-gp expression and efflux function of MOLT-4 and MOLT-4/DNR cells. P-gp expression and function were determined by flow cytometry as described in Materials and methods. Values are the means ± SD of three independent experiments.
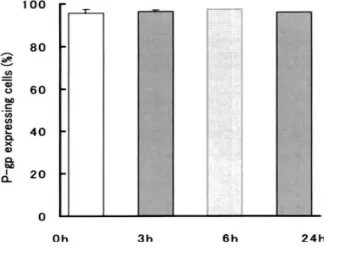
When MOLT-4/DNR cells were cultured in the presence of As2O3 at a
concentration of 5 μM for 3 to 24 h, the percentages of P-gp expression did not change from those in the absence (0 h) of As2O3 (Fig. 1-5). When MOLT-4/DNR
cells were incubated with As2O3 for 3, 6 or 24 h at concentrations of 1 to 8 μM, the
percentage of cells expressing P-gp also did not change as compared to control (data not shown).
Fig. 1-5 Effect of As2O3 on P-gp
expression of MOLT-4/DNR cells. Cells were incubated in the presence of 5 μM As2O3 for 3, 6 and 24 h, and the percentages of cells expressing P-gp determined by flow cytometry. Values are the means ± SD of three independent experiments.
Fig. 1-6 Comparison of As2O3 and
cyclosporine A in inhibiting P-gp efflux function. P-gp efflux function was determined by flow cytometry as described in Materials and Methods. Values are the means ± SD of three independent experiments.
1.3.4 As2O3 induces apoptosis in cells of both the MOLT-4 and MOLT-4/DNR
cell line
MOLT-4 and MOLT-4/DNR cells showed a similar round morphology after culture for 96 h (Fig. 1-7a, b), but after treatment with various concentrations of As2O3 for 96 h, cells of both lines exhibited the typical morphological characteristics
of apoptosis including chromatin condensation and fragmentation of nuclei (Fig. 1-7c, d). Numerous apoptotic bodies, which are membrane-enclosed vesicles that have budded off cytoplasmic extensions, were also observed in these cells (Fig.1- 7c, d).
Fig. 1-7 Cell morphology after treatment with 5 μM As2O3 for 4 days. a; untreated
MOLT-4 cells, b; untreated MOLT-4/DNR cells, c; As2O3- treated MOLT-4 cells, d; As2O3-treated MOLT-4/DNR cells
In MOLT-4 and MOLT-4/DNR cells cultured in the presence of As2O3 for 4
days at concentrations of 1 to 8 μM, the percentage of apoptotic cells as determined by annexin V increased in a dose-dependent manner (Fig. 1-8a), and when these cells were incubated with As2O3 at a concentration of 5 μM for 3 to 144 h, the percentage
16
Fig. 1-8 Induction of apoptosis by As2O3 in MOLT-4 and MOLT-4/ DNR cells. a; Percent
apoptotic cells as a function of As2O3 concentration after culture for 4 days, b; Percent apoptotic cells as a function of incubation time in the presence of 5 μM As2O3. Values are the means of three independent experiments.
1.4 DISCUSSION
The results described above showed that As2O3 inhibited growth and induced
apoptosis equally in MOLT-4 cells and MOLT-4/DNR cells. The results also suggested that the effects of As2O3 on growth of MOLT-4/DNR cells were not due to
suppression of P-gp expression or function in these cells.
The MOLT-4/DNR cell line was derived in our laboratory from the parental MOLT-4 cell line by exposing the cells stepwise to increasing concentrations of DNR [77], and the cell line was shown to be persistently resistant to DNR. The IC50 value
of DNR in MOLT-4/DNR cells was 12 times higher than that in parental MOLT-4 cells as assessed by the MTT assay. The resistance of MOLT-4/DNR cells to DNR has been reported to be closely correlated with the expression of functional P-gp [77].
MDR is recognized as one of the most common causes of failure of chemotherapy in the treatment of cancer patients [45, 46, 47]. P-gp is an ATP-binding cassette transporter, which hydrolyses ATP and expels cytotoxic drugs from mammalian cells [102]. The fluorescent dye Rh123 has been found to be transported by P-gp [22, 39, 90], and the flow cytometric measurement of cellular Rh123 uptake/efflux is an efficient tool to assess the functional activity of P-gp in tumor samples [79, 80]. In this work, we revealed that 94% of MOLT-4/DNR cells express P-gp, and the percentage of P-gp expression in MOLT-4/DNR cells was significantly higher than that in MOLT-4 cells (less than 3%). Furthermore, MOLT-4/DNR cells exhibited significantly higher P-gp efflux activity than parental MOLT-4 cells. However, both parental MOLT-4 and resistant MOLT-4/DNR cell lines were highly sensitive to As2O3. As2O3 similarly inhibited growth and induced apoptosis in these
two cell lines. These effects of As2O3 were time- and dose- dependent. These results
suggest that P-gp in MOLT-4/DNR cells is not involved in the detoxification of As2O3.
for the cell line. The efflux function of P-gp in MOLT-4/DNR cells also did not change in the presence of various concentrations of As2O3. These observations
confirm our conclusion that As2O3 exhibited cytotoxicity without influencing
functional P-gp in the resistant MOLT-4/DNR cells.
Arsenic is a natural substance that has been used medicinally for over 2400 years [130]. Recent clinical studies in China have shown that As2O3 is an effective and
relatively safe drug in the treatment of APL [42, 43, 109, 142]. As2O3 can inhibit
growth and trigger apoptosis in cells of the APL cell line NB4 [13, 14]. In particular, As2O3 is also effective in APL patients who are resistant to all-trans-retinoic acid
(ATRA) and conventional chemotherapy [9, 13]. In some in vitro studies, the growth and survival of ATRA-resistant APL subline cells have been found to be inhibited effectively by As2O3 [9,14]. In addition, the suppressive effect of As2O3 is not specific
for APL cells, but can be observed in various cell lines of myeloid [125], lymphoid [108, 143, 144] or T-cell origin [23, 57]. Among multiple myeloma cells, the P-gp-positive cell line 8226/Dox40 undergoes apoptosis in response to As2O3 in vitro,
in a similar manner to the drug-sensitive cell line 8226/S [31]. Otherwise, As2O3-induced apoptosis in HL-60/VCR and HL-60/ADR cells is not significantly
different from that in HL-60/neo cells [97]. Thus, previous results suggest that As2O3
is not a substrate for the mdr1 gene-encoded P-gp. In this study, we demonstrated that As2O3 is not sensitive to drug efflux pump mechanisms of resistance.
Studies on clinical pharmacokinetics of As2O3 have shown that the peak level of
plasma As2O3 concentration under a general treatment schedule is 5.5 to 7.3 μM [109].
In the present study, the concentrations of As2O3 inducing apoptosis in vitro were
from 1 to 8 μM in a dose- and time-dependent manner in both MOLT-4 and MOLT-4/DNR cells. A remarkably effective concentration of As2O3 inducing
apoptosis in these cell lines was 5 μM, which is not over the peak level in clinical trials.
Previous studies based on experiments with the APL cell line NB4 have indicated that As2O3 causes apoptosis directly through down- regulation of bcl-2 [13].
On the other hand, the GSH redox system is known to modulate the growth-inhibitory effect of arsenicals [18, 92]. It was found that the sensitivity to As2O3-induced
apoptosis is inversely related to the intracellular GSH content and that pharmacological modulation of intracellular GSH contents influences sensitivity to As2O3 [18]. Thus, the effects of As2O3 in inhibiting growth and inducing apoptosis in
the parental MOLT-4 and the resistant MOLT-4/ DNR cells may possibly be related to the regulation of suppressor gene (s) particularly bcl-2 and the GSH redox system.
Since As2O3 showed no effect on P-gp expression and function in MOLT-4/DNR
cells, the additive efficacy of As2O3 with DNR possibly results from the
apoptosis-inducing effect of As2O3. This apoptosis- inducing effect of As2O3 is
possibly caused by regulation of bcl-2 and/or depletion of GSH from the leukemic cells [13, 18, 92]. DNR is known to block DNA replication and RNA synthesis, and therefore, the apoptosis-inducing effect of As2O3 is possibly additive to (or synergistic
18
presence of As2O3 in MOLT- 4/DNR cells, a combination of these drugs may work
additively through different growth-suppressing mechanisms. This additive effect can cause a considerable shift in the dose-response curve of each agent. These findings may imply potential clinical uses of DNR in combination with As2O3 for the
treatment of patients with T-lymphoblastoid leukemia exhibiting DNR resistance.
1.5 CONCLUSION
The data in this chapter demonstrated that As2O3 is effective in suppressing
growth and inducing apoptosis in both parental MOLT-4 cell line and its DNR-resistant MOLT-4/DNR cell line expressing functional P-gp. These suppressive effects of As2O3 are suggested not to be caused by inhibition of P-gp expression or
Chapter 2
Arsenic trioxide induces apoptosis in cells of MOLT-4 and its daunorubicin-resistant cell line via depletion of intracellular glutathione, disruption of mitochondrial membrane potential and activation of caspase-3
2.1 INTRODUCTION
In response to the observations that patients with chemorefractory APL still respond to As2O3 therapy [42, 109, 112] and in vitro studies of the effects of As2O3 on
drugresistant APL cell lines [30], investigations have been initiated to evaluate the therapeutic potential of As2O3 in several malignant diseases [108, 143, 144]. Most of
the reports suggest that As2O3 suppresses growth and induces apoptosis in malignant
cells including drug-resistant cells [13, 30, 108, 143, 144].
As shown in Chapter 1, As2O3 is effective in growth suppression and apoptosis
induction in both MOLT-4 and MOLT-4/DNR cells.
Then, in this Chapter, the apoptosis- inducing mechanisms of As2O3 in MOLT-4
and MOLT-4/DNR cell lines were investigated from the viewpoint of modification of cellular GSH levels, MMP, and caspase-3.
2.2 MATERIALS AND METHODS 2.2.1 Reagents
Ascorbic acid (AA), N-acetylcysteine (NAC), and L-buthionine-[S,R]-sulfoxide (BSO) were obtained from Sigma Chemical Company (St. Louis, Mo.). All of the agents were dissolved in PBS and diluted to a working concentration before use. A GSH assay kit was obtained from Cayman Chemical Company (Ann Arbor, Mich.). Metaphosphoric acid and triethanolamine were purchased from Aldrich Chemical Company (Milwaukee, Wis.). A PhiPhiLux-G1D2 kit was from MBL (OncoImmunin, Gaithersburg, Md.). Propidium iodide (PI) was from BD PharMingen.
2.2.2 Cell culture
Culture of MOLT-4 and MOLT-4/DNR cells was carried out as described in Chapter 1. The leukemia cells were washed and resuspended with the above medium to 5 × 10⁵ cells/mL, then 196 μl cell suspension was placed in each well of a 96-well flat-bottom plate. PBS solutions (4 μl) containing As2O3, AA, BSO, and NAC alone
or in combination with As2O3 with AA, BSO or NAC were added to yield the final
indicated concentrations (see Results). PBS (4 μl) was added to the control wells.
2.2.3 MTT assay
After the incubation period, 20 μl of the MTT labeling reagent was added to each well to yield a final concentration of 0.5 mg/mL. Other assay procedures are same as those described in Chapter 1.
2.2.4 Viability of cells
20
of fresh medium in the presence or absence of As2O3 alone or in combination with
As2O3 with AA, BSO and NAC for 24-96 h in an atmosphere comprising 5% CO2/air
at 37 oC in a humidified chamber. The number or percentage of viable cells was determined by staining cell populations with trypan blue, as described in Chapter 1.
2.2.5 Measurement of intracellular GSH
Cells (1 × 10⁷) were treated for 48 h with various agents and collected by centrifugation at 1300 g for 10 min at 4 oC. The cells were resuspended in 500 μl of 50 mM cold MES buffer, and then homogenized with a Handy pestle (Toyobo Company, Osaka, Japan) or sonicated with a Handy sonic (Tomy Seiko Company, Tokyo, Japan). After centrifugation at 10,000 g for 15 min at 4 oC, the supernatant was removed and stored on ice. The supernatant was deproteinated with 5% MPA at room temperature for 5 min and centrifuged at 3000 g for 4 min. Subsequently, 50 μl of 4 M TEAM reagent per ml of the supernatant was added, and the solution was mixed immediately with a vortex mixer. The standard and samples were combined with fresh assay cocktail according to the manufacturer’s instructions. Samples were incubated in the dark on an orbital shaker before measurement. The absorbance in the wells was measured at 415 nm using a microplate reader. The total GSH levels were determined by the End Point method.
2.2.6 Evaluation of MMP
MOLT-4 and MOLT-4/DNR cells (1 × 10⁶/mL) were treated with As2O3 alone or
in combination with AA, BSO, or NAC. The cells were washed twice in a cold PBS (pH 7.2) and then incubated with 10 μg/mL Rh123 for 15 min. The cells were then washed twice in cold PBS, and were analyzed by flow cytometry. Living cells concentrate Rh123 in the mitochondria, while the MMP in cells undergoing apoptosis is disrupted and the mitochondria in such cells release Rh123 [39]. Therefore, the disruption of MMP and subsequent cell apoptosis can be detected by the decrease in the Rh123 fluorescence intensity in the cells. A total of 30,000 non-gated cells were analyzed using a FACSCalibur analyzer (Becton Dickinson, San Jose, Calif.) to obtain dot data. These data were further analyzed using CellQuest Software (Becton Dickinson).
2.2.7 Assessment of caspase-3 activity
Cells (1 × 10⁶/mL) were treated with As2O3 alone or in combination with AA,
BSO, or NAC. After incubation, an aliquot of cells was placed into a 1.5-ml microcentrifuge tube, and the cells were then centrifuged and the entire culture medium was removed. Subsequently, 50 μl of a substrate solution containing 10 μM caspase-3 substrate was added to the cell pellet, and the suspension was mixed by flicking the tubes with the fingertip. The substrate molecule contains a peptide homodoubly labeled with a fluorophore. The cleaved substrate has specific fluorescence peak characteristics (λex 505 nm and λem 530 nm), which can be detected
by flow cytometry. After incubation of the tubes in 5% CO2/air at 37 oC in a
flow cytometry dilution buffer. The cells were resuspended in 1 ml fresh dilution buffer for analysis by flow cytometry. All samples were analyzed within 6 min of the end of the 37 oC incubation.
2.2.8 Apoptosis assays
After collecting data for caspase-3 activity, 5 μl 50 μg/mL PI was added and samples were reanalyzed flow cytometrically according to the manufacturer’s instructions. The data were reanalyzed within 5 min of PI addition, and the caspase+/PI-) cells were considered apoptotic cells.
2.2.9 Morphological changes of cells
MOLT-4 and MOLT-4/DNR cells (5 × 10⁵/mL) were cultured in the absence or presence of As2O3 alone or in combination with AA, BSO, or NAC for 72 h in an
atmosphere comprising 5% CO2/air at 37 oC in a humidified chamber. Pictures were
taken under a microscope (Olympus Optical Company, Tokyo, Japan).
2.2.10 Statistics
Student’s t-test was used to compare the data between two groups, and the Bonferroni/Dun multiple comparison test was used to compare the data among multiple (more than three) groups. A value of p<0.05was considered to be significant.
2. 3 RESULTS
2.3.1 Effects of BSO, AA, or NAC on the growth-inhibitory action of As2O3 in
MOLT-4 and MOLT-4/DNR cells
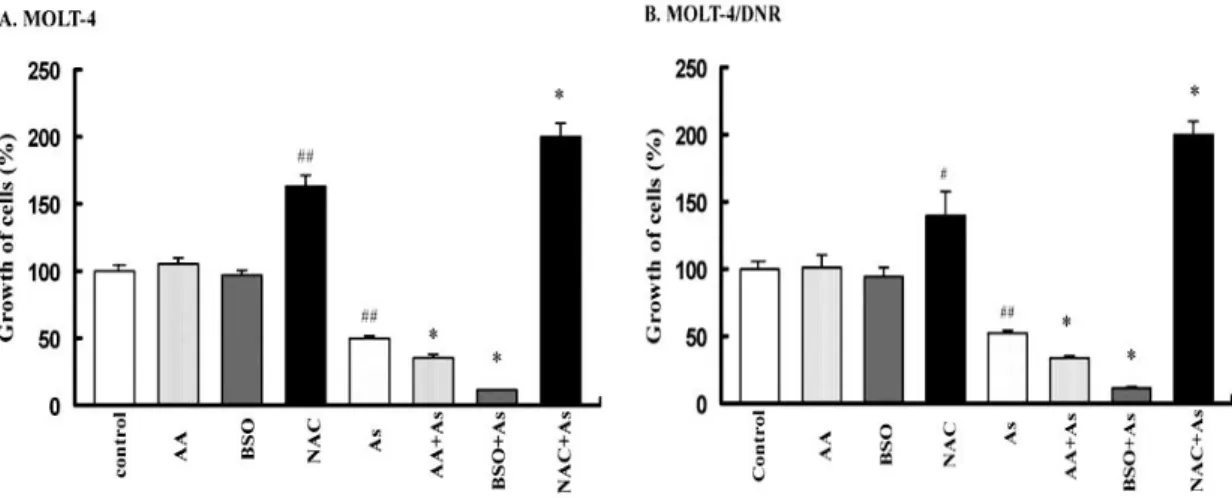
After 72 h of treatment, the growth-inhibitory effects of 5 μM As2O3 on MOLT-4
and MOLT-4/DNR cells were significantly enhanced by 100 μM BSO and 125 μM AA (Fig. 2-1). BSO is known to be a selective inhibitor of γ-glutamylcysteine synthetase, the rate-limiting enzyme in GSH synthesis [5]. The IC50 values of As2O3
on the cell growth of MOLT-4 and MOLT-4/DNR cells were 4.8 and 5.3 μM, respectively (Table 2-1). Thus, BSO and AA increased sensitivity to As2O3 treatment.
The IC50 values of As2O3 decreased significantly to less than 2 μM in the presence of
100 μM BSO (p<0.001). The IC50 values of As2O3 in both cell lines were also
decreased significantly (p<0.01) by the addition of AA (Table 2-1). Whereas, 100 μM BSO and 125 μM AA alone did not affect the growth of either MOLT-4 or MOLT-4/DNR cells (the IC50 values of both BSO and AA were higher than 500 μM ).
In contrast, NAC efficiently protected both MOLT-4 and MOLT-4/DNR cells from the cytotoxicity of As2O3, when the two cell lines were incubated with 5 μM As2O3 in
combination with 10 mM NAC for 72 h (Fig. 2-1). Thus, NAC made the cells of both the MOLT-4 and MOLT-4/DNR unresponsive to the growth-inhibitory effect of As2O3.
The IC50 values of As2O3 in the presence of NAC in these cell lines were determined
22
Fig. 2-1 Modulation of As2O3-mediated growth inhibition of MOLT-4 (A) and
MOLT-4/DNR (B) cells by BSO, AA, and NAC. Cells were treated with 5 μM of As2O3 in the absence or presence of 100 μM BSO, 125 μM AA, and 10 mM NAC for 72 h. Cell growth was determined by an MTT assay. Values are the means ± SD of three independent experiments. # p<0.05, ##p<0.001 vs control; *p<0.01 vs As2O3 alone.
Table 2-1. IC50 values (μM) of As2O3 alone or in combination with BSO, AA, and NAC on
MOLT-4 and MOLT-4/DNR cell growth.
Treatment MOLT-4 MOLT-4/DNR
IC50
As2O3 alone 4.8 ± 0.2 5.3 ± 0.3 As2O3+AA (125 μM) 3.5 ± 0.1** 4.3 ± 0.1* As2O3+BSO (100 μM) 1.2 ± 0.0** 1.1 ± 0.0** As2O3+NAC (10 mM) >8 >8
Cells were treated with 100 μM BSO, 125 μM AA, and 10 mM NAC in presence or absence of serial concentrations of As2O3 for 72 h, and cell growth was determined by an MTT assay. Values are the means ± SD of three independent experiments. *p<0.01, **p<0.001 vs As2O3 alone.
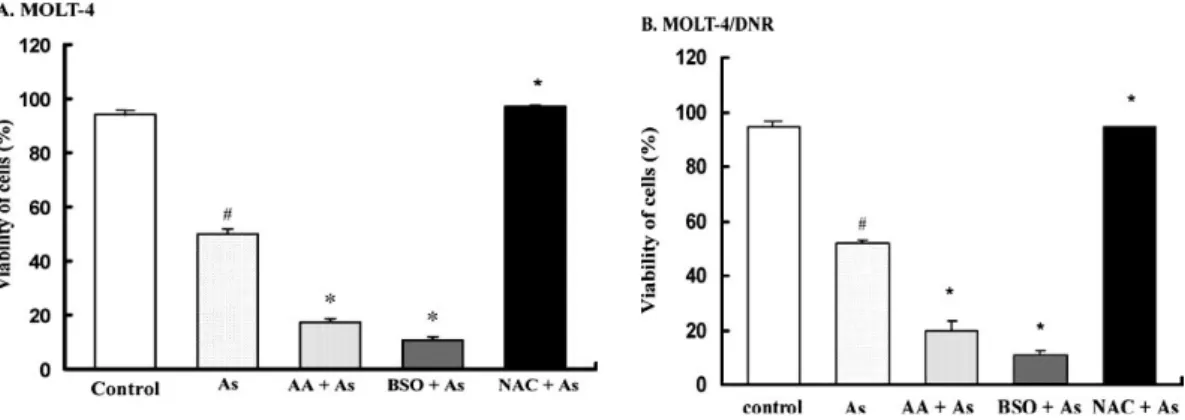
Similarly, the viability of MOLT-4 and MOLT-4/DNR cells was significantly decreased following incubation for 72 h with 5 μM As2O3 plus 100 μM BSO or 125
μM AA, as compared to cells treated with As2O3 alone (P<0.001, Fig. 2-2). In contrast,
10 mM NAC markedly increased the viability of these cells under the same culture conditions (p<0.001, Fig. 2-2).
Fig. 2-2 Modulation of As2O3-mediated reduction in viability of MOLT-4 (A) and
MOLT-4/DNR (B) cells by BSO, AA, and NAC. Cells were incubated in the absence or presence of 5 μM As2O3 in the absence or presence of 100 μM BSO, 125 μM AA, or 10 mM
NAC for 72 h. Cell viability was determined by a dye exclusion test. Values are the means ± SD of three independent experiments. # p<0.001 vs control; *p<0.001 vs As2O3 alone.
2.3.2 Intracellular GSH content modulated by BSO, AA, or NAC in MOLT-4 and MOLT-4/DNR cells
The GSH contents of MOLT-4 and MOLT-4/DNR cells were 105.0 ± 1.6 and 105.6 ± 2.4 μM/107 cells, respectively, when the two cell lines were incubated in the absence of the modulating agents for 48 h. Thus, the intracellular GSH contents of MOLT-4 and MOLT-4/DNR cells were at the same level.
MOLT-4 and MOLT-4/DNR cells were incubated in the absence or presence of 100 μM BSO, 125 μM AA or 10 mM NAC for 48 h. These treatments resulted in significant changes in GSH content (Fig. 2-3). BSO decreased the GSH content to a greater extent (p<0.01), and AA also significantly decreased GSH level (p<0.05) in both MOLT-4 (Fig. 2-3A) and MOLT-4/DNR (Fig. 2-3B) cells. Whereas, NAC significantly increased the GSH content (p<0.05) in these cells.
24
2.3.3 Disruption of MMP in MOLT-4 and MOLT-4/DNR cells
The disruption of MMP by As2O3 and its modulation by AA, BSO or NAC are
presented in Figs. 2-4 and 2-5. In each histogram, the percentage of cells with decreased MMP is indicated. The disruption of MMP in MOLT-4 (Figs. 2-4A and 2-5A) and MOLT-4/DNR (Figs. 2-4B and 2-5B) cells was significantly higher (p<0.01) after 72 h treatment with 5 μM As2O3 than in untreated cells. This
As2O3-induced disruption of MMP was markedly enhanced by AA (p<0.01) and BSO
(p<0.001) in both MOLT-4 (Fig. 2-5A) and MOLT-4/DNR (Fig. 2-5B) cells (Figs. 2-4Ac,d, Bc,d). In particular, BSO elevated this ability almost completely (Fig. 2-5), while the As2O3-induced disruption of MMP was blocked by NAC in these cells (Figs.
2-4Ad,e, Bd,e, and Fig. 2-5). In contrast, 125 μM AA, 100 μM BSO and 10 mM NAC treatment alone did not influence the MMP of these cells (data not shown).
Fig. 2-4 Typical histograms showing the disruption of MMP in MOLT-4 cells (A) and MOLT-4/DNR cells (B) incubated for 72 h in the absence (a) or presence of 5 μM As2O3 alone (b) or with
a combination of 5 μM As2O3 and 125 μM AA (c),
100 μM BSO (d), or 10 mM NAC (e). The percentage given in each histogram is the percentage of cells with decreased MMP.
Fig. 2-5 MMP disruption in MOLT-4 cells (A) and MOLT-4/DNR cells (B) treated with 5 μM As2O3 alone or with a combination of 5 μMAs2O3 and 125 μM AA, 100 μM BSO, or 10
2.3.4 Activation of caspase-3 in MOLT-4 and MOLT-4/DNR cells
The activation of caspase-3 by As2O3 and its modulation by AA, BSO or NAC is
presented in Figs. 2-6 and 2-7. In each histogram in Fig. 2-6, the percentage of cells expressing relatively high activity of caspase-3 is indicated. After 72 h of treatment, 5 μM As2O3 significantly induced caspase-3 activity in MOLT-4 (p<0.01) (Fig. 2-7A)
and MOLT-4/DNR (p<0.01) (Fig. 2-7B) cells (Fig. 2-6). This activation of caspase-3 was markedly potentiated by AA (p<0.001) and BSO (p<0.001) in both MOLT-4 (Fig. 2-7A) and MOLT-4/DNR (Fig. 2-7B) cells (Figs. 2-6Ac,d, Bc,d). In particular, BSO elevated the levels of caspase-3 activity to a greater extent, whereas the enzyme activation by As2O3 was completely attenuated by NAC in both MOLT-4 (p<0.01)
(Fig. 2-7A) and MOLT-4/DNR (p<0.001) (Fig. 2-7B) cells (Figs. 2-6Ae, Be). In contrast, 125 μM AA, 100 μM BSO and 10 mM NAC treatment alone did not modulate the caspase-3 activity of these cells (data not shown).
Fig. 2-6 Typical histograms showing the changes in percentage of MOLT-4 cells (A) and MOLT-4/DNR cells (B) exhibiting caspase-3 activity following treatment for 72 h in the absence (a) or presence of 5 μMAs2O3 alone (b) or with
a combination of 5 μM As2O3 and 125
μM AA (c), 100 μM BSO (d), or 10 mM NAC (e). The percentage given in each histogram is the percentage of cells with caspase-3 activity.
Fig. 2-7 Changes in caspase-3 activity after treating MOLT-4 cells (A) and MOLT-4/DNR cells (B) for 72 h with 5 μM As2O3 alone or with a combination of 5 μM As2O3 and 125 μM
AA, 100 μM BSO, or 10 mM NAC. Values are the means ± SD of three independent experiments.
#
26
2.3.5 Modulation of As2O3-induced apoptosis by AA, BSO, or NAC in MOLT-4
and MOLT-4/DNR cells
As2O3-induced apoptosis and its modulation by AA, BSO or NAC are presented
in Figs. 2-8 and 2-9. The dots in the upper left quadrant are those of caspase+/PI- cells indicating apoptotic cells. In each dot plot the percentage of apoptotic cells is indicated. In these experiments, the cells were treated in the absence or presence of 5 μM As2O3 alone or in combination with 100 μM BSO, 125 μM AA or 10 mM NAC.
5 μM As2O3 treatment alone induced apoptosis in both MOLT-4 (p<0.01) (Fig. 2-9A)
and MOLT-4/DNR cells (p<0.001) (Fig. 2-9B) as compared to the control cells (Figs. 2-8Aa,b, Ba,b). BSO and AA significantly (P<0.001) increased the percentage of apoptotic cells induced by As2O3 in both MOLT-4 (Fig. 2-9A) and MOLT-4/DNR
cells (Figs. 2-9B, 2-8Ac,d, and 2-8Bc,d), whereas NAC markedly decreased the percentage of apoptotic cells induced by As2O3 in both MOLT-4 (p<0.001, Fig. 2-9A)
and MOLT-4/DNR (p<0.01) (Fig. 2-9B) cells (Fig. 2-8Ae, Be). Cells treated with 100 μM BSO, 125 μM AA or 10 mM NAC alone did not show increase in the percentage of apoptotic cells (data not shown).
Fig. 2-8 Typical dot plots showing apoptotic MOLT-4 cells (A) and MOLT-4/DNR cells (B) following incubation for 72 h in the absence (a) or presence of 5 μM As2O3 alone (b)
or with a combination of 5 μM As2O3 and 125μM AA (c), 100
Fig. 2-9 As2O3-induced apoptosis and its modulation by BSO, AA, or NAC in MOLT-4 cells
(A) and MOLT-4/DNR cells (B) treated with 5 μM As2O3 alone or with a combination of 5
μM As2O3 with 125 μM AA, 100 μM BSO, or 10 mM NAC for 72 h. Values are the means ± SD
of three independent experiments. # p<0.01, ## p<0.001 vs control; *p<0.01, **p<0.001 vs As2O3 alone.
BSO and AA potentiated the apoptotic morphology induced by As2O3 in
MOLT-4 (Figs. 2-10Ac, d) and MOLT-4/DNR (Figs. 2-10Bc, d) cells. Whereas, NAC markedly restored a normal morphology to MOLT-4 (Fig. 2-10Ae) and MOLT-4/DNR (Fig. 2-10Be) cells treated with As2O3, in comparison to those treated with As2O3
alone (Fig. 2-10Ab, Bb).
Fig. 2-10 Morphology of MOLT-4 cells (A) and MOLT-4/DNR cells (B) after treatment with 5 μM As2O3 alone or with
combination of 5 μM As2O3 and 100 μM BSO,
28
2.4 DISCUSSION
2.4.1 GSH content had a decisive effect on As2O3-mediated cytotoxicity
The data in Chapter 1 showed that the effects of As2O3 on the growth of
MOLT-4/DNR cells are the same as its effects on parental MOLT-4 cells, and the actions of As2O3 do not influence their P-gp expression or function [44]. The data in
this chapter indicated that the intracellular GSH levels in parental MOLT-4 and MOLT-4/DNR cells are almost the same. A reduction in GSH levels following incubation with BSO and AA enhanced the As2O3-mediated inhibition of cell growth,
disruption of MMP, activation of caspase-3 and apoptosis in MOLT-4 cells and MOLT-4/DNR cells. Whereas, NAC elevated the intracellular GSH levels and protected the cells from the cytotoxicity of As2O3. These observations suggested that
the sensitivity of both MOLT-4 and MOLT-4/DNR cells to As2O3 is closely correlated
with intracellular GSH levels.
GSH is a low molecular weight, non-protein, sulfhydryl compound and its role in the protection of cells from oxidative injury has been documented in a study that demonstrated the enhancement of damage by depletion of cellular GSH [92]. GSH exerts antioxidant effects and it can conjugate with and thereby inactivate molecules that generate free radicals. Trivalent arsenic has been reported to form a complex with GSH, forming a transient As(GS)3 molecule [118], which is easily excreted by the
MRP2/cMOAT transporter [62]. Thus, GSH maintains an optimum cellular redox potential, and depletion, physical efflux from the cell, or intracellular redistribution of GSH are associated with the onset of apoptosis [16].
BSO is a selective inhibitor of γ -glutamylcysteine synthetase, the rate-limiting enzyme in the synthesis of GSH. Cells incubated with BSO are depleted of GSH as a result of the inhibition of enzymatic GSH production [92]. AA has been shown to have pro-oxidant properties [6, 103]. Auto-oxidation of AA to dehydroascorbate results in the production of H2O2 [106, 119]. Dehydroascorbate is
then rapidly reduced back to AA by glutaredoxin in a GSH-dependent manner. This reduction of dehydroascorbate to AA results in a decrease in intracellular GSH [122, 129]. Clinically relevant doses of AA act as oxidizing agents decreasing the GSH content of the cells, and synergizes with the growth-inhibitory and apoptosis-inducing effects of As2O3. This potentiating effect of AA is due to its capacity to undergo
auto-oxidation resulting in the formation of H2O2, which enhances the effects of
As2O3 [31]. Indeed, it has been found that AA significantly synergizes with As2O3 in
treating patients with AML [5]. NAC is an antioxidant since it donates a cysteine to the de novo synthesis of GSH. As2O3 has been reported to bind to vicinal thiol groups
[128], while NAC contains two such thiol groups [31] and gives GSH. Taking these observations into consideration, the decrease in GSH levels following incubation with BSO and AA could abate As2O3 exclusion, thereby causing an intracellular
accumulation of As2O3 and enhancing its cytotoxicity. In contrast, the increase in
intracellular GSH levels following incubation with NAC could enhance As2O3
2.4.2 As2O3-induced apoptosis via depletion of GSH, loss of MMP and activation
of caspase-3
Intracellular GSH depletion results in morphological and functional changes of mitochondria [110]. It has been found that the changes of mitochondria after treatment with As2O3 can be divided into three stages [110]. In the early stage, mitochondria
appear to undergo an adaptive proliferation. In the middle stage, a degenerative change can be observed. In the late stage, the mitochondria swell, and this change is followed by damage to the outer membrane and cell death which exhibits apoptotic changes to the nucleus. Mitochondria are known to play a major role in apoptosis triggered by many stimuli [20]. In the first stage of apoptosis, signal transduction cascades or damage pathways are activated. Subsequently, the mitochondrial membrane function is lost, and then proteins released from mitochondria cause the activation of catabolic proteases and nucleases [106]. Caspases are cysteine proteases that mediate apoptosis by proteolysis of specific substrates [65]. Caspase-3 is considered to be a primary executioner of apoptosis [107]. The data in this Chapter showed that the disruption of MMP and activation of caspase-3 are caused by As2O3,
and are enhanced by AA and BSO, while blocked by NAC, in both MOLT-4 and MOLT-4/DNR cells. The extent of MMP disruption and caspase-3 activation are closely associated with intracellular GSH levels and occur in a time-dependent manner.
Recent reports suggest that sensitivity to As2O3 correlates with intracellular GSH
levels in cancer cells [138]. The GSH content modulates the growth-inhibitory and apoptosis-inducing effects of arsenicals [18, 60, 92, 93, 105]. Cells expressing higher levels of GSH or GSH-associated enzymes are less sensitive to As2O3 than cells
expressing lower levels of these molecules [60, 72]. Arsenic- resistant cells are also reported to contain higher levels of GSH [66, 72, 78]. Moreover, cells with increased GSH levels can be sensitized to As2O3 by agents that deplete intracellular GSH [18,
66]. The cytotoxic effects of As2O3 may be influenced by modulators of GSH [31, 33,
67, 89], especially in drug-resistant cell lines [28, 100].
A decrease in GSH level in cells acts as a potent early activator of apoptosis signaling [3]. Depletion of GSH, especially mitochondrial GSH, is believed to induce the loss of MMP [84]. In my present study, the GSH content significantly decreased in both MOLT-4 (Fig. 2-3A) and MOLT-4/DNR (Fig. 2-3B) cells incubated with BSO and AA for 48 h. As2O3-induced disruption of MMP was markedly enhanced by AA
and BSO in both MOLT-4 (Fig. 2-5A) and MOLT-4/DNR (Fig. 2-5B) cells (Figs. 2-4Ac,d, Bc,d) incubated with BSO and AA for 72 h. The percentage of apoptotic cells induced by As2O3 significantly increased in both MOLT-4 (Fig. 2-9A) and
MOLT-4/DNR cells (Figs. 2-9B, 2-8Ac,d, and 2-8Bc,d ) incubated with BSO and AA for 72 h, Whereas, NAC significantly increased the GSH content, and the As2O3-induced disruption of MMP and apoptosis were blocked by NAC in these cells.
30
mitochondrial activity can be distinguished and monitored by the fluorescent dye Rh123 on flow cytometry [106, 119], which specifically stains mitochondria depending on the MMP [70, 94, 101]. Mitochondrial depolarization precedes caspase-3 activation and apoptosis [107], and apoptotic cells express high caspase-3 activity [56, 147]. Caspase-3 is considered to be a primary executioner of apoptosis [10, 65]. Caspase-3 activation has been causally related to the release of mitochondrial cytochrome c in the cytoplasm as a result of the collapse of the MMP [76].
As2O3 is suggested to act at several points in apoptosis induced through
mitochondrial pathways [19], which includes the forming of reversible bonds with thiol groups [118] and the depletion of GSH [18, 66, 93, 138], loss of MMP [58], and activation of caspase-3 [28, 58, 59, 83, 96]. From these points of view, the apoptosis inducing effect of As2O3 in the presence of GSH modulators in MOLT-4 and
MOLT-4/DNR cells was investigated in this Chapter.
2.5 CONCLUSION
In this chapter, it can be concluded that As2O3 induces apoptosis in MOLT-4 and
MOLT-4/DNR cells via the depletion of intracellular GSH, and subsequent MMP disruption and caspase-3 activation, based on the following observations:
(1) MOLT-4 cells and MOLT-4/DNR cells were similarly sensitive to the apoptosis-inducing effect of As2O3.
(2) BSO and AA rendered these cells more sensitive to As2O3, whereas NAC
reduced this sensitivity.
(3) BSO and AA decreased, but NAC increased, the intracellular GSH contents of both MOLT-4 and MOLT-4/DNR cells.
(4) Decreasing GSH with BSO or AA potentiated As2O3- mediated growth
Chapter 3
Involvement of oxidative stress associated with glutathione depletion and p38 MAPK activation in arsenic disulfide-induced differentiation in HL-60 cells 3.1 INTRODUCTION
As2S2, the most important component of Xiong huang (contains > 90% As2S2
based on the quality standard in Chinese Pharmacopeia in 2010 edition), was a candidate for its good therapeutic reputation and perceived low toxicity, and the drug has become another research focus following As2O3 [131]. As2S2 was found as
effective as As2O3 in clinical trials, with relatively good oral safety profiles even on
chronic administration [131, 49]. These may give As2S2 an advantage over As2O3 in
maintenance treatment.
As2S2-mediated growth inhibition and apoptosis induction have been found in
leukemia K562 cells [73], human ovarian and cervical cancer cells [132], and other cells [120]. However, the effects of As2S2 on HL-60 cells with a particular focus on
proliferation, differentiation, oxidative stress associated with generation of reactive ROS and intracellular GSH depletion, and activation of p38 MAPK have not been addressed.
3.2 MATERIALS AND METHODS 3.2.1Reagents
As2S2, phorbol 12-myristate 13-acetate, nitroblue tetrazolium (NBT),
2’,7’-dichlorofluorescein diacetate (DCFH-DA), and ortho-phthaldialdehyde were purchased from Sigma Aldrich (St. Louis, Mo., USA). SB203580 was purchased from Calbiochem (San Diego, CA, USA). R-PE conjugated anti-human CD11b (Clone D12) and mouse IgG1 isotype control were obtained from DakoCytomation (DakoCytomation Denmark A/S). PE Mouse Anti-p38 MAPK (pT180/pY182) and the AnnexinV-FITC apoptosis detection kit I were obtained from BD PharMingen. Hydrogen peroxide (H2O2) and methanol were purchased from Wako (Wako Pure
Chemical Industries, Ltd, Japan). 10% - Formaldehyde Neutral Bufferwas product of Nacarai Tesque (Japan). As2S2 was dissolved in 1N NaOH, and HCl was used to
adjust the pH to 7.35-7.45. The solution was passed through a 0.20 μm filter (Advantec, Japan), and the stock solution was made by PBS at a concentration of 5mM, which was diluted by PBS to working concentrations before use. DCFH-DA and Rhodamine 123 were dissolved in DMSO at 5 mM and 1 mg/mL, respectively, and stored at -20 °C. The ortho-phthaldialdehyde solution was freshly prepared in methanol at 10 mg/mL before use.
3.2.2 Cell culture
32 incubator.
3.2.3 MTT assay
The leukemia cells were washed and resuspended with the above medium to 5 × 10⁵ cells/mL, and then 196 μl of the cell suspension was placed in each well of a 96-well flat-bottomed plate. To the suspension in each well, 4 μl PBS solution containing As2S2 was added to yield final concentrations of 0.5, 2, 8, and 16μM,
respectively; 4 μl PBS was added to the control wells. The cells were incubated for 48h in an atmosphere containing 5% CO2 at 37 oC in a humidified chamber. After the
incubation period, 20 μl of MTT labeling reagent (final concentration 0.5 mg/mL) was added to each well and the plate was placed on a microshaker for 10s, after which the cells were further incubated for 4 h in a humidified atmosphere. Subsequently, 100 μl of solubilization solution (Roche) was added to each well and the plate was placed on a microshaker for 10s, after which the plate was left overnight in an incubator in a humidified atmosphere. The spectrophotometric absorbance of the samples was measured on a microplate reader (LS-PLATE manager 2001, Japan) at 570 nm. A dose response curve was plotted.
3.2.4 Assessment of cell differentiation
HL-60 cells (1 × 10⁶/mL) were treated with the indicated concentrations of As2S2.
After the indicated incubation times, cells were washed twice by PBS containing 2% FBS and resuspended in 100 μl PBS containing 2% FBS. Then, 10 μl PE-conjugated CD11b antibody was added, and cells were incubated in the dark at 4 °C for 30 min. After the incubation, cells were resuspended in 400 μl PBS containing 1% FNB, and subsequently the cells were analyzed by Becton Dickinson flow cytometry. Isotypic mouse IgG1 was used to set threshold parameters. A total of 30,000 non-gated cells were analyzed. In case of the assessment of synergistic differentiation induced by H2O2 combined with As2S2, cells were pre-incubated with indicated concentration of
H2O2 for 1 h before treatment with As2S2 for 48h. When assessment of effects of
SB203580 on As2S2-induced differentiation, cells were incubated with indicated
concentrations of As2S2 alone or combined with SB203580 for 72h, 0.05% DMSO
was used as control.
The As2S2-induced HL-60 cell differentiation was observed by morphological
changes, which were determined by flow cytometry after treatment of As2S2 for 48h.
Light scattering signal measured in the forward is known as forward scattering (forward scatter, FSC) in flow cytometry analyses, which reflects the size of the cell volume.
The As2S2-induced differentiation of HL-60 cells to neutrophil-like cells was also
assessed by NBT reduction assay [82, 123]. After HL-60 cells (1 × 10⁶/mL) were treated with the indicated concentrations of As2S2 for 72 h, cells were washed by PBS,
were dissolved with 600 μl DMSO. The absorbance was measured at 560 nm.
3.2.5 Apoptosis and viability assays
After HL-60 cells (1 × 10⁶/mL) were treated with the indicated concentrations of As2S2 for the indicated incubation times, the cells were washed twice by cold PBS
(pH 7.2) and resuspended in binding buffer at a density of 1 × 10⁶ cells/mL. Then 1 × 10⁵ cells were stained with 5 μl Annexin V-FITC and 5 μl PI for 15 min at 4 ° C in the dark. Then 400 μl binding buffer was added to each tube, and the cells were analyzed by Becton Dickinson flow cytometry within 1 h of staining. A total of 3 × 10⁴ non-gated cells were analyzed. Cell viability was determined by PI exclusion. Cell apoptosis was identified by positive Annexin V-staining.
3.2.6 Cellular ROS production measurement
Cellular ROS production was measured by flow cytometry using DCFH-DA [36, 40, 63, 123]. Viable cells can deacetylate DCFH-DA to DCFH. The latter is not fluorescent but can react with H2O2 to produce fluorescent DCF. The cytofluorimetric
measurement of DCF provides an index of cellular ROS level [123]. At the end of treatment by As2S2, cells in each well were collected, washed twice in PBS and
incubated in 1 ml PBS containing 10 μM DCFH-DA at 37 °C for 30 min. Cells were then washed in PBS and resuspended in 0.5 ml PBS. The mean fluorescence intensity (MFI) of DCF green fluorescence from 1 × 10⁴ cells was detected by Becton Dickinson flow cytometry. The ROS level in the treated cells against that of the control is represented by relative MFI.
3.2.7 Determination of level of cellular GSH
The temporal change in cellular GSH was evaluated using ortho-phthaldialdehyde [123], which can react with GSH to yield a highly fluorescent product. At the indicated times of cells incubated with As2S2, cells were washed twice
by PBS and then suspended in 900 μl PBS. Then, 100μl of 10 mg/mL ortho-phthaldialdehyde in methanol was added, and cells were incubated at 37 °C for 30 min. After being washed by PBS, cells were resuspended in 500 μl PBS and kept on ice. MFI thus produced from 1 × 10⁴ cells was measured by Becton Dickinson flow cytometry. The levels of cellular GSH were represented by relative MFI.
3.2.8 Analysis for p38 MAPK activation
Activation of p38 MAPK was detected by flow cytometry [81]. Cells (1 × 10⁶/mL) were exposed to different concentrations of As2S2 for indicated times. The