LMOOCs(語学ムーク)の利活用に関する予備研究
-日本の大学生のOERs, MOOCs, およびLMOOCs 認識について-
A Study on OERs, MOOCs, and LMOOCs for University Students:
How Do They Perceive and Use Them?
宮添 輝美
MIYAZOE, Terumi
● 東京電機大学 Tokyo Denki University
オープン教育リソース,ムーク,語学ムーク,デジタル学習,高等教育,研 究法,教育評価,スライダー
OERs, MOOCs, LMOOCs, Digital learning, Higher education, Research method, Educational measurement, Slider question
ABSTRACT
本稿は,語学に特化したMOOC(略称LMOOC:massive open and online courses designed specifically for language learning)を英語カリキュラムに導入するための予備調査の結果を報告する。アンケート調査は 2017年7月に東京を所在地とする大学の単一学部で行い,有効回答数70を得た。対象サンプルは情報 通信技術(ICT)のスキルが高い学習者グループである点に特徴をもつ。データ分析の結果,1)オー プンな教育資源(OER)に関する知識と利用は浸透しているが,MOOCとLMOOCに関する知識・利用 は開発途上にあること,また,2)学生のデジタル学習に対する期待が,従来の学習方法のイメージや 経験により狭まっている可能性を認めた。付随して,本研究ではアンケート調査の質問法にスライダー を採用し,その機能性も検証しているが,3)スライダーには妥当性ある統計処理の可能性が示唆された。
結びに,LMOOCを用いた英語コースの設計に向けて,今後に期待される研究課題と実践研究を考える。
This paper reports on the results of an exploratory survey research regarding the readiness for massive
研 究 論 文 RESEARCH ARTICLE1. Introduction
Massive open and online courses (MOOCs) have long become a critical aspect of our digital learning; however, studies focusing on language MOOCs (LMOOCs) or development of MOOCs designed specifically for language learning have only been conducted in recent years (Bárcena &
Martin-Monje, 2014; Miyazoe, 2017). Accordingly, the current study examines the readiness for digital learning through OERs, MOOCs, and LMOOCs to advance research on and implement digital learning in specific contexts.
To capture the most common feature of this global learning, the term “digital learning” is used in this paper. The term includes various forms of ongoing learning, including PCs, the Internet, as well as other digital devices and systems. Such inclusion is underlined because learning could also take place offline. This choice of term coincides with the MIT’s online learning initiative called,
“Office of Digital Learning (ODL)” (https://odl.
mit.edu/), which shares the same acronym as the older concept of ODL (i.e., open and distance learning).
In the current study, the following research questions will be examined: 1) How do university students in specific fields perceive and use learning opportunities related to OERs and MOOCs? 2) How adaptable are they to LMOOC learning? In
addition, 3) the usability and validity of the relatively new format of collecting data in the online survey, namely, the slider question (as a possible alternative to Likert-type scales) is tested in this paper for further research endeavours.
2. Concepts in a chronology 2.1 OERs, MOOCs, and LMOOCs
Two research surveys and report of large scale executed under the umbrella of the Education, Culture, Sports, Science, and Technology (MEXT) are useful in capturing the grand view on the current state of importation and implementation of ICTs in education in Japan. One of these documents, AXIES (2014) examines the overall state of ICT use and implementation in higher education in Japan and overseas. Despite the availability of a more recent version of the survey (AXIES, 2016), the one in 2014 is referenced here because of its comprehensiveness and volume. Another report (AXIES, 2015) focuses particularly on MOOC use and implementation as compared with the states in other countries leading in these areas.
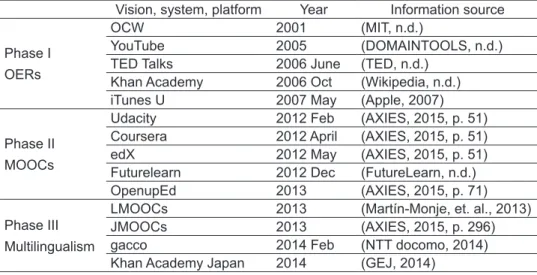
Table 1 is constructed on the basis of the above
documents and other references to provide a
tentative chronology of the concepts, systems, and
platforms that represent the current socio-cultural
transition in the knowledge of our learning. The
table also aims to present the state of LMOOCs in
open and online courses (MOOCs) and those designed specifically for language learning (LMOOCs). The
survey was executed in a single university in the Tokyo area in July 2017 and valid responses from 70
undergraduate students were obtained. The respondents are distinctive in that they presumably have high
information and communications technology skills. The survey reveals the following: 1) the knowledge and
use of open educational resources (OERs) are fairly spread but those of MOOCs and LMOOCs are still
being developed, and 2) the students’ notions of digital learning may have been limited by their previous
traditional views/experiences of learning. As an exploration of the research method, the slider question
format was included in the online survey, which gained a high usability. Potential validity to offset
weaknesses of the convention is likewise observed. The paper also discusses future research and practices to
implement LMOOCs in specific contexts.
the history of digital learning. The years in the table refer to foundation years (and months when available). Reflecting the progressive state of the melting and merging of genres and platforms, the categories and items are not meant to be exclusive and static. TED Talks has existed since 1984 but the date when the first six TED videos were uploaded online in 2006 June (TED, n.d.) is indicated. Given that the aim of the current study relates to LMOOCs for Japanese university students who learn English, those LMOOCs providing courses in English are the initial focus.
Phase I elaborates on the previous concept of open online resources that could be used for education such as open educational resources (OERs); Phase II includes those of more recent and massive types of online resources (MOOCs); Phase III includes those that are more language conscious or multilingual (in the current study, the Japanese version of OERs and MOOCs, and those targeting the language learning per se).
In a comprehensive literature review of related studies that were published during the period of 2012-2017, Miyazoe (2017) tentatively concludes that the concept of LMOOCs appears to have been proposed around 2013 by Martín-Monje, Bárcena,
& Ventura. Despite the abundantly publicized research and practice related to MOOCs, much is left for further exploration on LMOOC research.
Among the few pioneering LMOOC studies, a preliminary survey research by Mehran, Alizadeh, Koguchi, & Takemura (2017) that examines the readiness of online language learning in higher education is introduced in the present study given that it involves university students in Japan, which is likely closer to the one examined in the current study. Mehran et al. also provided a comprehensive literature review on e-learning readiness studies conducted over the period of 2001-2013 (the results can be found in the paper: Table 1: Studies on e-learning readiness for online language learning on page five) and reproduced a survey by Winke &
Goertler (2008); this survey has been used in four prior studies. Both English original and Japanese translated versions are available as appendices in the paper. Mehran et al. conclude that ICT readiness of students is still being developed;
however, in this study, the majority of the questions related to students’ manageability of basic ICT skills (e.g., Q.13 asks if they can “cut, copy, and paste” in their document, and Q. 19 asks them to rate in a four-point Likert scale if they think iPods
Table 1 A chronology of OERs, MOOCs, and LMOOCs
Vision, system, platform Year Information source Phase I
OERs
OCW 2001 (MIT, n.d.)
YouTube 2005 (DOMAINTOOLS, n.d.)
TED Talks 2006 June (TED, n.d.) Khan Academy 2006 Oct (Wikipedia, n.d.)
iTunes U 2007 May (Apple, 2007)
Phase II MOOCs
Udacity 2012 Feb (AXIES, 2015, p. 51) Coursera 2012 April (AXIES, 2015, p. 51)
edX 2012 May (AXIES, 2015, p. 51)
Futurelearn 2012 Dec (FutureLearn, n.d.)
OpenupEd 2013 (AXIES, 2015, p. 71)
Phase III Multilingualism
LMOOCs 2013 (Martín-Monje, et. al., 2013)
JMOOCs 2013 (AXIES, 2015, p. 296)
gacco 2014 Feb (NTT docomo, 2014)
Khan Academy Japan 2014 (GEJ, 2014)
are useful for their language learning). This condition differs considerably from the assumption from students in other contexts and specializations.
Therefore, given the lack of prior research that examines readiness for LMOOC-like learning environments, the present study aims to elaborate questions of its own to explore the readiness of the targeted audiences. The unique aspect of this research is that some of the question items concern essential components of LMOOC courses, not ICT skills for general purposes. Consequently, this research will also identify necessary steps and elements for the incorporation of LMOOC into the design of language courses.
2.2 Online survey, slider question, and QR code This research tested several methods to raise the response rate while ensuring the validity of the obtained data. Online surveys have their own merits over paper survey in several aspects, including protection of anonymity, ease of data handling, accessibility, and cost/time issues (Wright, 2005). In addition, the “mix-mode” of preparing paper and online surveys may also be a feasible option (Greenlaw & Brown-Welty, 2009) because response rates for online surveys are often lower than those of paper surveys (Nulty, 2008).
In the current research, the use of the slider question format is tested as an alternative to the traditional Likert-type scale. The Likert-type scale is a question format that measures attitudes or opinions on a specific topic from a respondent by asking them to choose the best fit among several fixed choices (Likert, 1932; McLeod, 2008). These choices can be three or four without a mid-point to
reduce bias (Garland, 1991), or five, seven, ten, and so on. However, arguments have been made that choice formats cause difficulty in the higher level of statistics handling because it assumes that each choice is allotted evenly by the respondents, such as 0-50-100 (three), 0-33.3-66.9-100 (four), 0-25-50-75-100 (five), 0-14.3-28.6-42.6-57.1- 71.4-85.7-100 (seven), 0-10-20-30-40-50-60- 70-80-90-100 (ten). In addition to these issues, in a comparative study involving different languages, minor differences in the connotation of question sentences at linguistic levels could be another factor of inferring bias. Consequently, opinions are divided on the extent to which respondents could reply in some formats (Norman, 2010; Jamieson, 2004). To address this research dilemma, the usability and functionality of the “slider bar” (see, Figure 1), which allows respondents to decide their agreement level in integers from 0-100 (the numeric whose notion is shared widely beyond the difference of languages) is also tested.
Finally, to raise the response rate of the online survey format, this paper uses a quick response code (QR code) (Christensson, 2015) to assess its possible effects on the survey response rate.
3. Methodology 3.1 Method
The survey method was used to collect basic information that may be useful in the development of language curricula/courses using MOOCs and LMOOCs. An online survey was conducted using the online research service Survey Monkey (https://
www.surveymonkey.com/).
Figure 1 Response format of 0-100 slider bar in integer
3.2 Data collection
Two methods, namely, online and paper surveys were prepared to raise the response rate. The survey participation call was made in three English classes, all belonging to a single department (Faculty of Information and Environment), on a day in July 2017 toward the end of the semester. Printed copies of the survey were distributed to seek cooperation on which the following were printed: the typed-out URL for the online survey, the QR code graphics (these graphics can be created on a website offering free services for this purpose), and the estimated response time. Notably, the students could opt out without the knowledge of the researcher. Moreover, the researcher announced the invitation with the paper version in class to accommodate the students’
preferences.
3.3 The survey
The survey consists of the following five sections (Appendix): demographics (Qs.1-3), knowledge and use of OERs, MOOCs, and others (Qs. 4-5);
readiness for MOOC-like online learning environments (Qs. 6-11); preferences of digital devices for language learning (Qs. 12-15); and preferences of learning styles (Qs. 16-17), with free comment spaces on digital learning in general (Q. 18).
Each section is devised with a different focus.
Questions 4-5 are devised based on the literature review above. In the survey, the items are placed randomly to raise the accuracy in the response.
Questions 6-11 consist of reading information on the screen, discussions (or interaction with peers), and watching video lectures, in general and in English separately to determine the students’
readiness for MOOC-like learning environments:
these three components are selected as essential and common components in reference to the study by Sokolik (2014). Questions 12-15 are devised to ask what English skills the students wish to develop
in general and with digital devices, as well as which digital device is most preferred in each situation: these questions thus determine if the kind of digital device has an effect on their adaptability to an MOOC-like learning environment. Finally, Questions 16-17 are devised to gain insights through their preferred learning styles in general and for language learning. Question 18 is provided to solicit free comments regarding digital learning in general.
The layout of survey is planned deliberately.
Questions 1-5, 6-11, 12-15, and 16-18 are placed on separate pages to minimize possible interference in the response among sections. Nonetheless, the respondent could review all the questions before submission if necessary. When accessing the survey from a mobile phone, the page layout would be smaller and would have a different look. For gender Question 2 and for Questions 16-17, the alternative choice formats (e.g., male versus female, face-to- face versus online, and paper versus digital material) are avoided intentionally. Moreover, the slider format (Figure 1) is used for Questions 6-11.
In the online survey, the respondent can provide their agreement level in integers from 0 (unwilling to do) to 100 (willing to do) by moving the scale from left to right. The slider format on Survey Monkey.com was launched in July 15, 2016 (Survey Monkey Audience, personal communication, August 12, 2017); that is, this exploratory research will provide novel insight. In the current research, the
“numbered format” that provides the selected number in the rightmost square is chosen to make the testing of the effect of the slider bar more distinctive. For the paper version, the respondent would have to write down an integer number by hand.
The functionality and appearance of the online
survey, the sliders, and the QR code, both via a PC
browser and a mobile phone, were checked before
the implementation.
3.4 The samples
As noted above, the respondents’ ICT knowledge and skills are presumably higher than usual, considering the school’s requirement that students have a PC of their own as well as with the wireless environment on campus and given their areas of study. In addition, approximately half of the respondents are required by the curriculum to have some experiences in learning via a tablet during their freshman year in their English language classes. Moreover, nearly all carry one (or occasionally two) mobile phone (s), with operating systems such as iOS and Android to check the functionality of the programs they are writing for their areas of study.
All the respondents were taking English courses with specific purposes (basic academic writing and research basics for scientists). The information on the course texts on Common European Framework of Reference for Languages (CEFR) B1-B2 provides an estimation regarding their English proficiency.
3.5 Analysis
All data are coded onto MS Excel and SPSS from online (automatic import data) and paper (manual transcription) versions of the survey and analyzed.
3.6 Ethical issues
The online survey was designed to be anonymous and involved free participation. This survey was irrelevant to the course performance evaluation of the participants. Prior consultation confirmed that the survey method was approved by the school’s research ethics committee (https://www.dendai.
ac.jp/crc/kenkyu/provisions/), presuming that it does not directly harm human bodies.
4. Results 4.1 Demographics
Among the 92 registered students, 71 participated in the study. Failure to complete all question items for some reason narrowed down the number to 70 for the final analysis. A total of 65 respondents answered the questions online, and 5 used the paper version. Among the 70 samples, with the default setting in the online survey preventing the respondents from skipping questions (except the one regarding gender), the collected data were complete without missing values or inconsistency.
This allows for the assumption that the total valid response is 70 for all questions.
Figure 2 summarizes the demographic information.
The majority of the respondents were sophomores and juniors, with a significantly high ratio of approximately 80% male; the majority of approximately 80% have computer-related specializations. With lesbian, gay, bisexual, and transgender (LGBT) sensitivity in education, the gender question is not forced but provides the third choice with free comment space;
this set up resulted in one respondent adding comments of his “being male biologically,” but is
“bisexual in reality.”
4.2 Knowledge and use of OERs, MOOCs, and others
Figure 3 summarizes the results of Questions 4-5
to consider the extent of the respondents’ knowledge
and usage of OERs, MOOCs, and other digital
materials. Table 1, which presents the chronology
of digital learning, is meant to correspond to Figure
3: the graph is laid out in chronological order by
approximate date of foundation, with the assumption
that the older materials would be possibly
acknowledged and used more than the newer ones
by the survey respondents. The terms OERs,
MOOCs, JMOOCs, and LMOOCs without specific
foundation dates are placed after the items in each
phase because these terms are likely born as a summative expression of each phase as social phenomena. Light and dark gray express the use and the knowledge, respectively, of each concept of digital systems and platforms. Whether the
respondents perceive each digital information carrier (e.g., iTunes and YouTube) differently or chronologically is unclear only from these data, especially when we jump seamlessly from concept to the other(s) by one click. However, it seems that
Year Major Gender
Figure 2 Demographic information of the respondents (Qs. 1-3) N = 70
2
70 14
2
28 3
2 1
5 2
3 1
2 2 4 2 0
0 10 20 30 40 50 60 70
OCW YouTube TED Talks Khan Academy iTunes U OERs Udacity Coursera edX Futurelearn OpenupEd MOOCs Khan Academy Japan JMOOCs gacco LMOOCs
None
use know
Systems and Plaorms
Person
Figure 3 Knowledge and use of OERs, MOOCs, and others (Qs. 4–5) N = 70the students in this context appear to be adequately familiar with the use of digital resources in Phase I but have failed to acknowledge and use the more recent resources as clear entities (e.g., OERs and MOOCs in Phase II, even less LMOOCs for their learning in Phase III).
4.3 Readiness for MOOC-like online learning environments
Table 2 summarizes the results of students’
willingness to use digital devices for the three key components of MOOC-like learning environments in the comparison between learning in general versus learning English/learning in English. A paired-sample t-test and correlation are also applied to determine whether the difference in each pair is statistically significant.
Overall, the average scores do not show strong willingness or unwillingness toward any of the three components. Nonetheless, the students appeared to be more inclined toward digital reading and video lectures, which could be more passive activities for learning than digital discussion, with the latter expected to demand a more active engagement. Moreover, they do not appear to be heavily discouraged when the linguistic tool becomes English. Even though all three pairs show statistically high correlations: Pair 1 (r = 0.833, n = 70, p < 0.0001); Pair 2 (r = 0.826, n = 70, p <
0.0001); and Pair 3 (r = 0.802, n = 70, p < 0.0001), the t-test shows that only the means of Pairs 1 and
2 are statistically significant. The high correlation suggests that their positivity/negativity to each activity might be inferred from/affected by their previous experiences in their native language(s).
To determine how the 0-100 slider worked, numerical data are classified tentatively into the following categories: responses by 10 increments, 5 increments, and 1 increment. For example, responses to numbers 0, 10, 20, 100, and so on, are coded into a 10-increment category; 35, 55, 65, and so on, are coded into 5 increments; and 91, 76, 33, and so on, are coded into 1 increment. The five samples (even if they are small) answered using the paper version of the survey are analyzed separately.
Table 3 shows the distribution of the three increment categories in the frequency made by responses through the online (N = 65) and paper versions (N = 5) of the survey. Figure 4 shows the graphic representation of the responses in percentage of the online version responses. The responses in the paper version were not converted into percentage but shown as frequency because of the small sample size. Although the respondents were asked to answer their engagement level in a 0 -100 integer scaling, 60% adjusted their perceptions to be reasonably 10 increments;
whereas approximately 25% of them chose the 1 increment policy. Thus, in this exploration, 0-100 integer scaling could extract a finer level of perception from respondents than the traditional Liker-type scaling. Moreover, despite the extremely
Table 2 Readiness for MOOC-like online learning environments (Qs. 6–11) N = 70
M N SD Mse
Pair 1 (Qs. 6 & 7)
Q.6 Screen reading 67.80 70 26.141 3.124
Q.7 Screen reading English 61.23 70 28.540 3.411 Pair 2
(Qs. 8 & 9)
Q.8 Digital discussion 45.99 70 32.482 3.882
Q.9 Digital discussion in English 40.77 70 32.805 3.921 Pair 3
(Qs. 10 & 11)
Q.10 Video lectures 65.53 70 29.439 3.519
Q.11 Video lectures in English 61.83 70 32.735 3.913
small sample size, the paper version of the survey yielded 5 or 10 increments only as their natural perceptions. The percentages of each increment category are somewhat stabilized in the latter half of the survey, with six consecutive questions.
Although this finding shall be examined further with significantly larger samples, once the respondents decide their policy of perception measurements of their own after a few trials, they appeared to use the same policy for the rest of the questions.
4.4 Preferences of digital devices for language learning
Figure 5 summarizes the preferences of skills when learning English through a comparison
between general situations and using digital devices. In this survey, the students appeared to be most interested in developing their speaking skills further, followed by listening, reading, and writing.
However, when a specific digital device is involved, the order changes to listening as their first preference, followed by speaking, reading, and writing. The explanation for the change in the preference from speaking to listening when a certain digital device is used is unclear only from this survey result. The researcher presumes that the respondents could possibly have a vague idea of how they could develop speaking as an active skill if not guided at this time of research. Notably, although the “none of them” choice is also
Table 3 Response distribution in frequency by integer scaling 0–100 for Qs. 6–11 N = 70
Q.6 Q.7 Q.8 Q.9 Q.10 Q.11
Online
1 15 16 17 18 18 17
5 10 14 6 5 6 8
10 40 35 42 42 41 40
Paper
1 0 0 0 0 0 0
5 1 1 0 0 0 0
10 4 4 5 5 5 5
Q.6 Q.7 Q.8 Q.9 Q.10 Q.11
61.5 53.8 64.6 64.6 63.1 61.5
15.4 21.5 9.2 7.7 9.2 12.3
23.1 24.6 26.2 27.7 27.7 26.2
10 5 1 0.0 10.0 20.0 30.0 40.0 50.0 60.0 70.0 80.0 90.0 100.0
23.1 24.6 26.2 27.7 27.7 26.2
15.4 21.5 9.2 7.7 9.2 12.3
61.5 64.6 64.6 63.1 61.5
tn ecr eP ni noi tu birt si D
Ques�ons
Figure 4 Response distribution in percentage of online survey by integer scaling 0–100 for Qs. 6–11
provided, only one or two students chose this option, thereby indicating that they hope to deepen their skills in English.
Figure 6 summarizes the comparison of preferred digital devices in general situations and when learning English. The preference order of the use of digital device is the same for both; PCs are at the top, followed by tablets and smart phones. Although the percentages for the use of tablets and smart
phones for learning in general and learning English are the same (47.1% and 38.6%, respectively), the concordance rates of respondents who provide positive answers for both in the entire sample are 57.1% for PCs, 38.6% for tablets, 32.9% for smart phones, and 5.7% for none of them each; in other words, the percentages of 47.1% and 38.6% are incidentally the same, without any errors in the data handling or inattentive responses. In addition,
0.010.0 20.0 30.0 40.0 50.0 60.0 70.0 80.0 90.0 100.0
Percen t
57.175.7
85.7
42.9
1.4 48.6
65.7 58.6
25.7
2.9
Reading Listening Speaking Wri�ng None of
them
in general 57.1 75.7 85.7 42.9 1.4
with digital device 48.6 65.7 58.6 25.7 2.9
Skills
Figure 5 Preferences of skills in learning English (Qs. 12–13) N = 70
0.0 10.0 20.0 30.0 40.0 50.0 60.0 70.0 80.0 90.0 100.0
Percen t
65.7
47.1
38.6
11.4 62.9
47.1
38.6
8.6
PC tablet smart phones none
general 65.7 47.1 38.6 11.4
English 62.9 47.1 38.6 8.6
Digital devices
Figure 6 Preferred digital devices for learning (Qs. 14–15) N = 70
approximately 10% (11.4% and 8.6%, respectively) of students chose the option, “none of them”, that is, they do not wish to use digital devices for their learning whatever the learning objects. Further insights will be made by combining these results with their responses to Questions 16-17 regarding their preferred learning styles.
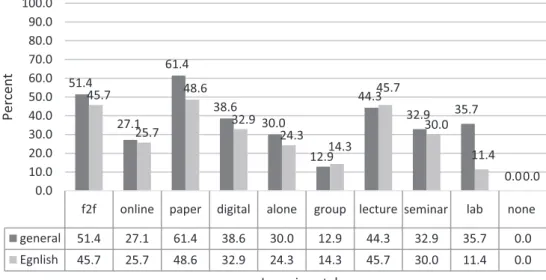
4.5 Preferences of learning styles and free comments
Figure 7 summarizes the results of the learning preference in Questions 16-17 and shows a comparison of learning in general and learning English. The results indicate that for learning in general and learning English, the respondents preferred face-to-face, paper-based, alone, and lecture-type. For the laboratory course structure, a low rating for learning English is natural given that they have laboratory-type courses in the science fields; specifically, the combination of laboratory and language learning could be counter-intuitive.
Figure 8 shows the effect of avoiding possible dichotomy, such as face-to-face versus online, paper versus digital, and so on. The distribution of four patterns, namely, both (11), either of the two
(01 and 10), and no preference (00), is calculated because logically, these four patterns should be inclusive. The most intriguing finding is that when they are given the preference (not as one or the other alternative but as a preferred choice), approximately 20% of students choose “both modes” (e.g., face-to-face and online, paper and digital, etc.) as their preferred learning styles. In addition, 40%-50% opted not to choose any, that is, “no preference,” which could be interpreted as either option is also acceptable.
Finally, seven students left comments in Question 18, specifically on digital learning. Four respondents referred to the positive aspect of digitals, such as repetitive review possibility of videos, introduction of virtual reality, instant feedback, and off-line portability. Three respondents referred to the negative side, such as learning support that could only be obtained with humans, teacher’s guidance, and difficulty in memorizing spelling.
5. Discussion
5.1 Summary of the findings
The following answers address the research
0.0 10.0 20.0 30.0 40.0 50.0 60.0 70.0 80.0 90.0 100.0
Percen t 51.4
27.1 61.4
38.6 30.0
12.9 44.3
32.9 35.7
0.0 45.7
25.7 48.6
32.9 24.3 14.3
45.7 30.0
11.4 0.0 f2f online paper digital alone group lecture seminar lab none general 51.4 27.1 61.4 38.6 30.0 12.9 44.3 32.9 35.7 0.0 Egnlish 45.7 25.7 48.6 32.9 24.3 14.3 45.7 30.0 11.4 0.0
Learning styles
Figure 7 Preferred learning styles (Qs. 16–17) N = 70
questions in this paper: 1) the knowledge and use of OERs are fairly shared, but those of MOOCs and LMOOCs are still being developed; 2) the students’ notions of digital learning may have been limited by their traditional views/experiences of learning, and 3) a high usability and potential to offset weaknesses of the convention are observed when the slider is used.
5.2 LMOOC design elements
At this stage, the survey results show that the students’ knowledge and use of MOOCs and LMOOCs are not high (Figure 3). Given their specialization in ICT fields, their unpreparedness for the knowledge of Phases II and III are unexpected. One possible assumption for this result is that high ICT skills and their use for learning belong to two different dimensions. The former, however, is a prerequisite for the latter. If it is, the traditional approach to examine readiness using certain tools would provide insufficient help. In short, use could induce knowledge, and vice versa.
If instructed, students would attempt to understand the usefulness and functionality of certain digital materials, even if they require technically high ICT skills. Thus, the simple incorporation of recent
digital learning objects may be enough without waiting for ICT skills to catch up with the necessity.
As for the three components of the interactive type of MOOCs, the students appeared to be more inclined toward the implementation of screen reading and video lectures. They were slightly less willing to digital discussion, regardless of learning objectives (Table 2). This finding could indicate that despite the students’ lack of experience in MOOC merged courses/curricula and were uncertain about its implementation, they were adequately prepared to test it as a part-by-part learning experience.
More interesting is the fact that if they are learning English, they wish to develop speaking the most in general. For some reason however, listening is the most preferred with digital devices (Figure 5), whereas a PC was most preferred when learning (Figure 6). Combined with the above observation, once they gain experience in interacting with others (regardless of the language and possibly synchronously and/or asynchronously), their willingness to use a digital device to develop their productive skills (i.e., speaking and writing) may become more positive. As mentioned above, if their f2f/digital paper/digital alone/group lecture/seminar 34.3%
f2f
15.7%
both
35.7%
paper
25.7%
both
28.6%
alone
1.4%
both
21.4%
lecture
22.9%
both 38.6%
no pref.
10.0%
digital
25.7%
no pref.
12.9%
digital
58.6%
no pref.
11.4%
group
45.7%
no pref.
10.0%
seminar 37.1%
f2f
8.6%
both
28.6%
paper
20.0%
both
22.9%
alone
1.4%
both
24.3%
lecture
21.4%
both 37.1%
no pref.
17.1%
digital
37.1%
no pref.
14.3%
digital
62.9%
no pref.
12.9%
group
45.7%
no pref.
8.6%
seminar
Figure 8 Distribution of preferred learning styles (Qs. 16–17) N = 70GeneralEnglish