Study on Data Warehouse System for Supporting Decision Making in the Higher Education
Institution (HEI) in Indonesia
著者 アルディアン アグン ユリアント
著者別表示 ARDHIAN AGUNG YULIANTO journal or
publication title
博士論文本文Full 学位授与番号 13301甲第1921号
学位名 博士(工学)
学位授与年月日 2020‑09‑28
URL http://hdl.handle.net/2297/00061341
doi: https://doi.org/10.14569/IJACSA.2020.0110666
Creative Commons : 表示 ‑ 非営利 ‑ 改変禁止 http://creativecommons.org/licenses/by‑nc‑nd/3.0/deed.ja
DISSERTATION
Study on Data Warehouse System for Supporting Decision Making in the Higher Education Institution (HEI) in
Indonesia
Graduate School of
Natural Science & Technology Kanazawa University
Division of Electrical Engineering and Computer Science
Student ID No. 1624042007
Name Ardhian Agung Yulianto Chief Supervisor Yoshiya Kasahara
Date June , 2020
ii PREFACE
Higher education has been played an important role in “The 2030 United Nations Agenda for Sustainable Development Goals (SDGs)” for the quality of education and supporting the future of one nation. The Organization for Economic Co-operation and Development (OECD) 2019 Indicators reported the wide disparity among countries in the average tuition fees charged by public institutions for national students in undergraduate programs. We also found data for that the higher education institutions (HEI) become more dependent on student-based income for their establishment. HEI leaders face many challenges in transforming their institution from traditional shared governance toward twenty-first-century values of transparency on financial and decision making.
In this study, we developed a data warehouse (DW) system to provide sufficient information to the higher education institutions’s (HEI’s) administrators in Indonesia for decision making in the admission processes. The system managed the tuition fees level of applicants by faculty and education cost analysis between collected tuition fees by level and the standard education cost. The system was developed by integrating multisource data to become a single repository following the annual regulation issued by the government. A simple but sufficient method was introduced using the open-source following the business requirements of HEI’s administrator. As a business intelligence (BI) approach, four procedures are applied e.g., preparation, integration, analysis, and visualization to construct a tuition fee level management system and educational cost performance indicator. Analysis results were presented in various charts, graphics, and dashboard of tuition fee level, which has many functions to provide insight relative to the business performance. The DW system described in this study can be used as a guideline for HEIs in Indonesia for tuition-fee-level management and educational cost analysis from the tuition fee.
iii
TABLE OF CONTENTS
CHAPTER 1 ... 1
INTRODUCTION ... 1
1.1 BACKGROUND ... 1
1.2 PROBLEMS ... 3
1.3 INTEGRATED ACADEMIC FEE (IAF)POLICY IN INDONESIA. ... 4
1.4 DATA WAREHOUSE SYSTEM ... 6
1.5 PURPOSE OF THE PRESENT WORK ... 7
1.6 DISSERTATION ORGANIZATION ... 8
CHAPTER 2 ... 9
METHODOLOGY ... 9
2.1THREE-TIER APPROACH ... 9
2.2FIVE-STEPS DW IMPLEMENTATION IN EDUCATION ... 10
2.3FOUR PROPOSED PROCEDURES ... 11
2. 3.1 Preparation ... 11
2. 3.2 Integration ... 12
2.3.3 Analytics ... 12
2.3.4 Visualization ... 12
CHAPTER 3 ... 14
DATA WAREHOUSE SYSTEM FOR MULTIDIMENSIONAL ANALYSIS OF TUITION FEE LEVEL IN A PUBLIC HEI IN INDONESIA ... 14
3.1INTRODUCTION ... 14
3.2OVERVIEW OF CURRENT SYSTEM ... 15
3.3SYSTEM DEVELOPMENT ... 16
3.3.1 Preparation ... 16
A. Data and tools specifications. ... 16
B. Information requirements and sources analysis. ... 16
C. Improvement system ... 19
D. System configuration ... 20
3.3.2 Integration ... 21
A. DW Schema ... 21
B. Functionality in integration process ... 24
3.3.3 Analysis of tuition fee level ... 27
3.3.4 Visualization ... 29
iv
A. Charts and graphics ... 29
B. Dashboard ... 29
C. Dashboard Functionality ... 29
3.4 Result ... 30
3.4.1 Tuition Fee Level Trends ... 31
3.4.2 Top Five Faculty by Applicants ... 31
3.4.3 Fees Collected From The Students Trends ... 31
3.5 Software, Operating System, and application ... 32
3.6 Summary ... 32
CHAPTER 4 ... 33
MULTIDIMENSIONAL ANALYSIS OF A PUBLIC HEI ADMISSION IN INDONESIA ... 33
4.1INTRODUCTION ... 33
4.2INFORMATION REQUIREMENTS AND SOURCES ANALYSIS ... 35
4.3DATA SOURCE ANALYSIS ... 36
4.4DWSCHEMA ... 36
4.5ANALYSIS OF ADMISSION ... 37
A. New entrant analysis by entrant type ... 37
B. Analysis of student-based income ... 38
4.6DISCUSSION ... 39
CHAPTER 5 ... 41
CONCLUDING REMARKS ... 41
ACKNOWLEDGMENT ... 43
BIBLIOGRAPHY ... 45
v
LIST OF FIGURES
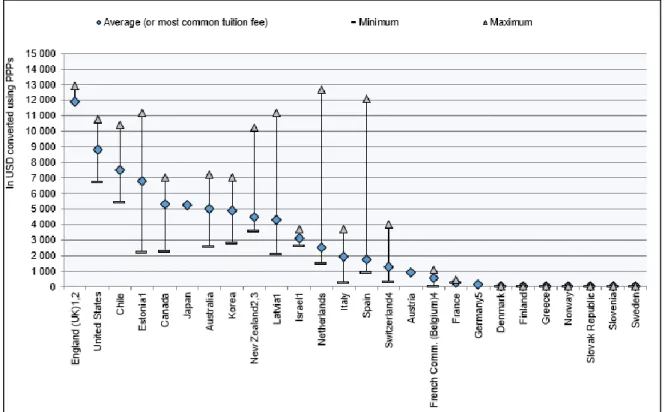
Figure 1- 1: Minimum, maximum, and average (or most common) annual tuition fee charged by
public institutions for national students at bachelor’s or equivalent level (2017/2018) ... 2
Figure 1- 2: The scheme of Integrated Academic Fee (IAF) Policy in Indonesia ... 5
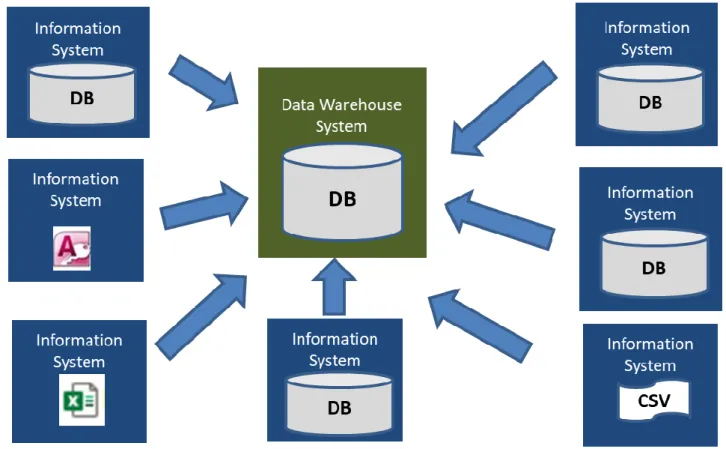
Figure 1- 3: The simple scheme of data warehouse system ... 6
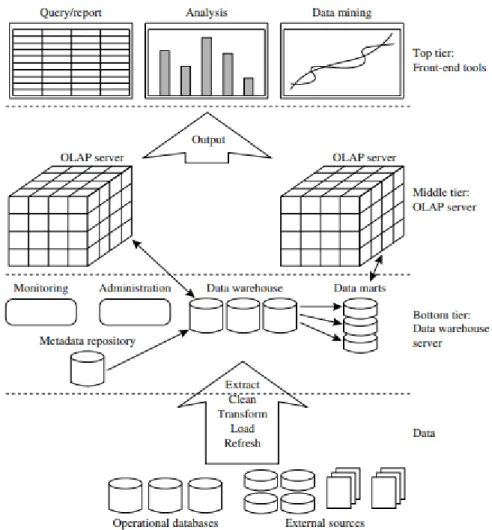
Figure 2- 1: A three-tier data warehousing architecture ... 9
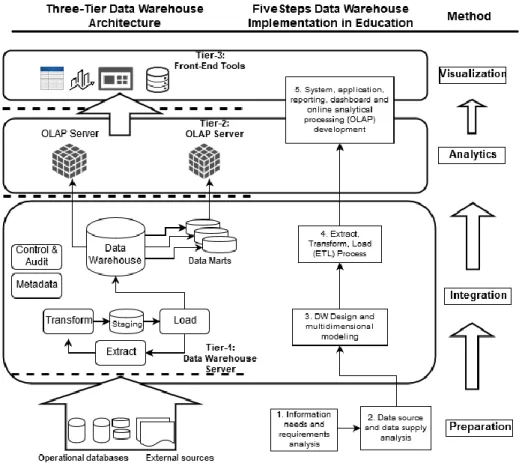
Figure 2- 2: Proposed method ... 11
Figure 3- 1: Overview of existing system ... 15
Figure 3- 2: Multi-valued attribute design of faculty dimension ... 19
Figure 3- 3: System Configuration Diagram ... 21
Figure 3- 4: Denormalized multidimensional facts constellation schema ... 23
Figure 3- 5: Staging process for faculty dimension table (a) and Loading process from staging to faculty dimension table (b) in using Pentaho Data Integration (PDI) tool. ... 26
Figure 3- 6: Pre fact table payment look up process (a) and loading process from pre fact table payment to fact table payment (b). ... 26
Figure 3- 7: OLAP cube of tuition fee level ... 27
Figure 3- 8: Dashboard for tuition fee level management ... 30
Figure 4- 1: Structure of the study ... 33
Figure 4- 2: Flow of admission system in IAF Policy ... 35
Figure 4- 3: Data Warehouse for Admission ... 36
Figure 4- 4: DW Schema ... 37
Figure 4- 5: Analysis of new entrant by entrant type ... 38
Figure 4- 6: Analysis of student-based income on 2018 ... 39
Figure 5- 1: Four Institutional Research Category ... 41
vi
LIST OF TABLES
Table 1: Data Source Analysis ... 18
Table 2. Results of ETL Processes ... 25
Table 3. Pivoted Tuition-fee-level data ... 28
Table 4. Software and application ... 32
1
Chapter 1 Introduction 1.1 Background
Since 2016, the United Nations have initiated “The 2030 Agenda for Sustainable Development Goals (SDGs)” as the shared vision of humanity and put the goal 4 of 17 goals in quality of education. Classified as tertiary education, higher education (HE) has been an important role in this program. Higher Education Institutions (HEIs) work together with the society through educating students, publicize their research activities to the broader community, and contribute to the development of civil society. The establishment of the HEIs and all aspects of their quality must be continue supported for the future of one nation.
In general, HEI from how they are funded consist of two types: public and private institutions.
The government mainly finances the public HEI or a state university in the USA or called the national university in Japan. Every country has a different policy in applying tuition fees in public institutions for the bachelor’s or equivalent level programs. The Organization for Economic Co-operation and Development (OECD) 2019 Indicators reported the wide disparity among countries in the average tuition fees charged by public institutions for national students in undergraduate programs. In Nordic countries (Finland, Iceland, Norway, Denmark, and Sweden), Germany, and Poland, there is no tuition fee charged for the national student. In contrary, annual average tuition fees reach more than USD 5,000 in Korea, Japan, Chile, the United States, and the United Kingdom is the highest at USD 11,866. The private HEIs are operated principally by their endowment funds and students’ tuition fee.
2
Figure 1- 1: Minimum, maximum, and average (or most common) annual tuition fee charged by public institutions for national students at bachelor’s or equivalent level (2017/2018)
Tuition fees have been taking an important role in HEIs establishment. Reported by Higher Education Statistics Agency (HESA), in England during 2016/2017 tuition fees represented 52.2% of total income. In the US, thirty-two states are above national average student share of 46.4%, while other twenty-seven states are above a 50% student share. It means that public institutions are more dependent on tuition revenue than educational appropriations in over half of all states (SHEEO 2018). In Japan, in 2018, the data from Kanazawa University and Hokkaido University, two national universities receive the income from tuition fee around 9-11 % from total budget. The similar data obtained from Andalas University, an Indonesia’s public university, in 2016 around 20% of educational cost taken from tuition fee.
3
The leaders of HEI face many challenges in transforming their institution from traditional shared governance toward twenty-first-century values of transparency on financial and decision making.
Many HEIs today are often left in making financial decisions, discussion on the cost of instructional delivery, the components of cost, and the cost of the resources include on revenues earned and the margins generated. The new approaches of Massy (2016) in reengineering the HEI management by applying economic principles: centered on institutional mission, smart in current market condition, and margin consciousness. Essentially, he proposed the activity-based cost analysis, networks leaders of across stakeholder groups (faculty, administrators, and others), and computer-based academic outcome measurement.
1.2 Problems
In Indonesia, the implementation of the Integrated Academic Fee (IAF) policy should be more complicated since there are three levels of HEIs related to institution management. The university autonomy has been seen as the highest status for a public university in Indonesia, as the university receives a higher degree of freedom in managing its institution. The second level of class is ‘public service institution’ that receives autonomy in financial management, and then the third level is ‘operational unit’ that operates entirely under the Ministry of Research, Technology, and Higher Education (MRTHE) (Coates et.al 2017).
The Indonesia government encourages public HEIs to be autonomous for self-managing capacity in terms of financial and academic management. But it is still required to base its activities on the government’s regulations and make a regular report to the MRTHE. The leaders of HEI face many challenges in managing disparity of tuition fees and its recapitulation.
Another problem arises from the fact that the functions of many information systems in HEI work independently. For example, the student registration information system has its own function for keeping only student payment records and registration. The teaching information systems main functions is servicing for course selection and grading. Moreover, the learning management system has different function with tuition-fee-level decision system. Some
4
important data such as study program ID is represented in different data in different current information systems.
The need for providing historical and analytics data in an integration data without interrupting existing operational system is increased by HEI administrator. Time consuming to generate reports manually. It has happened many times, the different reports are submitted by university and faculty staff regarding data, i.e., the number of applicants and tuition fee collected at each tuition fee level.
1.3 Integrated Academic Fee (IAF) Policy in Indonesia.
Under the Law on Higher Education 12/2012, higher education must set reasonable fees according to the financial qualifications of the students, their parents, or guardians. The IAF (or Uang Kuliah Tunggal) is the current admission policy for undergraduate students in public HEIs in Indonesia. Here, integrated means the students pay a fixed amount for education expenses each semester rather than several unit costs, e.g., development cost, number of credit units, and laboratory costs. The fixed tuition fee is derived from the calculation of all education costs in a year for a given study program. An annual regulation of the Ministry of Research and The Higher Education (MRTHE) is issued for the exact number of tuition fee levels at each HEI across the country. In addition to this regulation, the amount of money following on each tuition fee level for a given study program at each HEI was also provided.
Started from 2013, the IAF Policy was also to provide more opportunities to qualified citizens from low-income families. This policy implemented variable tuition fees for undergraduate students based on the financial ability of their parents or guardians. To determine the level of tuition fees, HEIs are permitted to formulate parameters, e.g., family information (number of family members and number of children in college), income information (parent income), asset information (home or real estate equity), and monthly family expenses are commonly applied as general parameters. In addition, some technique and methods to determine tuition fee level have been presented previously (Utomo et.al, 2017; Karim et.al, 2017).
5
The IAF policy determines tuition fees for only two regulars of all three programs in undergraduate entrant type: SNMPTN, and SBMPTN. SNMPTN is national selection based on high school academic reports, national exam scores, and another academic achievement, e.g., finalist at reputable science/sports/arts competitions, to rank qualified applicants relative to their HEI and study program of choice. SBMPTN is a second round of entrance by examination.
Applicants who pass the tests of these regular entrance types must undertake a decision system to get their tuition fee level. The final round of HEI entrance is an independent program, which is automatically set to the highest tuition fee level for each study program
Figure 1- 2: The scheme of Integrated Academic Fee (IAF) Policy in Indonesia
The IAF policy targets 122 HEIs and 6725 study programs [2]. The IAF policy also covers public HEIs managed by the MRTHE and other ministries, e.g., 58 HEIs are managed by the Ministry of Religious Affairs. The number of designated HEIs typically increases each year following government regulation to take over private HEIs and by extending the scope of HEIs under other ministries. After six years of IAP policy implementation, the national gross enrollment ratio (GER) increased from 29.15% (2014) to 34.58% (2018) [2]. The GER is a measure that compares the number of undergraduate students (diploma and bachelor) with the population aged 19–23 years.
6
1.4 Data Warehouse System
Inmon (1997) defines a data warehouse as “an integrated data collection, subject-oriented, time- variant and non-volatile, used to support the decision-making processes”. A data warehouse (DW) system is considered the backbone tool of a decision support system (DSS). The DW system consolidates various data sources from many transactional systems or files, and then stores them in an integrate information data store. The DW system also maintains historical data and provides analytical functionality to realize the users about the situation of their business (Golfarelli and Rizzi 2017).
In addition, DW systems are considered a core component of business intelligence (BI), which is a general term that describes the analysis of information to improve and optimize business decisions and performance. The term DW/BI introduced by Kimball and Rose (2016) to reflect the shift of emphasis from the DW being an end itself to BI.
Figure 1- 3: The simple scheme of data warehouse system
7
Moscoso-Zea et.al (2018) surveyed the development of DW/BI in the education sector is very limited compared to other major sectors, e.g., financial services and the medical industry.
Wierschem et al. confirmed that many areas in the academic institution (e.g., enrollment data, course data, and alumni data) could identify data warehousing efforts and Guan et al. described the importance of maintaining institutional strategy that accepts information systems as critical to decision making. The first development of a DW in an HEI was reported at Arizona State University in 1992 (Porter and Rome, 1995). In many research noted DW/BI in HEI has primarily been implemented in didactics and research fields (i.e., Tria et.al, 2015; Aljawarneh, 2016; Scholtz et.al, 2018).
In development of data warehouse, there are two dominant approaches: Kimball Bus Architecture by Ralp Kimball that introduced business processes was built in dimensional model corresponding to business measurement, and Corporate Information Factory (CIF) by Inmon proposed a data mart that related to business department in organization. This study adapt the dimensional model approach that present an integrated and consistent environment making data is easier to understand by user, having a less complex queries and the result will be significantly quicker (Kimbal 2016).
1.5 Purpose of the Present Work
This study focuses on multidimensional analytics of the HEI tuition fee level in Indonesia under the IAF policy. Multidimensionally modeled data were designed to facilitate complex analysis and effortless visualization. The purpose of this study as follows.
• Provide information to the leader in many insights and analytics of Integrated Academic Fee policy implementation and admission data in HEI in Indonesia.
• Develop a DW system for supporting decision support in HEI in Indonesia. This study developed two DW system are DW for tuition-fee-level management and DW for admission.
8
1.6 Dissertation Organization
The present study is arranged into 5 chapters:
In Chapter 1, we introduce the background of this study, such as disparity of tuition fee policy in many countries, role of the HEI for the future generation, the IAF policy in Indonesia, the problem faced by HEI in having analytics and integration data followed by the purposes and structure of the thesis.
In Chapter 2, we explain the two DW development approaches based on conceptual and practical. This chapter includes the four procedures of DW development we formulated in this study and how it correlates with two previous approaches.
In Chapter 3, we present a data warehouse system for multidimensional analysis of tuition fee level in HEI in Indonesia.
In Chapter 4, we describe a multidimensional analysis of admission on the education cost of HEI in Indonesia.
At last, in Chapter 5, we summarize the result presented and conclude by proposing future work.
9
Chapter 2 Methodology
2.1 Three-tier approach
The three-tier approach is believed as the broadest DW conceptual architecture is encapsulated for a development environment and divided into three levels or layers, i.e., bottom, middle, and top tier.
Figure 2- 1: A three-tier data warehousing architecture
10
1. The bottom tier that having direct connection to the multi resources is a data warehouse server. The data from operational databases or other external resources feed into data warehouse. Such kind of back-end tools and utilities are used by performing data extraction, conforming, cleaning, and transformation from those sources. Then data is loaded to update data warehouse. The creation of data marts as a business processes and metadata repository are also located in this tier. The data warehouse itself is almost always a relational database system.
2. The middle tier is an online analytical processing (OLAP) server. There are two major OLAP design are a relational OLAP (ROLAP) model and multidimensional OLAP (MOLAP) model. OLAP server make data analyzing, aggregating, and measurement in multidimensional form that data captured from data warehouse.
3. The top tier is a front-end layer to communicate to clients/users. This tier presents tool for performing query and provide result of analysis for reporting or mining in many type of graphics and visualization.
2.2 Five-steps DW implementation in education
Moscoso-Zea et.al (2018) surveyed data warehousing in education and found five steps as a best practice implementation method in a real educational scenario. This dimension intends to analyze the phases that were followed for implementation and the outcomes of the DWH project.
The analysis of this dimension will offer researchers a roadmap for future implementations.
Some of the shared phases used in these papers and that could define a common five-step method for a DWH project implementation are:
1. Information needs analysis and requirements analysis, 2. Data source and data supply analysis,
3. DW design and multidimensional modeling, 4. Extract, transform, and load (ETL) processes, and
5. System, application, reporting, dashboard, and online analytical processing (OLAP) development
11
2.3 Four proposed procedures
In this study, we then associated the three-tier approach to the practical method of DW implementation in education.
As a simplification of these methods, we formulated four procedures, i.e., preparation, integration, analytics, and visualization. Figure 2-2 shows our method used and how it correlates with three-tier DW architecture and five-step DW implementation in education.
Figure 2- 2: Proposed method 2. 3.1 Preparation
The preparation procedures capture the first of two steps in the best practice DW implementation in education. Information requirements, requirement analysis, DW system stakeholder identification, and goal-setting for each decision can be obtained by field observations, document
12
checking, and regulation. The data-driven approach gives a realistic view of IT experts relative to determining the dimensions of analytics by analyzing data sources (operational databases or external sources) that must be incorporated into a single data repository.
2. 3.2 Integration
The integration procedure occupies bottom tier of the three-tier DW architecture, which has access to the databases or data storage systems. The integration procedure also involved Steps 3 and 4 of DW implementation in education to design a multidimensional model and ETL processes. Existing data calls extracted from sources are transformed in the staging area and loaded into the DW. As a logical design of the DW, the dimension and fact tables are designed using a star or fact constellation schema. This model allows the DW system to observe the data in n-dimensional aspects.
2.3.3 Analytics
In the analytics procedure, an online analytical processing (OLAP) server functions in the middle tier of the DW architecture. OLAP is a common approach to analyzing and differentiating multidimensional data. The aggregation of data is conceptualized in cubes by assigning which dimension tables apply to what fact table and how the fact table is measured. Multidimensional of analytics provided in the drilling-down or drilling-across ways is obtained by querying fact tables. Relative to the five steps of the DW implementation method in education, the analytics procedure corresponds to a part of Step 5 in OLAP development. The OLAP development satisfies the need for user visualization of reports, graphics, and a dashboard.
2.3.4 Visualization
The visualization procedure illustrates how DW systems interact with users. Here, analytics data are automatically provided in many reports and graphics in dashboard. It is clear that the visualization procedure matches the top tier of the DW architecture as frontend tools. This
13
procedure shares the same activities as part of step 5 of the DW implementation method in education on building system, application, reporting, and dashboard. The visualization data are displayed based on user privilege in the tuition-fee-level support system. Here, several actions are provided to further process the visualized data, e.g., conversion to Excel files or saving as images.
14
Chapter 3
Data warehouse System for multidimensional analysis of tuition fee level in a public HEI in Indonesia
3.1 Introduction
In Indonesia, approximately three million high school graduates are competing to obtain one of approximately four hundred thousand regular seats in public HEIs. In 2013, the Integrated Academic Fee (IAF) was introduced by the government to provide more opportunities to qualified citizens from low-income families.
HEIs face problems in managing the financial data after each applicant got their tuition fee level.
For example, at Andalas University, a public HEI in Indonesia, even though a web-based application was introduced to determine tuition fees for each applicant, different reports are submitted by university and faculty staff regarding the number of applicants and tuition fee collected at each level. Time is required to generate manual such reports. It is difficult for university staff to distribute students equitably among faculties and study programs when the data are inconsistent. The IAF states that the higher the level, the higher the amount of money paid by the applicants. The faculty is expected to receive as many applicants as possible who have been placed at a higher level of the tuition fee. Without consistent tuition fee data, HEI administrators do not have sufficient information to support financial decision making.
Another problem arises from the fact that the tuition-fee-level decision system functions independently of other information systems, e.g., student registration, payment, and teaching systems. Following student admission, the result of the tuition-fee-level decision system, i.e., the tuition-fee-level data for each applicant, must be migrated to these payment, registration, and teaching systems. IT staff must manage these data migration processes in consideration of the data structure of each faculty’s database system. To provide reports, IT staff must raise an individual query for each database of faculty. As a result, the databases are frequently slow or even crash when retrieving reports.
15
To address these issues, the authors have investigated using open-source software to construct a data warehouse (DW) system., which is considered the backbone tool of a decision support system (DSS).
The goal of this study was to construct a DW system for tuition-fee-level management. A simple but sufficient method was used in this study compared to DW architecture and best practices for DW implementation in education. The proposed DW system was developed using the open- source Pentaho BI software suite, which includes a complete toolset for DW development. Note that the Community Edition of Pentaho was used to reduce the development cost, even if it employs IT experts to manage it.
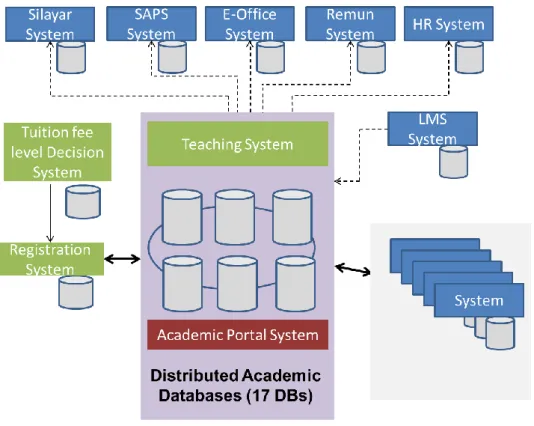
3.2 Overview of current system
Figure 3- 1: Overview of existing system
At the current system, many information systems are implemented. As the primary system is a teaching system that stores all of course data, student data, staff data, and grading
16
data for each faculty. The teaching system is becoming the central data but it is not integrated data with another. All current system is a transactional database and not designed for analytics or reporting.
3.3 System Development
3.3.1 Preparation
A. Data and tools specifications.
The data used for the proposed DW system are for ABC University data, which is an Indonesian public HEI. As discussed in Section 2.2, the IAF policy is complex and is applied to all public HEI in Indonesia. This HEI has experienced changes in tuition fee levels (five to seven levels) because the MRHTE regulated it five years ago. Data were taken from 15 faculties and 51 study programs over five years of policy implementation.
Furthermore, the data type was categorized as structured data because they data are highly organized and fit in fields and columns. In this study, we considered the software, which offers many toolsets and components that accommodate the four procedures discussed in Section 3.
Here, we utilized Pentaho BI Suite Community Edition (CE), which has features in data integration, reporting, OLAP pivot table, and dashboarding. Gartner places Pentaho in the visionary quadrant due to its mature data access, deep data transformation (provided by Pentaho Data Integration [PDI]), and advanced analytic capabilities (through the Data Science Pack).
Pentaho can integrate structured data from enterprise DWs with unstructured data from social media or IoT sources.
B. Information requirements and sources analysis.
When investigating the relevant regulations of the IAF policy, we focused on the probability of attributes changing. For example, the number of faculty (comprising numerous hierarchical study programs), the study program identifier, the number of tuition fee levels, and entrant types have a high possibility to change.
17
In the stakeholder analysis, we defined three groups engaged in tuition-fee-level management, i.e., HEI administrators, IT staff, and financial staff. The HEI administrators comprise administrators at the university, faculty, and study program levels concerned about tuition fee data of applicants by level and admission type. Note that IT staff engage in all operations of DW management, and the primarily interest of financial staff is an applicant’s payment status.
After implementation of the IAF policy, the HEIs’ financial decisions are deter-mined based on such a multidimensional model. The primary problems targeted by this study occur at the institution management level (between the university and faculty levels). The following summarizes several example decisions.
• How should tuition fee levels be distributed among faculty?
• Which faculty obtains the highest number of students in each tuition fee level?
• Percentage of each tuition fee level in university or certain faculty.
• Trends of fees collected from students.
• Which one has a significant portion among high-level groups of tuition fee levels (level 5–7) and low-level groups (level 1–4)?
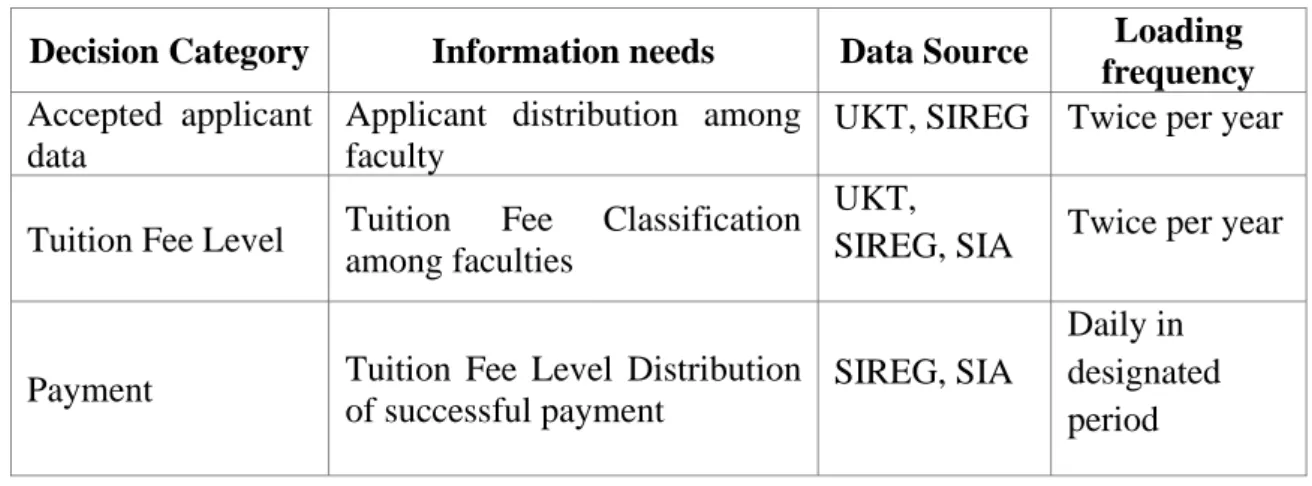
For tuition-fee-level management, the source databases are UKT (Uang Kuliah Tunggal – IAF), SIREG (Student Registration), and SIA (Academic/Didactics System). Database selection depends on the information requirements and target decision. Table 1 shows a data source analysis with correlation to information needs, decision category, and loading frequency.
18
Table 1: Data Source Analysis
Decision Category Information needs Data Source Loading
frequency Accepted applicant
data
Applicant distribution among faculty
UKT, SIREG Twice per year
Tuition Fee Level Tuition Fee Classification among faculties
UKT,
SIREG, SIA Twice per year
Payment Tuition Fee Level Distribution of successful payment
SIREG, SIA
Daily in designated period
The data sources for retrieving accepted applicant analysis are integrated from the UKT and SIREG databases. This analysis is performed twice per year following the regular undergraduate admission program, i.e., SNMPTN and SBMPTN. With the accepted applicant analysis, the level of tuition fee analysis can be performed. However, all three databases (i.e., UKT, SIREG, and SIA) must be incorporated to analyze tuition fee level. The SIREG and SIA databases are involved in student payment analysis because SIREG database records the payment with detailed data for each tuition fee level and the SIA database stores the data of student registration in certain semesters. Completing or canceling tuition fee payment indicates the status of student registration in certain semester. Note that student payment analysis is performed daily during the payment period, and the data are recorded in the SIREG database.
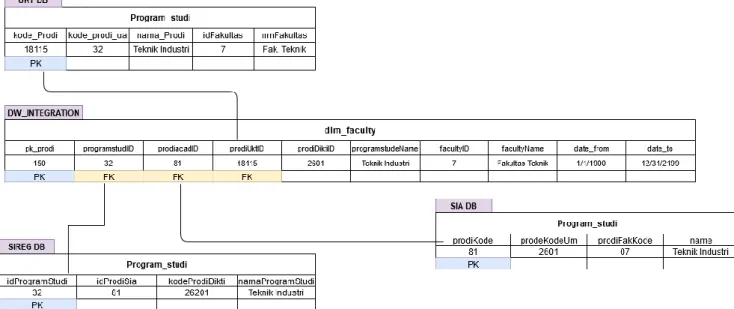
After examining all data sources, we decided to integrate all data sources in consideration of tuition-fee-level management and enterprise-scale education analysis, e.g., course systems and student performance. One method in modeling integration data is multivalued attributes for incorporate study program. Define as an attribute that can have more than one value associated with the key of the entity (Teorey et al, 2011), The multi-valued attribute technique put several columns in a single row associated with department/study program column. We examine four different ID for study programs comes from all sources: one study program ID derived from table program_study in UKT DB, two IDs in table program_study in SIA DB about official study program code by ministry (DIKTI code) and special ID in teaching process, and the last is
19
one ID from table program_study in SIREG DB for internal student registration-payment code.
In the result in table dim_faculty in data warehouse designed all primary key (PK) in related tables as foreign keys (FK). The PK for table dim_faculty is pk_prodi generated as an unique number that with meaningless called surrogate key (SK). In design of denormalized star schema, SKs is bound to fasten data retrieval and lookup, improve join in query performance and take a less space that setting up normal key. Figure 3-2 describe the design of multi-valued attribute in dim_faculty table in data warehouse.
Figure 3- 2: Multi-valued attribute design of faculty dimension
C. Improvement system
Data-driven approaches to decision making improve information requirement analysis. The preparation procedure is initiated by understanding the relevant regulation, reviewing the HEI business strategy, and gathering experience from IT experts engaged in the implementation of this policy. In this study, we acted as IT experts with knowledge about the workflow for the tuition-fee-level decision system. Thus, we obtained the benefits of a data-driven approach because we had full access to current database structures.
20
The goal of this study is identical to BI solutions. The proposed DW system provides not only the integration of multiple information systems into a single repository but also data analysis to facilitate better-informed decision making to achieve an institution’s goals. Moreover, the analytics is displayed as a simple graphical user interface that is easy to understand. All features in the proposed DW system are deployed using single open-source software suites that have both technical and financial advantages.
D. System configuration
The system configuration is shown in Figure 3-3. The PDI tool is used to build ETL function from all MySQL-based data sources to a PostgreSQL-based DW. We consider to building PostgreSQL-based DW comparing MySQL-based DW on the condition we do not necessary often to change the release of database until the all enterprise scale of data warehouse system is completely built and PostgreSQL support several advanced data types not available in MySQL (i.e. geometric/GIS, network address types) even PostgreSQL allow users to add their own datatypes, operators, and index type. PostgreSQL is completely open source under MIT-style licensed and it will a distinguish database system for current database system.
First, data are fed into staging area and then loaded onto warehouse in the form of dimension table and fact table. In the application server, the Mondrian analytics engine uses OLAP schema and Multidimensional Expressions (MDX) query to handle requests from client that is performed using a tool called Pentaho Schema Workbench (PSW). Pentaho Business Analytics (BA) Server, a web container that interacts with Java servlets, responds to all requests from the client that accessed via a web browser. On the top of Pentaho BA server, Saiku and CTools, a set of community-driven plugins are installed to create dashboard, chart, and graphics. Note that users only access the system using a web browser.
21
Figure 3- 3: System Configuration Diagram 3.3.2 Integration
A. DW Schema
The DW system is designed to support all stakeholders in their roles. As a decision support instrument, the DW system is configured according to a top-down approach according to user information requirements. The core of the DW technology is a dimensional design comprising fact and dimensional data [27]. Fact data represent a set of business measurements to analyze, e.g., tuition-fee-level distribution and tuition fee percentage. In contrast, dimensional data represent the context descriptors of the measurements. The main consideration in designing dimensional data is controlling the most possible change data in the required information.
Moreover, the study program identifier data, the number of tuition fee levels, and entrant types have to accommodate in design system.
We define the basic dimensions used in the tuition fee level DW system as follows.
• Faculty. This dimension is the structure representing the level of management in HEI.
This dimension is organized into a hierarchy of three levels, i.e., university, faculty, and study program. Each level is permitted to aggregate data at a de-sired level of abstraction. The attributes of the dimension are surrogate key ID (system-generated
22
identifier to distinguish the dimension), study program ID, name of program study, faculty ID, and faculty name. In this dimension table, the faculty ID column is related via parent-child relation with the study program ID column, where the same faculty ID could has several study program IDs.
• PreRegistrationPeriod. This dimension is the structure for the period of the HEI’s entrance type. This period occurs twice per year as two types of HEI’s entrant that must determine the tuition fee level. The attributes of this dimension are the surrogate key ID, period ID (existing primary key from source data), year, name (description of the context), and entrant type.
• GroupEntranceType. This dimension is the structure of the HEI entrant type. As discussed in the Section 2.2, only two types of admission (i.e., SNMPTN and SBMPTN) must participate in determining the tuition fee level.
• TuitionFeeClass. This dimension structures the level of tuition fees in reference to government regulation for each institution. For the case examined in this study, there were data for only seven levels of tuition fee during the five-year implementation of the IAF policy.
These basic dimensions can be used by any cube to define measurements and data aggregation. These dimensions are essential elements in the solution to the defined problem.
Note that other supporting dimensions were designed, i.e., Applicant, Date, and PaymentStatus dimensions
23
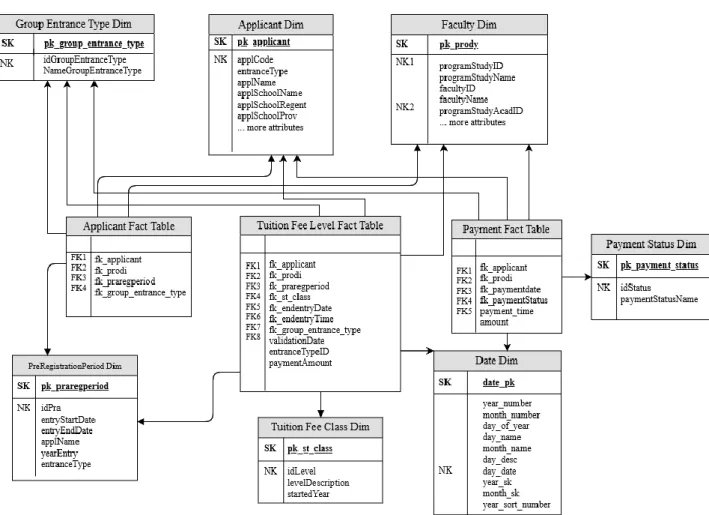
Figure 3- 4: Denormalized multidimensional facts constellation schema
The information requirements shown in Table 1 have different processes and occur independently. Here, the fact data include Applicant data, Tuition-fee-level data, and Payment data. A denormalized facts constellation is used to relate dimension tables and multiple fact tables. The facts constellation (also referred to as the galaxy schema) can serve multiple processes and has several shared dimensions. The schema applied in this study is illustrated in Figure. 3-4.
In this schema, the Faculty dimension is shared across all three fact tables, and the Tuition-fee- level fact table has six dimensions and two measures, i.e., paymentAmount and distinct count of fk_applicant derived from the Applicant dimension table. Note that all fact tables were designed as fact-less fact tables that tracked the tuition fee level of each applicant because each applicant has only a single tuition fee level. Kimball (2013) described many activities in educational
24
institution admissions as the condition of events probability that might happen; thus, we employed the fact-less fact table design. The fact constellation schema comprises multiple star schemas; thus, a denormalized table was formed. A primary objective of the dimensional model is simplicity relative to reducing the number of tables and reducing disk consumption. The denormalized facts constellation schema was designed to optimize query efficiency and improve the DW processing speed.
B. Functionality in integration process
The integration procedure employs the PDI tool, which includes several functions required to construct the DW system.
1. Database connection pool management
The connection to another database is critical for extracting data from sources and loading data to the target DW. Note that many types of databases with many access types can be utilized in connection pool management. In this study, as the Java-based technology, PDI required a Java Database Connectivity (JDBC) for connection to the MySQL-based data sources and PostgreSQL-based target DW.
2. ETL Processes
Based on the PDI perspective, several ETL transformation files and a single job file for unifying processes were created. Transformations describe the ETL data flow, e.g., source connection, transforming data, and loading data into the target location. Jobs are used to coordinate ETL activities, e.g., flow definition, dependencies, and query execution preparation. In the proposed DW system, ETL transformation is divided into four processes, i.e., loading data source to the staging area, performing dimension table creation, pre-fact table creation, and fact table creation.
Table 2 shows the results of the ETL processes.
25
Table 2. Results of ETL Processes
Phase Type of file No. of files
Loading data source to the staging area Transformation 11 Dimension table creation from staging area Transformation 8
Pre-fact table creation Transformation 3
Fact table creation Transformation 3
In dimensional table physical design, the ETL process conduct in continued operation: Data Sources → staging table → dimension table. Some preprocessing also conducted after extract data from data sources to supply for next process. We implemented three techniques in building a staging table based on the relationship in the data source. They are merge-join for integrating data from different sources, stream lookup from a static data grid, and generic values selection.
Figure 3-5 shows the data integration process with staging for faculty dimension in Pentaho Data Integration software.
(a)
26 (b)
Figure 3- 5: Staging process for faculty dimension table (a) and Loading process from staging to faculty dimension table (b) in using Pentaho Data Integration (PDI) tool.
In building fact table, we apply two activities in the staging area: staging table and pre fact table construction. This process describes as Staging table →Pre fact table → Fact table. All of the lookup process to dimension table is conducted in the pre fact table, as shown in Figure. 3-6.
(a)
(b)
Figure 3- 6: Pre fact table payment look up process (a) and loading process from pre fact table payment to fact table payment (b).
27 3. Automating ETL processes
ETL jobs and transformation processes can be scheduled to run automatically at specific times.
The Pentaho CE only provides a scheduler method by scripting an executor file using cron on a Linux-based server and a task scheduler or at command on a Windows-based server.
3.3.3 Analysis of tuition fee level
In a DW, the data analysis techniques refer to OLAP. OLAP is represented as a cube that stores a summary of corresponding dimension values in multidimensional space. A data cube can be indexed in various ways, e.g., roll-up, drill down, slice, dice, and pivot. These OLAP operations are efficient ways to access the data cube for multidimensional analysis.
The OLAP cube of tuition-fee-level data is shown in Figure. 3-7. As a measurement, the number of applicants in the year 2017 is displayed and surrounded by a set of dimensions, i.e., the Faculty, PreRegistrationPeriod, GroupEntranceType, and Tuition-FeeClass dimensions. This multidimensional structure stores and distinct intersection values for the tuition fee level.
Figure 3- 7: OLAP cube of tuition fee level
28
OLAP operations can be applied to view data from different perspectives. For example, roll-up of the year in the PreRegistrationPeriod dimension is performed to aggregate or generalize year without counting entrant type data. The drill-down operation shows deep and smaller parts of the dimension, e.g., showing the number of applicants in the industrial engineering program as the lower level of the Engineering Faculty hierarchy in the Faculty dimension. The slice operation selects a single dimension, e.g., showing only Level 7 of the TuitionFeeClass dimension. An example of the dice operation is the selection of two or more dimensions as a filter/examination of tuition fee data for the Agriculture faculty by entrant type of SBMPTN in the year 2017. In addition, the pivot operation allows us to rotate the data axes of tuition fee level (Table 3). With OLAP, analysis can be performed quickly because the data can be pre-calculated and pre- aggregated.
Another analysis can be performed using the MDX language as a written query language that is appropriate for multidimensional databases. To show the rank of faculty with the highest number of applicants in a particular year, the MDX query uses the Topcount syntax, and then shows the measurement data and faculty data in columns and rows. As a result, the percentage and trends of tuition fee levels can be analyzed.
Table 3. Pivoted Tuition-fee-level data
PreRegistrationPeriod 2017
Group Entrant Type SBMPTN SNMPTN
Faculty Level Tuition Fee No. of Participant
Agriculture Faculty Level 1 0 0
Level 2 0 0
Level 3 2 3
…
Level 7 34 19
Medical Faculty Level 1 0 0
Level 2 0 0
Level 3 1 0
…
Level 7 80 54
Information Tech. Faculty Level 1 0 0
Level 2 0 0
Level 3 0 0
…
Level 7 6 15
29 3.3.4 Visualization
The visualization procedure is available in a web-based client application. As shown in the system configuration diagram (Figure 3-3), users can access the DW system using a web browser in HTML format. This allows an easy access to the DW for HEI administrator (university or faculty level) and financial staff. The user logins will show the user console and load individualized result applicable to stakeholder’s information requirements.
A. Charts and graphics
The result of tuition-fee-level analysis is illustrated using many different types of charts. These charts are immediately loaded by querying the script that was deployed from many functionalities of the OLAP cubes. Bar chart, line chart, and pie chart are chosen to represent the report and analysis. The bar chart is usually designed to represent percentages, totals, and count.
The graphic of tuition fee by faculty, the top five faculty by applicant, and the trend of fees collected from students are presented in the bar chart. The line chart is used to show the tuition fee level trend by year. Another type of graphic, e.g., stacked area chart, heatgrid chart, and metric dot chart, can be chosen with relevance to the data for display.
B. Dashboard
The dashboard represents a user interface for the DW system. The dashboard operates as a graphic container that displays analysis data in a single view. Many analytics and charts can be displayed together on the dashboard as shown in Figure 3-4. The dashboard enables convenient multidimensional identification of tuition-fee-level analytics for users.
C. Dashboard Functionality
Dashboard functionality and interactivity are selected as the features of the dashboard. The filter or parameters, alert, drill down, and data conversion are included in these features. A parameter is assigned a value from the attributes of the dimensional data to narrow the search as well as to filter and classify the fact data. In the dashboard of the tuition fee level, two parameters are used, i.e., year and entrant type. An alert delivers a quick note monitoring a single event within the
30
dashboard. The design of these charts is also designed to be exported to Excel or PDF formats for further action.
Figure 3- 8: Dashboard for tuition fee level management 3.4 Result
The detailed analytical results are presented in three graphs outlined in red in Figure 3-8. The analysis of tuition fees by faculty provides insightful and valid data for HEI administrators.
31 3.4.1 Tuition Fee Level Trends
Tuition Fee Level Trends illustrates the trend in the level of tuition fees from 2015 to 2018.
As can be seen, Level 7 increased significantly in the last two years. Level 6 fluctuated over the entire period and declined significantly in 2018 compared to the level in 2017. In this period, Levels 3, 4, and 5 decreased every year, with Level 4 showing the most significant reduction.
3.4.2 Top Five Faculty by Applicants
The top five faculties by applicants are presented in bottom middle of Figure 3-8. As can be seen, the Engineering Faculty (Fakultas Teknik) attracted the greatest number of applicants, i.e., approximately 1600 applicants, over the last five years. The Economics Faculty (Fakultas Ekonomi) ranked second with approximately 1250 applicants, followed by Agriculture (Pertanian), Law (Hukum), and Medical (Kedokteran) faculties. The Others bar represents an aggregate number of applicants from 10 other faculties.
3.4.3 Fees Collected From The Students Trends
Fees collected from the student trends provides information about the funds collected from the students in HEIs for the years 2016–2018. Over this period, the lowest amount was collected in 2016, i.e., approximately 7 billion Indonesian Rupiah (IDR). The student share increased steadily over the next two years, reaching approximately 13 billion IDR in 2018.
32 3.5 Software, Operating System, and application
Table 4. Software and application
Item Description
Operating System Windows 10
Language Programming Java
Open Source Business Intelligence Suite Pentaho 6.1
Application Server Apache Tomcat
Integration Tool Pentaho Data Integration
Analytic Mondrian Pentaho Schema Workbench
BI Server Pentaho Business Analytics Server
BI Plugin Saiku Analytics
Chart/Graphics Ctool
Dashboarding CDE Dashboard
DB PostgreSQL 9.2
3.6 Summary
The multidimensional tuition fee management presented in this paper is part of the admission DSS. For the case in Indonesia, the disparity of tuition fee level, independence of current HEI system, and time consumption in providing reports causes the lack of student-based income data credibility that affects the sustainability of HEIs. The development of DW system offers a way out for having a single source of truth by integrating multisource data following the business requirements of HEI’s administrator.
33
Chapter 4
Multidimensional analysis of a public HEI admission in Indonesia 4.1 Introduction
In this chapter we describe the financial analysis for admission in a public HEI in Indonesia.
Different from the previous chapter, we include all entrant type for undergraduate program and put the standard education cost as a reference to get the faculty or study program performance financially. The scope of this chapter is depicted in Figure 4.1
Figure 4- 1: Structure of the study
The implementation of IAF policy for public institutions in Indonesia since 2013 has a success story on increasing gross enrolment ratio (GER) as noted at Chapter 1.3. Nevertheless, this policy implementation also has another side effect on decreasing the student-base income.
Surtiati et.al (2017) revealed the decreasing of HEIs revenue from tuition fee mainly in the first year of study in public HEI. The HEIs management needs in mapping the distribution of the new entrant’s tuition fee level and total amount of tuition fee among faculties and study program/department.
34
IAF policy issued another important regulation for public HEIs in generating another tuition fee by independent entrant type. This entrant type became the last chance for the applicant to enter the public HEIs on a particular year. The leader of HEI has total flexibility to decide the tuition fee for each faculty and study program because it is managed locally by each HEI. Compared to the level of tuition fee at regular entrant type, the independent entrant type will rank at the higher level. Another significant difference is another fee component has to charge to new entrant form this entrant type. However, the government under the IAF policy control the capacity of the new entrant seat. In the five years implementation, the government stated the seat for independent entrant type for each study program is not more than 30%.
At the same time with the tuition fee level, the IAF policy announced the standard education cost for each study program in each HEI. The standard education cost is the total expense of operational cost, direct cost and indirect cost. The government prepare this standard cost by formula of:
5,08 million IDR x (Type of study program index) x (Quality Index of HEI) x (Expensiveness index)
Note:
5,08 million IDR is the constant cost index determined by government with the refers to HEFCE (Higher Education Funding Council for England) for bachelor’s degree.
Type of study program index is index for group of close relation study program.
Quality Index of HEI is the index for rank the quality of HEI in national.
Expensiveness Index is the index for local nominal price, usually follow the standard price by location and area.
This cost become attribution of financial achievement in student-based income and update it annually.
One reason the needs of HEI leader to get a fast, accurate and correct all student-based income is to propose another government operational funding for HEI. To ask this supporting budget to government, the HEI leader must arrange the proposal on the current exact financial data. This financial report should be provided immediately for savings in time and accurate findings.
Without having such kind of data will be affected on seamless of the HEI operation.
35
Purpose of this study is to develop data warehouse on keeping a key performance indicator (KPI) for educational cost in HEI. The measurement in the DW is the total of tuition fee by new entrant in all entrant type including independent type that has more than one fee component. The reference cost is the standard education cost, then we can get the ratio and variance between them.
4.2 Information requirements and sources analysis
The flow of admission system in the IAF policy is described in Figure 4.2. The primary problems targeted by this study occur at the institution management level (between the university and faculty levels). The following summarizes several example decisions.
• Total and ration of all entrant type in university, faculty or study program.
• Total, ratio and variance of student-based income in university, faculty or study program.
• Total of student-based income collected by bank.
Figure 4- 2: Flow of admission system in IAF Policy
In forming measurement data, we looked at the payment system. In the payment system keeps data about standard education cost, tuition fee level of all entrant type, and bank records. By
36
creating fact table from this system, we have such kind of admission data mart to solve the problem.
4.3 Data Source Analysis
Figure 4- 3: Data Warehouse for Admission
Figure 4.3 shows the data sources for this data warehouse system. We extracted the standard education cost and cost per tuition fee class from the government regulation, usually on excel files. The new entrant data, tuition fee level, payment data we collected from Mysql-based registration system. And study program data we gathered by teaching system. All data sources are then transformed and loaded to staging area and inserted into a PostGreSQL data warehouse on the separate server.
4.4 DW Schema
We developed seven dimension-tables, one fact table as measurement and one reference table.
Table EducationalCost stores the standard educational cost that will be joined into Admission fact table. In the Admission fact table, we excluded the fee component data because we need to aggregate all of tuition fee based on the new entrant data. We have 1 to 1 relation between new
37
entrant and entrant type because it is impossible to relate with a new entrant with more than one entrant type. Then, we can separate new entrant dimension from entrant type dimension.
The star schema of admission data warehouse shows in Figure 4.4.
Figure 4- 4: DW Schema
4.5 Analysis of admission
A. New entrant analysis by entrant type
One dimensional analysis of admission is new entrant by entrant type. In the analysis, we can select the appropriate measurement data (i.e., number of new entrant), associated to entrant type and tuition fee level dimensions. We can easily obtain data filtered by year or by study program.
Figure 4.5 shows the analysis of new entrant by entrant type in Electrical Engineering study program in 2015-2018.
38
Figure 4- 5: Analysis of new entrant by entrant type
The data illustrated in Figure 4.5, in independent entrant type (written in ‘Mandiri’) is 983 data.
Independent entrant type student covers more than number of Level 2 tuition fee student. This data also records number of Level 7 tuition fee in regular entrant type, there are 830 data in SBMPTN and 414 data in SNMPTN.
B. Analysis of student-based income
The faculty or study program performance in student-based income insight by this analysis. The activity measures can be represented by the value of total amount of tuition fee by new entrant, number of new entrants, standard educational cost, ratio and variance between total amount tuition fee and standard cost. Figure 4.6 depicts the analysis of student-based income on 2018 by faculty.
39
Figure 4- 6: Analysis of student-based income on 2018
From the above data, the highest ratio between total of tuition fee collected and standard education cost is 89.09% belonging to Dentist Faculty (Fakultas Kedokteran Gigi) and the lowest is 21.93% at Animal Husbandry Faculty (Fakultas Peternakan). The right column is stored amount of variance that nominally Engineering Faculty (Fakultas Teknik) scored the highest variance in currency in around 3,86 million IDR.
4.6 Discussion
In data warehouse design, to show total of tuition fee by new entrant, the DW design must summarize all amount of tuition fee and exclude the detail of fee component. If we include the fee component dimension in the fact table, we cannot aggregate the tuition fee by new entrant.
Data warehouse has capability in making performance indicator by joining the fact table and a reference table. In this case, the reference table stored the standard education cost.
Analysis fee collected by all new entrant shows that HEIs have a challenge to make a balance on their educational cost after implementation such kind of subsidize policy for low income family.
Most of faculty financial achievement is quite far for the standard education cost. This data also
40
becomes an exact data to propose another supporting budget to government. In other side, the leader of HEIs needs to find another legal funding to fulfill education cost.
41
Chapter 5
Concluding Remarks
In the present work, we have studied data warehouse system for supporting decision making in the public higher education institution (HEI) in Indonesia. Based on this research, we developed two data warehouse systems, first is data warehouse for tuition-fee-level management, and the second is data warehouse for admission related with the student-based income and education cost. The system was developed following the integrated academic fee (IAF) policy for undergraduate program and look forward to fit potential changing in the annual issue.
We found that the research in this study is a part of Institutional Research (IR) development in the area business reporting and enrollment management. IR itself is defined by Saupe (1990) as the research conducted within an institution of higher education to provide information which supports institutional planning, policy formation and decision making.
Volkwein (1999) noted the Four Faces of Institutional Research in academic affairs support, business/finance support reporting, enrolment management, and student affairs support. For the future research, we expected to dig in this area.
Figure 5- 1: Four Institutional Research Category
42
In Chapter 2, we explain the two DW development approaches based on conceptual and practical. We implemented four procedures of DW development as a DW/BI.
In Chapter 3, we present a data warehouse system for multidimensional analysis of tuition fee level in HEI in Indonesia. The development of DW system offers a way out for having a single source of truth by integrating multisource data following the business requirements of HEI’s administrator. A predefined OLAP analysis improves the processing speed that enables safe operational database when retrieving electronic historical data. Results insight the tuition fee level trends, the top five faculty by applicants, and fees collected by student trends during five years implementation of such kind subsidize tuition fee policy.
In Chapter 4, we describe a multidimensional analysis of admission on HEI in Indonesia.
Analysis results on education cost were presented in various charts, graphic, and dashboard of tuition fee level, which has many functions to provide insight relative to the business performance. We found that the development of data warehouse system for admission providing analysis data multidimensionally. Moreover, the data warehouse supports the measure of financial performance between standard educational cost and all student-base income. With the case of a public HEI in Indonesia for undergraduate program, results show the faculty or study program financial achievements for all entrant type. We provide data which faculty or study program have a suitable balance in education cost.
In Chapter 5, we summarize the result presented and conclude that the institutional research become our proposing future work.