ION TRANSPORT MECHANISMS AND RELAXATION PHENOMENA IN STRUCTURALLY DISORDERED MATERIALS
A dissertation submitted to the
Department of Physics
Graduate School of Science and Technology Kumamoto University
Japan
In partial fulfillment of the Requirements for the Degree of
Doctor of Philosophy
In the subject of
Physics
Jean Léopold Ndeugueu
July 2010
This dissertation entitled
ION TRANSPORT MECHANISMS AND RELAXATION PHENOMENA IN STRUCTURALLY DISORDERED MATERIALS
has been presented and defended publicly on July 26, 2010
by
Jean Léopold Ndeugueu
Approved for the Department of Physics
Graduate School of Science and Technology Kumamoto University
Japan
by
Masaru Aniya, Professor
Advisor
Akira Yoshiasa, Professor Member of Dissertation Committee
Fusao Ichikawa, Professor Member of Dissertation Committee
Kenji Ichimura, Professor
Member of Dissertation Committee
| iii
Ph.D. Thesis – Physics
Abstract
The first part of this work deals with the behavior of the a.c. conductivity in various superionic glasses. Here, we propose a relationship that links the first sharp diffraction peak wave number and the fitting parameters of the a.c.
conductivity power law (Jonscher law). We check the workability of this relationship and find that it describes accurately the experimental data. After a deep discussion, we conclude that the universal aspect of the a.c. conductivity power law reflects the universal pattern of the potential barrier at intermediate length scales. This finding enables us to clarify the role of the dimensionality in the transport mechanism of lithium-ion in disordered lanthanum lithium titanate perovskites. The second part of the study is concerned with the problem of ion relaxation phenomena in glass-forming materials.
Firstly, we carry out a comparative study on two well known models that describe the temperature dependence of viscosity in these materials, that is the Random Walk (RW) model and the Bond-Strength-Coordination Number Fluctuation (BSCNF) model. We find that both models show excellent agreement with experiments. However, the BSCNF model is preferable insofar as it provides a single equation with clear physical meaning that describes the behavior of both the “fragile” and “strong” systems.
Secondly, we investigate the behavior of the -relaxation time at crossover
temperature in various glass-forming materials. We find that it depends not only
on the type of the materials, but also on their compositions. Strengthened by
| iv
Ph.D. Thesis – Physics
previous works, we conclude that the so-called universal “magic” relaxation time at crossover temperature does not exist. We also investigate in detail the fragility index dependence of the -relaxation time at glass transition temperature. The striking similarity between this behavior and that of the -relaxation time at crossover temperature allows us to reinforce the idea that there is a correlation between and -relaxations in glass-forming materials.
Finally, based on the BSCNF model, we shed the light on the role of plasticizers in transport mechanism of lithium-ion in conducting polymers.
Accordingly, we propose a relationship between the normalized temperature range
of cooperativity and the fragility index. The results obtained indicate that by
contrasting a neat poly(ethylene oxide)-based lithium-ion conductor with different
plasticizers, the ionic conductivity increases dramatically whereas the mechanism
of lithium-ion transport remains unchanged. There are compelling experimental
evidences in the literature that confirm this result, however, to date, no theory has
been elaborated to address the issue.
| v
Ph.D. Thesis – Physics
Keywords
Part I
Superionic conductors, ion transport mechanisms, silver-ion conducting glasses, lithium-ion conducting perovskites, a.c. conductivity, d.c. conductivity, medium range structure, FSDP wave number, Jonscher law, Arrhenius law, crossover frequency, bond fluctuation model of superionic conductors.
Part II
Glass-forming materials, lithium-ion conducting polymers, lithium-ion batteries,
ionic conduction, plasticizer, glass transition temperature, crossover temperature,
Kauzmann temperature, Vogel temperature, temperature range of cooperativity,
fragility, viscosity, and -relaxations, bond-strength-coordination number
fluctuation model, random walk model, Vogel-Fulcher-Tammann law, Arrhenius
law.
| vi
Ph.D. Thesis – Physics Contents Title Page ... i
Abstract... iii
Keywords ... v
Contents ... vi
List of Publications ... xi
List of Figures... xiii
List of Tables ... xviii
Structure of the Thesis ... xix
Dedication ... xxi
Acknowledgments ... xxiii
1 General introduction and context of the research 1 1.1 Ion transport mechanisms in structurally disordered materials ... 3
1.1.1 Early works ... 4
1.1.2 A.C. universality ... 5
1.1.3 Scaling and a.c. universality ... 7
1.2 Relaxation phenomena in structurally disordered materials ... 10
1.2.1 Glass formation and glass transition... 10
1.2.2 Energy landscape of glass-forming liquids ... 13
Contents | vii
Ph.D. Thesis – Physics I Ion transport mechanisms in structurally disordered materials 17 2 Characterization of the a.c. conductivity in superionic glasses 18 2.1 A review of some structural models of ion dynamics in disordered materials ... 26
2.1.1 Coupling model ... 27
2.1.2 Jump relaxation model ... 29
2.1.3 Diffusion-controlled relaxation model ... 31
2.1.4 Random barrier model ... 34
2.1.5 Asymmetric-double-well-potential model ... 37
2.1.6 MIGRATION concept ... 38
2.2 Fundamental concerns relating to ion conduction in disordered materials ... 42
2.2.1 Mobile ion density ... 43
2.2.2 Electrode polarization ... 45
2.2.3 Mixed-alkali effect ... 47
2.2.4 Time-temperature superposition ... 50
2.2.5 Constriction effect ... 52
2.2.6 Nearly constant loss ... 55
2.3 An overview on lithium phosphate and silver phosphate glasses ... 58
2.4 Analysis of the a.c. conductivity in silver phosphate glasses ... 60
2.4.1 Logarithmic mixing rule ... 60
2.4.2 Role of AgI for a.c. conduction ... 62
2.4.3 Analysis of the a.c. conductivity ... 63
2.5 Ionic transport: dependence on glass microstructure and chemistry . 70 2.5.1 Role of medium range structure ... 70
2.5.2 Modelisation of the d.c. conductivity ... 73
2.5.3 Modelisation of the activation energy ... 74
2.5.4 Modelisation of the crossover frequency ... 75
Contents | viii
Ph.D. Thesis – Physics 2.5.5 Modelisation of the power law exponent ... 76
2.5.6 Variation of the ratio (logA)/n with the FSDP wave number . 79 2.6 Conclusion ... 83
3 Lithium-ion transport in LLTO perovskites 84 3.1 Introduction ... 85
3.2 Crystallographic structure of LLTO ... 88
3.2.1 Model based on P4/mmm space group ... 88
3.2.2 Model based on C/mmm space group ... 89
3.3 Synthesis of LLTO ... 91
3.4 Lithium-ion transport mechanism in LLTO ... 91
3.5 A new interpretation of lithium-ion transport mechanism in LLTO .. 95
3.5.1 Introduction ... 95
3.5.2 Objectives ... 96
3.5.3 Composition dependence of the power law exponent ... 96
3.5.4 Variation of the ratio (logA)/n with lithium content ... 99
3.5.5 Variation of the ratio (logA)/n with temperature ... 101
3.6 LLTO shortcomings for electrolytes ... 103
3.7 Conclusion ... 103
II Relaxation phenomena in structurally disordered materials 104 4 Arrhenius and super-Arrhenius analysis of glass-forming liquids 105 4.1 Introduction ... 106
4.2 Canonical features of glass-forming liquids ... 108
4.2.1 Non-Arrhenius temperature dependence ... 108
4.2.2 Non-exponential relaxation ... 111
4.2.3 Non-linearity of relaxation ... 111
Contents | ix
Ph.D. Thesis – Physics 4.3 A brief review of some theories of relaxation ... 112
4.3.1 Kohlrausch-Williams-Watts law ... 112
4.3.2 Vogel-Fulcher-Tammann law ... 113
4.3.3 Mode-coupling theory ... 116
4.3.4 Random Walk model ... 117
4.3.5 Bond-Strength-Coordination Number Fluctuation model ... 121
4.4 Fragility index ... 124
4.5 Kauzmann paradox ... 125
4.5.1 Ideal glass transition scenario ... 126
4.5.2 Smooth extrapolation scenario ... 127
4.5.3 Crystallization scenario ... 127
4.6 Comparison between two models of viscosity ... 127
4.7 Correlation between the temperature range of cooperativity and the fragility index: Implications for molecular relaxations ... 131
4.8 Dynamic crossover of relaxation times in glass-forming materials ... 134
4.8.1 and -relaxations ... 134
4.8.2 Does a “magic” relaxation time at crossover temperature exist in glass-forming liquids? ... 139
4.8.3 Is there any correlation between and -relaxations in glass-forming liquids? ... 146
4.9 Conclusion ... 149
5 Polymer electrolytes for lithium-ion batteries 151 5.1 Introduction ... 152
5.2 Challenges for rechargeable lithium-ion batteries ... 153
5.3 Typical configuration of lithium-ion battery ... 154
5.4 Polymer electrolytes ... 156
5.4.1 Solid Polymer Electrolytes ... 157
5.4.2 Gel Polymer Electrolytes ... 159
Contents | x
Ph.D. Thesis – Physics 5.5 Effect of the plasticizers in PEO ... 161
5.5.1 Debye-Waller factor ... 162
5.5.2 Evaluation of the crossover temperature ... 164
5.5.3 Evaluation of the fragility index ... 166
5.5.4 Evaluation of the characteristic parameters B
*and C
*... 167
5.5.5 Results ... 168
5.5.6 Implications for ion transport mechanism ... 169
5.6 Classification of glassy and polymer electrolytes for lithium-ion batteries ... 171
5.6.1 Evaluation of the Vogel temperature ... 171
5.6.2 Classification ... 172
5.7 Conclusion ... 174
6 General conclusion and further considerations 176 6.1 General conclusion ... 177
6.2 Further considerations ... 180
6.2.1 Ion transport mechanisms ... 180
6.2.2 Relaxation phenomena ... 181
References 183
| xi
Ph.D. Thesis – Physics
List of Publications
Portions of this thesis have appeared in the following papers:
1. J.L. Ndeugueu and M. Aniya: Structural characterization of the ac conductivity in Ag ion conducting glasses. Journal of Materials Science, Volume 44, Issue 10, May, 2009, Pages 2483-2488.
2. J.L. Ndeugueu, M. Ikeda and M. Aniya: A comparison between the bond-strength-coordination number fluctuation model and the random walk model of viscosity. Journal of Thermal Analysis and Calorimetry, Volume 99, Issue 1, January, 2010, Pages 33-38.
3. J.L. Ndeugueu, M. Ikeda and M. Aniya: Correlation between the temperature range of cooperativity and the fragility index in ion conducting polymers. Solid State Ionics, Volume 181, Issues 1-2, February, 2010, Pages 16-19.
4. J.L. Ndeugueu and M. Aniya: On the power law behavior of the a.c.
conductivity in Li ion conducting perovskites. Journal of the Physical Society of Japan, Volume 79, Issue Supplement A, March, 2010, Pages 72-75.
5. J.L. Ndeugueu and M. Aniya: Classification of glassy and polymer
electrolytes for lithium-ion batteries by the bond-strength-coordination
number fluctuation model. Advanced Materials Research, Volumes 123-125,
2010, Pages 1075-1078.
List of Publications | xii
Ph.D. Thesis – Physics
6. J.L. Ndeugueu and M. Aniya: Medium range order and the fitting parameters of the ac conductivity of superionic glasses. Solid State Ionics:
New Materials for Pollution Free Energy Devices, Edited by B.V.R.
Chowdari et al., Macmillan , India, June, 2008, Pages 401-407.
7. J.L. Ndeugueu and M. Aniya: Analysis of the a.c. ionic conductivity in (AgI)
0.4(AgPO
3)
0.6glass by using the logarithmic mixing rule. Physics Reports of Kumamoto University, Volume 13, Issue 1, November, 2008, Pages 69-72.
8. J.L. Ndeugueu and M. Aniya: Correlation between the parameters of the power law behavior of the ac conductivity in some AgI and Ag
2S based superionic glasses. Proceedings of the 1
stInternational Student Conference on Advanced Science and Technology, Japan, March, 2008, Pages 21-22.
9. J.L. Ndeugueu and M. Aniya: A bridge between the a.c. conductivity and the fragility index in a poly(ethylene oxide)-based lithium ion conductor.
Proceedings of the 3
rdInternational Student Conference on Advanced Science and Technology, Korea, December, 2009, Pages 15-16.
10. J.L. Ndeugueu and M. Aniya: A note on the universal relaxation time at crossover temperature in glass-forming materials. Submitted.
11. Sahara, J.L. Ndeugueu and M. Aniya: Analysis of the physical properties
of trehalose-water-lithium iodide based on the bond strength-coordination
number fluctuation model. Submitted.
| xiii
Ph.D. Thesis – Physics
List of Figures
1.1. Frequency dependence of the a.c conductivity of ion and electron
conducting materials with disordered structures ... 6 1.2. Improved Taylor-Isard scaling for eight different ion conducting
oxide glasses ... 8 1.3. A.C. conductivity scaling of (AgI)
x(AgPO
3)
1-xfor seven
compositions ... 9 1.4. Various routes to the glassy state, roughly indicating the energies of
the initial states relative to the final glassy states ... 10 1.5. Heat capacity forms for liquid and crystal phases of different
substances ... 12 1.6. Temperature dependent average energies of the inherent structures,
for four different cooling rates of a binary Lennard-Jones mixture ... 14 1.7. Individual minimum energies for the related configurations at
cooling rate of 8.33×10
-5... 15
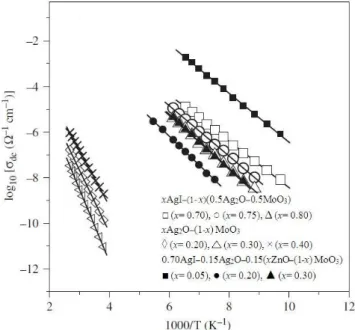
2.1. Arrhenius plots of the ionic conductivity for a set of ion conducting glasses ... 23 2.2. Arrhenius plots of the ionic conductivity for some silver-ion
conducting glasses ... 24 2.3. Temperature dependence of the “apparent” activation energy for the
glasses shown in Fig. 2.1 ... 24
List of Figures | xiv
Ph.D. Thesis – Physics 2.4. Typical set of conductivity spectra obtained from JRM ... 31
2.5. A diffusing ion on arriving at an occupied site ... 32
2.6. Typical potential for a system described by the random barrier model in one dimension ... 34
2.7. Pictorial view of a double-well potential ... 38
2.8. Elementary displacements and ensuing relaxation processes ... 40
2.9. Ionic conductivity isotherms of 0.2Na
2O·0.8GeO
2glass ... 41
2.10. Scaled ionic conductivity plot for 0.2Na
2O·0.8GeO
2glass versus the scaled frequency ... 42
2.11. One dimensional schematic illustration of ion jumps in a disordered landscape for different time scales ... 43
2.12. Nearly constant loss and electrode polarization effects in glasses ... 46
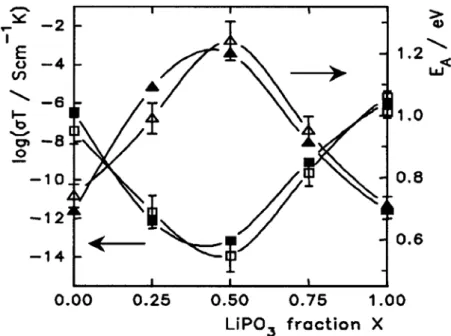
2.13. Composition dependence of the activation energy and the d.c. conductivity for the glass system Li
xRb
1-xPO
3at room temperature .... 48
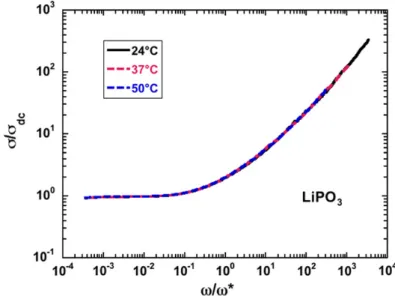
2.14. The real part of the a.c. conductivity at three different temperatures for a lithium phosphate glass ... 51
2.15. Time-temperature superposition demonstrated for lithium phosphate glass ... 51
2.16. The conductivity exponent observed in metaphosphate glasses as a function of the “constriction” ... 54
2.17. The power law exponents reported in Table 2.1 plotted against the effective dimension of ion conduction pathways ... 54
2.18. The dielectric loss in NaPO
3glass collected at twelve temperatures ... 57
2.19. Undoped lithium glass LiPO
3... 58
2.20. Doped lithium glass (LiI)
0.4(LiPO
3)
0.6... 59
2.21. X-ray diffraction patterns of (LiI)
x(LiPO
3)
1-xfor different compositions ... 59
2.22. Frequency dependence of the effective network conductivity ... 65
2.23. Frequency dependence of the real network permittivity ... 66
List of Figures | xv
Ph.D. Thesis – Physics
2.24. Measurements of relative permittivity of a porous PZT sample, conductivity of water at equilibrium with immersed PZT fragments, conductivity and relative permittivity of the sample saturated with
water ... 67 2.25. The a.c. conductivity of (AgI)
0.4(AgPO
3)
0.6at 151.8 K ... 68 2.26. Two-dimensional representation of glassy structure in AgI-AgPO
3.... 69 2.27. Schematic representation showing the time-fluctuating local change
of the type of bonding ... 72 2.28. Relationship between the ionic conductivity of glasses at room
temperature and the FSDP wave number ... 73 2.29. Relationship between the activation energy of the ionic conductivity
of glasses at room temperature and the FSDP wave number ... 75 2.30. The reciprocal temperature dependence of the crossover frequency
for different glassy systems ... 76 2.31. Connectivity of the highly conducting regions with doped salt
concentration... 77 2.32. Relationship between the power law exponent of the a.c.
conductivity of glasses at room temperature and the FSDP wave
number ... 79 2.33. Composition dependence of the ratio (logA)/n for different systems
of superionic glasses ... 81 2.34. Comparison between the calculated and the measured values of the
ratio (logA)/n at room temperature for some glasses ... 81 2.35. A schematic representation of the energy barrier profile ... 82
3.1. General structure of ABO
3perovskites (for cubic symmetry) ... 87 3.2. Powder XRD pattern of La
2/3-xLi
3xTiO
3with x=0.11, obtained by
solid state reaction ... 88 3.3. Crystal structure of La
2/3-xLi
3xTiO
3. La1=La
3+, Li
+, or vacancies in
position (0,0,0), La2=La
3+, Li
+, or vacancies in position (0,0,1/2) ... 89
List of Figures | xvi
Ph.D. Thesis – Physics 3.4. Observed and calculated powder neutron diffraction patterns of La
2/3-xLi
3xTiO
3with x=0.05. ... 90
3.5. Crystal structure of La
2/3-xLi
3xTiO
3with x=0.05, from the perspective of the TiO
6octahedral framework ... 90
3.6. Frequency dependence of ionic conductivity of La
2/3-xLi
3xTiO
3with x=0.11 at 340K. Obtained by impedance spectroscopy ... 92
3.7. Arrhenius plot of the d.c. conductivity of La
2/3-xLi
3xTiO
3with x=0.11 at 340K ... 93
3.8. Schematic representation of 2D and 3D lithium-ions mobility in the perovskite structure ... 94
3.9. Composition dependence of the power law exponent in La
1/3-xLi
3xTaO
3at room temperature ... 98
3.10. Change in dimensionality for furnace-cooled La
2/3-xLi
3xTiO
3perovskites with increased lithium content ... 99
3.11. Composition dependence of the ratio (log A ) / n in La
1/3-xLi
3xTaO
3at room temperature ... 100
3.12. Temperature dependence of the ratio (log A ) / n in La
1/3-xLi
3xTaO
3, for different compositions ... 102
4.1. The Angell’s plot showing the viscosity as a function of the normalized reciprocal temperature for a set of “strong” and “fragile” glass-forming liquids ... 109
4.2. The Stickel’s plot of the viscosity data of 1,3-bis(1-naphthyl)-5-(2- naphthyl)benzene (TNB) ... 115
4.3. Fluctuation of the configurational space for “fragile” glass-forming liquids ... 118
4.4. Pictorial view of the connectivity between structural units ... 122
4.5. Illustration of the Kauzmann paradox ... 126
4.6. Temperature dependence of the viscosity ... 130
List of Figures | xvii
Ph.D. Thesis – Physics
4.7. The relationship between the normalized temperature range of cooperativity and the fragility index for three sample families of
polymeric materials ... 133 4.8. Correlation between the -relaxation time and the KWW exponent,
all at glass transition temperature. Obtained from dielectric
measurements for glass-formers with different chemical structures .... 137 4.9. Schematic illustration of the relationship between the relaxation
times for structural relaxation and the secondary process ... 138 4.10. -relaxation time at crossover temperature as a function of the
lithium content ... 142 4.11. -relaxation time at crossover temperature as a function of the
fragility index ... 143 4.12. -relaxation time at glass transition temperature as a function of the
fragility index ... 148
5.1. Hybrid Electric Vehicles market evolution ... 154 5.2. A typical lithium-ion battery configuration ... 155 5.3. Depiction of a basic construction process of polymer-based battery ... 157 5.4. Temperature dependence of the ionic conductivity of PEO with LiTf,
LiTFSI, or LiBETI salts ... 158 5.5. Temperature dependence of the ionic conductivity of PEO with
LiClO
4, or LiBOB salts ... 158 5.6. Temperature dependence of the ionic conductivity of PVdF-HFP for
some carbonate solvents, with LiFP
6acting as lithium salt... 160 5.7. The normalized temperature range of cooperativity versus the
fragility index in some ion conducting polymers ... 168 5.8. Fragility index dependence of the strength parameter in various
lithium-ion conducting materials ... 173
| xviii
Ph.D. Thesis – Physics
List of Tables
2.1. Power law exponents of various ion conducting materials ... 53
3.1. Bulk lithium-ion conductivities at room temperature and activation
energies of some LLTO and their related structure materials ... 86 3.2. D.C. conductivity, activation energy for the crossover frequency,
and the power law exponent for different compositions of
La
1/3-xLi
3xTaO
3at room temperature ... 97 4.1. -relaxation times at crossover temperature for some glass-forming
materials ... 145
| xix
Ph.D. Thesis – Physics
Structure of the Thesis
This thesis is divided into two main parts corresponding to the two topics tackled in this study. Each part is divided into two chapters. A general introduction is given in Chapter I, while Chapter VI summarizes the whole work presented here and offers new perspectives for future investigations.
The first part of the thesis addresses the issue of Ion Transport Mechanisms in Structurally Disordered Materials, and is divided into the following chapters:
Chapter II
This chapter is devoted to the structural characterization of the a.c.
conductivity in a wide range of superionic glasses. In the framework of this fundamental study, we propose a relationship that links the first sharp diffraction peak wave number and the fitting parameters of the a.c. conductivity power law.
This relationship, which describes accurately the experimental data, enables us to conclude that the universal aspect of the a.c. conductivity power law reflects the universal pattern of the potential barrier at intermediate length scales.
Chapter III
This chapter deals with lithium-ion transport mechanism in lanthanum lithium
titanates with pervoskite structures. By using the insights gained in Chapter II, we
propose a new interpretation of lithium-ion transport in these materials.
Structure of the Thesis | xx
Ph.D. Thesis – Physics
The second part of the thesis is concerned with the Relaxation Phenomena in Structurally Disordered Materials. This topic is divided as follows:
Chapter IV
In this chapter, we investigate the temperature dependence of the viscosity of glass-forming liquids based on Arrhenius and super-Arrhenius analysis. Along this line, we carry out a comparative study between the random walk model and the bond-strength-coordination number fluctuation model of viscosity. From the latter model, we derive an interesting relationship between the normalized temperature range of cooperativity and the fragility index. This relationship not only describes accurately the experimental results, but also provides important details on the interrelation between the key features of glass-forming liquids. Based on this work, we demonstrate that the so-called universal “magic” relaxation time at crossover temperature does not exist. Furthermore, we reinforce the idea that there is a correlation between and -relaxations in glass-forming materials.
Chapter V
In this chapter, we focus on glassy and polymer electrolytes for lithium-ion
batteries. Firstly, we show that by contrasting a neat poly(ethylene oxide)-based
ionomer with different plasticizers, the ionic conductivity increases dramatically
whereas the mechanism of lithium-ion transport remains unchanged. Secondly, by
using the relationship derived in chapter IV together with the Vogel-Fulcher-
Tammann equation, we classify lithium-ion glassy and polymer electrolytes into
the so-called “strong/fragile” pattern.
| xxi
Ph.D. Thesis – Physics
Dedication
Dedication | xxii
Ph.D. Thesis – Physics
Humblement, je dédie cette thèse
à
Marceline Leubou , ma mère
Très chère maman
Voici le fruit mérité de tes immenses sacrifices
Reçois ici l’affection d’un fils pour lequel tu as eu de la peine Aucun mot n’est assez fort pour te témoigner ma reconnaissance
Merci de m’avoir donné ma chance, merci maman pour tout!
à
Lucinette Ndeugueu , mon épouse
Fiona Ndeugueu , ma fille
Jeff Ndeugueu , mon fils
à
Ma famille
Ma belle-famille
| xxiii
Ph.D. Thesis – Physics
Acknowledgments
Acknowledgments | xxiv
Ph.D. Thesis – Physics
First and foremost, I would like to give thanks to the Almighty Lord for the grace without which nothing is possible.
Completing this thesis has been a wonderful and often overwhelming experience. It is hard to know whether it has been grappling with the physics itself, which has been a real learning experience, or grappling with how to read a string of scientific papers and books, carry out research, write a paper, give a coherent talk, work in a group, or stay up until the birds start singing…
I have been very privileged to have Prof. Masaru Aniya as advisor insofar as he has always motivated me, nudged me to go a step further. I am very grateful for the knowledge he taught me, for the opportunity he gave me to attend a plethora of conferences, symposia, meetings, seminars, etc., either in Japan or abroad. I thank him for the quasi-absolute liberty without which the researcher cannot say his way of thinking and acting, his way of being, in short his whole personality. I extend my deep appreciation to Prof. Akira Yoshiasa, Prof. Fusao Ichikawa and Prof. Kenji Ichimura, members of my dissertation committee, for their insightful advices and comments.
Thanks are due to Aniya group members for their warm hospitality, particularly to Ms. Sachi Taniguchi and Mr. Takaki Indoh who helped me with everyday concerns, acting sometimes as my Japanese language teachers. I appreciate the fruitful scientific collaboration with Dr. Masahiro Ikeda.
I convey my sincere thanks to Prof. Samuel Domngang and Dr. Fidèle
Tchoffo for their diligent scientific guidance during my Master’s studies. I am
grateful to them for writing letters of recommendation for the Japanese
Government scholarship program. Thank you to Prof. Clément Tchawoua and
Prof. Jean-Marie Bienvenu Ndjaka for their support and advices. The faculty
and staff of the Department of Physics/UY1 are warmly acknowledged.
Acknowledgments | xxv
Ph.D. Thesis – Physics
I am forever indebted to my late grandparents for the seed they have sown.
Nza'adja Jean Deugue and Mamy Suzanne Tientcheu, I am so sad because you passed away before harvest. May your soul R.I.P.! Thanks are due to Nza'adja Michel Ngaleu and Mamy Odile Mbouwe for following in your footsteps.
My gratitude goes to the members of my family who have been a pillar of support for me throughout my life. Thank you to Mr. and Mrs. Joseph Leubou, Mr. and late Mrs. David Kamani, Mr. and Mrs. Daniel Djietcheu, Mr. and Mrs.
Etienne Moukam, Mr. and Mrs. Emile Momani, Mr. and Mrs. Joseph Ngandjui, Mr. and Mrs. Philippe Wouassi, Mr. Nicodème Djiedeu, Mamy Cécile Eguen, Mr. and Mrs. Charles Tchuanga, Mamy Colette Tiekoué, Mr. and Mrs. Michel Ngaleu II, Late Mr. Joseph Ngandjui and spouses, Mr. and Mrs. Levir Siewe, Mamy Julienne Nematchoua, Mamy Christine Mbonda, Mr. and Mrs. Jacques Thiangue, Mamy Joséphine Mouakwa, and Mr. and Mrs. Gaston Deuko.
I pay a special tribute to Mrs. Jeanne Momani and Mr. Joseph Ngandjui for watching over me for years. Ton Joe, you motivated me, i.a., to apply for the Japanese Government scholarship program. Words fail me to say: thank you!
My thoughts go to the members of my family-in-law, mainly to Mr. and Mrs. Elie Fotsing, Tata Yvonne Medake, Mr. and Mrs. Raymond Tiam, Mr. and Mrs. Olivier Mehebou, and Mr. and Mrs. Augustin Tatemo.
I share the credit of this thesis with my precious wife, Lucinette Ndeugueu, who has been with me every step along the way. Thank you, papounette, for your love, encouragements and patience. Cheers to my kids, Jeff and Fiona Ndeugueu, who gave me the reason and strength to overcome difficulties encountered during these years of self-sacrifice. Whatever happens in your life, you must cope with it and never give up. May God bless and keep you always!
Dearest siblings, Inesse, Adeline, Nöel and Landry Leubou, thank you for
your support. Further thanks go to my cousins, nephews, aunts and uncles.
Acknowledgments | xxvi
Ph.D. Thesis – Physics
I extend my gratitude to Mr. and Mrs. Ludger Ngamani for their advices and encouragements. Dear D.G., thank you so much for the work experience you gave me. My colleagues at I.T.S.E are warmly acknowledged.
My regards to countless friends with whom I shared my joys and sorrows for years. Wink to Mr. and Mrs. Roger Manga, Mr. and Mrs. Georges Ndjoke, Mr. and Mrs. Victor Nack, Mr. and Mrs. Ruben Tchana, Mr. and Mrs. Désiré Essomba, Mrs. Jeaninne Lewetchou and spouse, Dr. Dieudonné Tchokona and spouse, Mr. and Mrs. Christian Ngangue, Mr. and Mrs. Dany Tchamgoué, Mr.
and Mrs. Berthin Djiangoué, Frajebang, and “Cannibales” family members.
I gratefully acknowledge the financial support provided by the Ministry of Education, Culture, Sports, Science and Technology of Japan through the Monbukagakusho Scholarship.
Last but not least, the chain of my gratitude would be definitely incomplete if I failed to thank those people who, directly or indirectly, contributed to the outcome of this thesis and whose names do not appear here.
J.L. Ndeugueu
July 16, 2010 Kumamoto
Japan
| xxvii
Ph.D. Thesis – Physics
| 1
Ph.D. Thesis – Physics
Chapter I
General introduction and context of
the research
| 2
Ph.D. Thesis – Physics
Chapter I
General introduction and context of the research
For many reasons, the properties of structurally disordered materials can be extremely complex if described case by case. Over the years, data on many kinds of materials with different chemical bonds and structures are accumulated.
Therefore, it may be difficult for any researcher to keep track of. Fortunately, various experimental facts can be organized into a number of well established general properties or phenomena, making it easier to make sense out of the data and to compare them with the theoretical predictions.
General properties of structurally disordered materials can be, for instance, a critical experimental fact, a universal behavior, an outstanding anomaly, a strong correlation, a clear pattern or trend, etc. A complete list of common properties will help experimentalists to plan future critical experiments while theoreticians will gain further insights and ideas in the formulation of theories that at least do not contradict any of the indisputable experimental facts. Of course, funds allocated to research will be used efficiently.
In what follows, we will give an overview of the topics discussed in this thesis.
Section 1.1 covers the mechanisms of ion transport in materials with disordered
structures, while section 1.2 addresses the issue of their relaxation processes.
Chapter I: General introduction and context of the research | 3
Ph.D. Thesis – Physics
1.1 Ion transport mechanisms in structurally disordered materials
Of all states of matter, only the crystalline state stands out distinctly in terms of the geometric ordering and positioning of its atoms over long distances. Major experimental and theoretical advances in the understanding of the crystalline state have been satisfactorily achieved. This is not the case for amorphous materials which have disordered structures.
There are compelling evidences in the literature claiming that in crystalline materials, material structure influences ionic conduction. Beyond the type of conduction mechanisms (vacancy, interstitial, or interstitialcy mechanisms), one has a good idea of the structural requirements that lead to high ionic conductivity [1]:
i) A large number of empty equivalent sites should be available for the mobile ions to jump into,
ii) The empty and occupied sites should have similar potential energies with a low energy barrier between them, or
iii) The structure should have open channels or preferential planes through which mobile ions may migrate.
It is well documented that in amorphous materials, due to the absence of long
range order, channel type arrangements or preferential planes favouring the
migration of ions cannot exist. These materials form a class of materials currently
under intensive investigations for their possible technological applications in a
variety of devices including batteries, fuel cells, sensors, electrochromic displays,
smart windows, etc. [2]. The conductivity of best ion conducting glasses may
reach up to
S·cm
-1at room temperature. Although the details depend on the
glass in consideration, most glasses exhibit several advantages over crystalline
electrolytes such as physical isotropy, absence of grain boundaries, continuously
variable composition and ease of processing [3].
Chapter I: General introduction and context of the research | 4
Ph.D. Thesis – Physics
1.1.1 Early works
In 1977, Jonscher [4] published a compilation of dielectric data which clearly demonstrated that a wide variety of materials with different types of short range order and different types of polarizing entities (dipoles, hopping electrons, ions) such as covalent lattices, crystals, ceramics, ionic or electronic conducting polymers, ionic conducting glasses, amorphous semiconductors, polycrystalline semiconductors, organic-inorganic composites, metal cluster compounds, transition metal oxides, etc. have a number of properties in common [2-8]. Among these universal properties, in the framework of this thesis, we will pay much attention (other properties will not be neglected however!) to the common frequency dependence of the overall conductivity characterized by a low frequency region of constant conductivity, known as d.c. conductivity, followed by a gradual transition at higher frequencies to a frequency dependent conductivity, known as a.c. conductivity.
It is of utmost interest to mention that, although Jonscher was the first to discover the a.c. universality for the wide range of materials listed above, Taylor was the first in 1956 to report on the a.c. universality for ion conducting oxides glasses [9-11]. Moreover, at a particular frequency, known as crossover frequency, he found that the activation energy of the d.c. conductivity is identical to that of the a.c. conductivity. This pioneering work of Taylor has led many other researchers to make considerable progress in the understanding of the a.c.
universality. For instance, Pollak and Geballe in 1961 [12], Owen in 1963 [13],
Namikawa in 1975 [14], Mott and Davis in 1979 [15], Epstein in 1986 [16], Van
Staveren et al. in 1991 [17], and Kuanr and Srivastava in 1994 [18] observed the
universal a.c. properties in doped single-crystal semiconductors, ion conducting
glasses, transition metal oxides, amorphous semiconductors, electron conducting
polymers, metal cluster compounds, and polycrystalline semiconductors,
respectively. However, more than three decades after the a.c. universality has been
widely recognized, the mystery remains unsolved.
Chapter I: General introduction and context of the research | 5
Ph.D. Thesis – Physics
It is reported elsewhere in the literature that ion conduction in materials with disordered structures is a classical barrier crossing process while electron conduction is usually a quantum mechanical tunneling process between localized states. Here, the localized states refer to states with wave functions decaying exponentially in space. At this level, the following fundamental question must be asked: what do these conduction mechanisms have in common so that various structurally disordered materials exhibit a universal frequency dependence conductivity behavior? The most likely answer is: very broad distribution of jump rates/tunneling rates, and local mobility [6].
1.1.2 A.C. universality
There are numerous experimental evidences ascertaining the a.c. universality in various materials. For instance, phenomena such as dipolar dielectric relaxation, hopping electron a.c. conductivity, viscoelasticity, mechanical relaxation, NMR relaxation associated with hopping ions, etc. exhibit similar and seemingly related characteristics. To depict this strange behavior, in Fig. 1.1, we have shown typical frequency dependence of the a.c. conductivity of ion and electron conducting materials with disordered structures. These two types of materials have been chosen to show how the a.c. universality is intriguing if we refer to the charge carrier conducting process described above [19].
In a vast majority of disordered materials, a part from what mentioned above, the following a.c. characteristics are universal [6]:
i) The a.c. conductivity obeys time-temperature superposition, i.e. the shape of the scaled conductivity (in log-log plot) is temperature independent,
ii) The shape of the master curve is approximately the same for all disordered materials,
iii) The d.c. conductivity and the onset frequency of dispersive behavior are
Arrhenius temperature dependent with same activation energy.
Chapter I: General introduction and context of the research | 6
Ph.D. Thesis – Physics
Figure 1.1. Frequency dependence of the a.c conductivity of ion (a) and
electron (b) conducting materials with disordered structures. (a)
50LiF-30KF-20Al(PO
3)
3glass (inset: real part of the dielectric constant as a
function of frequency), (b) Polycrystalline diamond film [Dyre et al., 2000[6]].
Chapter I: General introduction and context of the research | 7
Ph.D. Thesis – Physics
1.1.3 Scaling and a.c. universality
Frequency dependent conductivity measurements have become a standard tool for the characterisation of the charge carrier dynamics in many materials, due to the development of modern a.c. impedance analysers. Ion transport in amorphous materials has been intensively studied using this method, and it has been found that the dielectric loss for different materials fall into a single master curve against scaled frequency. Accordingly, various scaling methods have been proposed. For instance, in 1961 [20], Isard plotted dielectric loss against the log of the ratio frequency/d.c. conductivity, equivalent to the following representation [6]
) ( )
( ) ) (
~ (
F C , (1.1)
where ( ) and ( ) represent the a.c. and d.c. conductivities, respectively.
The parameter C may depend on variables such as charge carrier concentration, temperature, high frequency dielectric constant, etc [21].
Roling [22] has improved the so-called Taylor-Isard scaling method by incorporating a free scaling parameter f which in somes cases (sodium borate glasses, for instance) coincides with the glass composition as given by the following equation
F C f ) 0 ( )
0 (
) (
. (1.2)
Fig. 1.2 shows the improved Taylor-Isard scaling (Eq. (1.2)) for eight different ion conducting oxide glasses. The constant C is taken proportional to the reciprocal temperature. A careful analysis of this figure reveals that two effects concerning the influence of the composition, via the scaling parameter f , on the conductivity spectra must be clearly distinguished [22]:
i) Firstly, for a given d.c. conductivity, the spectra are shifted to higher
frequencies as the number density of mobile ions decreases. This “direct number
Chapter I: General introduction and context of the research | 8
Ph.D. Thesis – Physics
density effect” allows an estimate of the number density of mobile ions from the scaled conductivity spectra.
ii) Secondly, in the crossover regime from d.c. to dispersive conductivity, the shape of the spectra depends on composition, while a universal behavior is observed at higher frequencies.
It is fair to note that, comparing the scaling properties of the glasses in the inset of Fig. 1.2, it is not easy to find an appropriate compositional parameter as scaling factor for the frequency axis because the glasses differ in chemical steochiometry and density. Although this scaling approach captures much of the temperature and composition dependence of the characteristic scaling frequency, it requires revision to incorporate variations that may also occur in the length scale for cation diffusion.
To address this issue, a decade ago, in regimes where the nearly constant loss contribution can be neglected, Sidebottom [23] proposed to scale the a.c.
conductivity as
Figure 1.2. Improved Taylor-Isard scaling for eight
different ion conducting oxide glasses [Roling, 1998[22]].
Chapter I: General introduction and context of the research | 9
Ph.D. Thesis – Physics
f
F f f
) (
) (
, with F ( x ) 1 x
n, (1.3)
where f
denotes the onset frequency of the dispersive behavior. Here, this crossover frequency is chosen as
0 0
) 0
f ( . (1.4)
0and refer to the free space constant and to the observed increase in the dielectric permittivity due to ionic relaxation, respectively. As shown in Fig. 1.3, Eq. (1.3) successfully scales the a.c. conductivity data of (AgI)
x(AgPO
3)
1-xfor seven compositions [2]. A great advantage of this scaling is that f
0is expressed in terms of accessible quantities and takes into account the length scale for cation diffusion.
Figure 1.3. A.C. conductivity scaling of (AgI)
x(AgPO
3)
1-xfor seven compositions [Sidebottom, 2000 [2]].
Chapter I: General introduction and context of the research | 10
Ph.D. Thesis – Physics
1.2 Relaxation phenomena in
structurally disordered materials
In simple and concrete terms, a glass is a liquid that has lost his ability to flow.
In other words, a glass is a disordered material that lacks the periodicity of crystals but behaves mechanically like solids.
1.2.1 Glass formation and glass transition
The glassy state can be obtained by many different routes, although the densities of the products of these different processes may not be identical without annealing procedures, as shown in Fig. 1.4. The most common way of making a glass is by cooling a viscous liquid fast enough to avoid crystallization [24,25].
Long time ago, it has been established that when a liquid is cooled from the melting point at a certain cooling rate, it either crystallizes or undercools. If crystal nucleation does not happens due to kinetic constraints, at continued
Figure 1.4. Various routes to the glassy state, roughly indicating the energies
of the initial states relative to the final glassy states [ Angell, 1995 [24]].
Chapter I: General introduction and context of the research | 11
Ph.D. Thesis – Physics
supercooling the liquid, its viscosity increases dramatically and at a certain point, the liquid freezes continuously into a noncrystalline solid. This is known as glass transition, generally admitted to have kinetic origin [24]. According to Dyre [26], the glass transition takes place when the viscosity upon cooling becomes so large that molecular motion is arrested on the time scale of the experiment.
The understanding of the glass transition phenomenon in supercooled liquids has been a long-standing challenge. However, to date there is still an ongoing discussion about the basic nature of the glass transition phenomenon, i.e. the details are yet to be fully understood. In particular, general agreement on the cause of the dramatic slowing down of structural relaxation in glass-forming liquids, such as the so-called “fragile” glass-formers, is still lacking. Upon cooling, experimental evidences show that for these glass-formers, the structural relaxation time of the molecular or ionic constituents increases in a non-Arrhenius fashion by many orders of magnitude in a relatively narrow temperature range above the glass transition temperature, while the static structure changes only very little. Generally speaking, the practical glass transition at T
goccurs at 100 s [24,27-34].
Since the pioneering work of Zachariasen [35], numerous efforts have been made to understand the structure of disordered materials. Many authors consider the glass transition phenomenon not as a “transition” in the thermodynamic sense, but as a second-order phase transition in the Ehrenfest sense, i.e. with continuity of volume and entropy, and discontinuous changes of their derivatives [28,29, and refs. therein]. Thus, the glass transition can be consider as a phenomenon in which the second derivative thermodynamic properties (heat capacity, thermal expansion and isothermal compressibility) change [28,33,36]. For instance, the heat capacity increases dramatically during heating [28].
Although the definition of the glass transition temperature is always arbitrary
with no international convention on the subject [24], it is usually defined as the
temperature of onset of the heat capacity enhancement during heating at 10
K·min
-1. Fig. 1.5 illustrates this definition for some extreme cases.
Chapter I: General introduction and context of the research | 12
Ph.D. Thesis – Physics
In the framework of the relaxation theory, the glass transition temperature is defined as the temperature at which the equilibrium liquid viscosity is
Pa · s.
To understand the glass transition as a general phenomenon, it must first be understood how the internal relaxation time, which is proportional to the viscosity, changes with temperature [24,37]. The term “glass transition” is commonly used to designate the disappearance of structural relaxation in a glass-forming liquid on cooling to low temperatures; the liquid becoming rigid while retaining microscopic structural disorder [24,25,38].
Basically, glasses may form from all liquids. However, liquid helium constitutes a remarkable exception. In general, most metallic liquids for instance, require fast cooling (cooling rates ~
K·s
-1) to avoid crystallization while silicates, borates, bulk metallic glasses, and numerous organic liquids, known as
“good glass-formers”, supercoole easily [29,39]. In other words, for the “good glass-formers”, the probability of germinating a crystal rather than forming a glass during cooling at normal rates is so small that crystals simply do not form.
However, by raising considerably the pressure (relatively to ambient pressure), Figure 1.5. Heat capacity forms for liquid and crystal
phases of different substances [Angell, 1995 [24]].
Chapter I: General introduction and context of the research | 13
Ph.D. Thesis – Physics
crystallization can be induced [24,40].
It is widely accepted that at glass transition, molecular motion ceases virtually (except for thermal vibrations) [25,41,42]. This behavior explains the following several observations among many others [29]:
i) The ability to form glasses is universal and independent to atomic and molecular properties,
ii) The glass transition temperature decreases when the cooling rate is lowered, iii) Volume, enthalpy and entropy are continuous across the glass transition, and no change of the molecular structure is observed at glass transition temperature, iv) The glass expansion coefficient and specific heat are lower than those of the liquid, and
v) Hysteresis effects depend on the nature of the glass transition.
1.2.2 Energy landscape of glass-forming liquids
At low temperatures, using appropriate methods of preparation, many materials achieve a glassy state which exhibits the mechanical properties of a solid, with microscopic structural disorder however. In spite of several studies that have been carried out, a thorough understanding of the glassy state is still lacking [24,43,44]. An interesting approach to understand the complex dynamics of glass-forming liquids is to consider the influence of the structural configuration energy landscape on their relaxation processes [25,45-48].
Accordingly, a decade ago, a breakthrough in the understanding of glass
transition phenomenon in glass-forming liquids has been achieved by Sastry and
coworkers [38]. From computer simulations of a model glass-forming liquid
(binary Lennard-Jones mixture), they have shown that the appearance of
non-exponential relaxation corresponds to a well defined temperature, known as
glass transition temperature, below which the depth of the potential energy
Chapter I: General introduction and context of the research | 14
Ph.D. Thesis – Physics
minima explored by the liquid increases with decreasing temperature. Such behavior has not been observed above this temperature.
At lower temperatures, they have noticed a sharp transition, which depends on the cooling rate as shown in Fig. 1.6, when the liquid is trapped in the deepest accessible “energy basin”. The configuration space has been partitioned into
“basins”, such that a local minimization of the potential energy maps any point to the same minimum [38]. It is of interest to note that in binary mixtures, the different size of the two components often prevent the system to crystallize, allowing its study in a broad temperature interval from below to well above the glass transition temperature.
The main information that can be extracted from Fig. 1.6 is that at lower ( T 0 . 3 ) and higher ( T 1 . 0 ) temperatures, the energies do not change
Figure 1.6. Temperature dependent average energies of the
inherent structures, for four different cooling rates of a binary
Lennard-Jones mixture AB, where 80% of the particles are of
type A and 20% are type B [Sastry et al., 1998 [38]].
Chapter I: General introduction and context of the research | 15
Ph.D. Thesis – Physics
significantly with temperature, while in the range 0 . 3 T 1 . 0 they increase progressively with the increase in temperature. Here, T denotes the dimensionless scaled temperature T
a/T
g, where T
arefers to the absolute temperature. The term
“inherent structures” in the caption refers to the energy minimum configurations obtained by performing a local potential energy minimization for selected configurations.
Fig. 1.7 shows the individual minimum energies for the related configurations at cooling rate of 8 . 33 10
5. A careful observation of this figure indicates that at intermediate and higher temperatures, the individual configuration energies cover a broad range. At a temperature above the glass transition but well below the onset of nonexponential relaxation, the barrier heights separating potential energy minima sampled by the liquid increase abruptly. In this case, kinetic energy permits access to most “basins”.
Figure 1.7. Individual minimum energies for the
related configurations at cooling rate of 8.33×10
-5[Sastry et al., 1998 [38]].
Chapter I: General introduction and context of the research | 16
Ph.D. Thesis – Physics
Another interesting behavior to be noted in Fig. 1.7 is that as temperature is lowered in the low temperature region, a gradual trend leading to a narrow distribution of configuration energies around the average values is observed.
However, the statistical independence of individual points varies strongly with temperature. At these lower temperatures, the sampling shifts to lower energies and mutual access among “basins” becomes subject to considerable “activation”
[38]. It is therefore clear that the relationship found here between static,
topographic features of the energy landscape and glass-forming liquid dynamics
leads to a better thermodynamic understanding of the glass transition
phenomenon.
| 17
Ph.D. Thesis – Physics
Part I
Ion transport mechanisms in
structurally disordered materials
| 18
Ph.D. Thesis – Physics
Chapter II
Characterization of the a.c.
conductivity in superionic glasses
| 19
Ph.D. Thesis – Physics
Chapter II
Characterization of the a.c. conductivity in superionic glasses
Jonscher [4] has suggested that there is a “universal relaxation law” based on the indisputable common property of all condensed matter: the many-body interactions between their constituent parts. However, three decades after, the origin of this relaxation law still remains elusive even if many studies have been carried out.
In the framework of this law, the overall frequency dependence of conductivity ) ( is described by [4]
( ) ( ) A
n, (2.1)
where the pre-exponential factor A and the power law exponent n are
experimentally determined material constants. The second term of Eq. (2.1) refers
to the a.c. conductivity. Between frequencies ranging from kHz to MHz, for
glasses with moderate to high alkali content, it has been found that at (or above)
room temperature (RT), n 0 . 6 [49]. For various ion conducting glasses, it has
been reported that the power law exponent approaches the value of 1 . 0 at high
frequency limit, the temperature being maintained at (or above) RT. For instance,
Chapter II: Characterization of the a.c. conductivity in superionic glasses | 20
Ph.D. Thesis – Physics
Cole and coworkers [50] measured the conductivity of sodium trisilicate glass from Hz up to GHz and found that at RT, n approaches unity at high frequencies. Such studies on different glassy systems abound in the literature. An interesting work is that for Durand and coworkers [51] who observed the same power law exponent behavior for a silver thiogermanate glass at low temperatures, between °C to °C, with frequency up to GHz. Moreover, many researchers found experimentally that n 1 behavior can be observed by decreasing the temperature without extending the frequency range beyond tens of kHz [52-56]. By questioning on the origin of n 1 , Hsieh and Jain [49]
empirically found that the high temperature-high frequency and low temperature-low frequency a.c. conductivity behaviors of the lithium silicate glass 61SiO
2·35Li
2O·3A1
2O
3·1P
2O
5(mol%) can be regarded as the same phenomenon under certain conditions.
The pre-exponential factor A is related to the d.c. conductivity ( 0 ) , i.e.
the frequency independent part of ( ) , by
), ( .
cn
A (2.2) where
crepresents the onset frequency of the dispersive behavior, also considered as the hopping rate [19,57-60]. The d.c. conductivity of a random material is the sum of the partial conductivities of the ionic and electronic charge carriers. It is therefore obvious that any change in its value is inherent to a change of carrier concentration and/or carrier mobility.
The concentration of ionic defects can be increased by several ways, for
instance by doping or by deviation from stoichiometry. The former method
consists to the addition of aliovalent impurities which requires the generation of
ionic defects with opposite charge to maintain electrical neutrality. For the latter,
the reaction with the gas phase results in a reduction or oxidation of the compound
and a formation of excess vacancies or interstitials. However, this process
simultaneously produces electronic species, thereby leading to mixed conduction
Chapter II: Characterization of the a.c. conductivity in superionic glasses | 21
Ph.D. Thesis – Physics
[61]. Another clue to increase the concentration of ionic defects in a particular class of materials (structurally disordered materials) is to increase the temperature (i.e. – transition in AgI, for instance). Let us mention that another source of enhanced carrier concentration is related to the formation of space-charge regions in the neighborhood of interfaces.
The most important factor determining the ionic mobility is the height of the potential barrier that the ion must overcome to pass from one well to an adjacent well, as it is well established that ions proceed by jumps when they move from one position to another one close by. In turn, the barrier height depends on factors such as strain energy that needs to be expended for the ion to squeeze through the bottleneck, the polarizability of the lattice, and the electrostatic interactions between the ion and its surroundings [61]. What does the frequency dependence of conductivity tell us about ion motions in disordered materials?
In structurally disordered materials, at low frequency, the mean square displacement behaves linearly with time as [60]
Dt t
r
d.c.
2
( ) , (2.3)
where D denotes the diffusion coefficient. This linear time dependence is due to the random diffusion of the ions as they migrate from site to site through the disordered matrix. Such a time dependent mean square displacement is found in the classical random walk model of diffusion and is a feature of uncorrelated motions [60]. For this random walk, the diffusion coefficient is defined as
D
2
c6
1 , (2.4)
where represents the mean hopping distance. By applying the Fourier
transformation to Eq. (2.3), we obtain the Nernst-Einstein relationship between
the d.c. conductivity and the hopping rate [58,60]
Chapter II: Characterization of the a.c. conductivity in superionic glasses | 22
Ph.D. Thesis – Physics
c B
T k Nq
( 0 ) 6
2
2. (2.5)
Here, the symbols have usual meanings. N is the number density of “mobile ions”.
In general, for all Jonscher-like materials, the variation of the d.c. conductivity with reciprocal temperature for different compositions can be modeled by the following Arrhenius equation
) / exp(
)
( T
E
ak
BT
, (2.6) where E
aand
denote the activation energy and a temperature independent parameter which has been found similar to almost all vitreous materials, respectively [62]. By using Nernst-Einstein relation, the pre-exponential factor
can be expressed as [63]
B m
B
k
S k
a
Nq exp 6
0 2 2 0
![Figure 1.2. Improved Taylor-Isard scaling for eight different ion conducting oxide glasses [Roling, 1998[22]]](https://thumb-ap.123doks.com/thumbv2/123deta/5654157.2005994/35.892.238.675.361.692/figure-improved-taylor-scaling-different-conducting-glasses-roling.webp)

![Figure 2.4. Typical set of conductivity spectra obtained from JRM [Funke, 1997 [82]]](https://thumb-ap.123doks.com/thumbv2/123deta/5654157.2005994/58.892.240.673.184.502/figure-typical-set-conductivity-spectra-obtained-jrm-funke.webp)
![Figure 2.9. Ionic conductivity isotherms of 0.2Na 2 O·0.8GeO 2 glass. Fits are made by using the MIGRATION concept [Funke et al., 2004 [97]]](https://thumb-ap.123doks.com/thumbv2/123deta/5654157.2005994/68.892.264.654.652.1008/figure-ionic-conductivity-isotherms-glass-migration-concept-funke.webp)
![Figure 2.17. The power law exponents reported in Table 2.1 plotted against the effective dimension of ion conduction pathways [Sidebottom, 2009 [60]]](https://thumb-ap.123doks.com/thumbv2/123deta/5654157.2005994/81.892.270.644.180.471/figure-exponents-reported-effective-dimension-conduction-pathways-sidebottom.webp)

![Figure 2.27. Schematic representation showing the time-fluctuating local change of the type of bonding [Aniya, 1992 [167]]](https://thumb-ap.123doks.com/thumbv2/123deta/5654157.2005994/99.892.253.666.701.1009/figure-schematic-representation-showing-fluctuating-change-bonding-aniya.webp)
