DISCUSSION PAPER No.115
Agglomeration and Adverse Selection:
Evidence from multi-plant firms
(産業集積と逆選択:多工場企業の実証分析)
2015 年 4 月
文部科学省 科学技術・学術政策研究所
第1研究グループ
René Belderbos 池内 健太 深尾 京司
金 榮愨 権 赫旭
本 DISCUSSION PAPER は、文部科学省科学技術・学術政策研究所が、一橋大学及び経済産業 研究所との共同研究の一部の成果をまとめたものであり、所内での討論に用いるとともに、関係の 方々からのご意見をいただくことを目的に作成したものである。 また、本 DISCUSSION PAPER の内容は、執筆者の見解に基づいてまとめられたものであり、機 関の公式の見解を示すものではないことに留意されたい。 本報告書の引用を行う際には、出典を明記願います。 DISCUSSION PAPER No.115
Agglomeration and Adverse Selection: Evidence from multi-plant firms
René Belderbos, Kenta Ikeuchi, Kyoji Fukao, Young Gak Kim, and Hyeog Ug Kwon
April 2015
1s t Theory-Oriented Research Group
National Institute of Science and Technology Policy (NISTEP) Ministry of Education, Culture, Sports, Science and Technology (MEXT)
産業集積と逆選択:多工場企業の実証分析 文部科学省 科学技術・学術政策研究所 第 1 研究グループ René Belderbos 池内 健太 深尾 京司 金 榮愨 権 赫旭 要旨 生産性の高い企業は産業集積地に立地することを自ら選択するか?生産性の高い企業が集 積地に立地すると、多くの供給者が近くにいることによって、より大きな便益を受けるかもしれない。ま た、生産性の高い企業は、集積地における競合企業との厳しい市場競争に生き残る可能性も高いと 考えられる。一方、生産性の高い企業は、産業集積地に立地した場合、近くに立地するライバル企業 に知識が漏洩してしまうリスクも高くなり、他社から受け取る知識のスピルオーバーの利益を上回る損 失が生じるかもしれない。そこで本研究では、製造業企業のうち、複数工場を有する企業が新しく設 立した工場の立地に関する母集団情報を用いて、企業の生産性が立地選択に与える影響を分析す る。2002 年から 2008 年までに新たに設立された 3,000 以上の工場の立地選択の要因を条件付きロ ジットモデルによって分析したところ、産業集積に関しては「逆選択」の効果が支配的であることがわ かった。すなわち、生産性の低い企業は競合企業の工場が多く立地している産業集積地を新たな工 場の立地として選択しやすい傾向がある一方、生産性の高い企業はそのような産業集積地を新たな 立地先として避ける傾向があることがわかった。ただし、直接輸出を行っている工場の立地選択にお いては生産性の高い企業は産業集積地を好む傾向が見られた。これらの結果は、生産性の高い企業 は、自らの技術知識が競合企業にスピルオーバーしてしまうリスクを回避するために、新たな工場の 立地先として、非集積地を自ら選んでいる可能性を示している。
Agglomeration and Adverse Selection: Evidence from multi-plant firms René Belderbos, Kenta Ikeuchi, Kyoji Fukao, Young Gak Kim, and H yeo g Ug Kwon,
First Theory-Oriented Research Group, National Institute of Science and Technology P olicy (NISTEP )
ABSTR ACT Do high or low productivity firms self-select into locations characterized by high
industry establish ment density? On the one hand, productive firms may benefit more from the presence of specialized suppliers in agglo merated areas and they are also more likely to survive heightened product market competition. On the other hand, productive firms face greater risks of knowledge dissipation to collocated rival firms and contribute more than they receive in terms of knowledge spillovers. We examine unique data on the location of new plant establishments b y multi-plant manufacturing firms in Japan, relating location decisions to firms’ prior productivity in existing plants. Estimating conditional logit models of location choice for close to 3,666 plant location decisions (2002-2008) covering more th an 1,000 towns, wards, and cities, we find tha t the adverse selection effects of industry agglomeration dominate. These effects are substantially stronger if there is no association between establishment density and local competition: if incumbent plants are exporting or if the investing firm or new plant entry focuses on export markets. We conclude th at sorting processes do occur, but that these can only be uncovered in a more fine-grained analysis that takes into account ex ante measures of firm heterogeneity and the nature of product marke ts.
‐概 要‐
背景・目的
近年多くの先行研究で地理的な集積地に立地する企業の生産性が高いことがわかっている。そ の背景には、2つの仮説が考えられる。第1には、地理的な産業集積地(産業クラスタ―)に立 地する企業はマーシャル(1922)が初めて提唱した「集積の外部性」を享受できることである。 集積の外部性とは、同種の企業がある特定の地域に集積して立地した方が、分散して立地してい る場合に比べてより多くの利益を享受できる現象を指す。具体的には、同種の企業が多数立地す ることによって、産業に特殊的な技能や特性を有する労働者や原材料・部品・企業向けサービス 等の供給が増えることにより、質の高い生産要素が比較的低コストで利用できる。また、多くの 企業が互いに近接して立地することにより、顧客を見つけるコスト(探索コスト)が低下するた め、集積の外部性は需要サイドでも起きる。さらには、企業間の互いの立地の地理的な距離が近 いほど、相互の知識のスピルオーバー(波及)が起きやすいことも集積の外部性の大きな要因と 考えられている。 第 2 に、産業集積地では同種の企業間での競争が激しくなるため、生産性の低い企業の退出が 促され、生産性の高い企業が生き残るような選択効果(セレクション効果)が強く働くことによ って、産業集積と生産性の間の正の関係性が観察されている可能性もある。では、生産性の高い 企業は産業集積地に立地することを自ら選択するのであろうか?生産性の高い企業は、集積地に 立地し、近くに立地する多く供給者から便益を受けるかもしれない。また、生産性の高い企業は、 集積地における競合企業との激しい市場競争に生き残る可能性も高いと考えられる。しかしなが ら、先行研究では、生産性の高い企業が産業集積地を立地先として選ぶ傾向は観察されてこなか った。 一方、生産性の高い企業は、産業集積地に立地した場合、近くに立地するライバル企業に知識 が漏洩してしまうリスクも高くなり、他社から受け取る知識のスピルオーバーの利益を上回る損 失が生じるかもしれない。この場合、生産性の高い企業は産業集積地をむしろ避けて立地するこ とになる。しかしながら、生産性が高く優れた技術知識を有する企業が集積地を避けて立地する ことは、技術知識のスピルオーバーの効果による近隣の他企業の生産性の向上があまり起きない ことを意味しており、社会的には望ましくない。悪貨が良貨を駆逐する状況は経済学の用語で「逆 選択(adverse selection)」と呼ばれるが、このように産業集積地では生産性の低い企業の存在が生 産性の高い企業の参入を阻害するいわゆる「逆選択」の状況が起きているかもしれない。 そこで本研究では、生産性の高い企業が、競合企業への知識のスピルオーバーを通じて競争優 位を失うリスクを避けるために、産業集積地への立地を避けるメカニズムを実証的に明らかにす る。分析では、製造業企業のうち複数工場を有する企業が新しく設立した工場の立地に関する母集団情報を用いることにより、産業集積地における企業の立地選択においてこのような「逆選択」 の問題が生じているかを検証する。
データ・分析方法
本研究では『工業統計調査』(経済産業省)の事業所レベルの個票データを用いて、2002 年か ら 2008 年までに新たに設立された工場の立地選択の要因を分析する。『工業統計調査』(経済産業 省)によれば、2002~2008 年の期間に 2,992 社の複数工場を有する企業が 3,666 工場を新たに設 立している。これら新たに設立された工場は、346 産業(日本標準産業分類の細分類;4 桁分類) で 1,049 の市区町村に渡っている。なお、そのうち 3 分の 2 は当該企業が工場を持っていない市 区町村での新規設立である。 分析方法は「条件付きロジットモデル」である。これは、企業が新たに設立する工場の立地を 決定する際に、最も期待利益が高くなる立地を選択することを仮定し、企業と地域に関する様々 な要因が各企業にとっての各立地の期待利益に与える効果を統計的に推定する方法である。 企業にとっての各地域への新規立地の期待利益の決定要因として、本研究では次の要因の効果 を考慮する。 地域の要因 産業集積:当該地域に立地している当該企業と同一産業に属する既存の他企業の従業 者数(Industry employment) 川上産業(供給者)の集積:当該地域の産業構造と当該企業が属する産業の中間財投 入構造との一致度(Supplier industry fit) 川下産業(需要)の集積:当該地域の産業構造と当該企業が属する産業の産出構造と の一致度(Buyer industry fit)
経済規模:当該地域に既に立地している製造業の全産業の企業の従業者数(Total manufacturing employment) 混雑効果の代理指標:地価(Land price): 企業の要因 全要素生産性プレミアム:当該企業の既存工場の全要素生産性と当該産業平均との差 (TFP premium) 本社の有無:当該企業の本社が当該地域に立地しているかどうかをあらわすダミー変 数(HQ of the firm)
本社からの距離:当該企業の本社から当該地域までの距離(Distance from firm’s HQ) 既存工場の有無:当該企業の既存工場が当該地域に立地しているかどうかをあらわす
ダミー変数(Existing plant of the firm)
近くに立地する工場との距離(Minimum distance firm’s other plant) また、本研究では、企業の全要素生産性プレミアム(TFP premium)の高さによって、産業集 積や供給者・需要の集積等が立地に与える効果が異なるかを検討することによって、生産性の高 い企業がライバル企業への知識のスピルオーバーが生じることを避けるためにあえて産業集積 地を避けて新規立地する傾向があるかどうかを検証する。 さらに、企業が財を供給している市場の地理的に近さが生産性の高さと産業集積地の新規立地 に影響を与えるかを検証するために、企業が直接輸出を行っているかどうかによって、サンプル を分けてモデルを推定するとともに、産業集積を以下の 2 つに分けてそれぞれ新規立地に与える 効果を推定する。
非輸出企業の産業集積(Industry employments non-exporting firm):当該企業と同一産業に属 する当該地域に立地している既存の他企業の工場のうち直接輸出を行っていない工場の 従業者数
輸出企業の産業集積(Industry employments exporting firm):当該企業と同一産業に属する 当該地域に立地している既存の他企業の工場のうち直接輸出を行っている工場の従業者 数
本研究の分析結果とその政策的含意
本研究で得られた主な分析結果は次の3点である。 1.産業集積に関しては「逆選択」の効果が支配的である。すなわち、生産性の低い企業は、 競合企業の工場が多く立地している産業集積地を新たな工場の立地として選択しやすい 傾向がある。一方、生産性の高い企業は、そのような産業集積地を新たな立地先としてむ しろ避ける傾向がある(概要図表 1)。 2.ただし、直接輸出を行っている工場の立地選択においては、生産性の高い企業は産業集積 地を好んで立地する傾向がある(概要図表 2)。 3.一方、川下産業(顧客)と川上産業(供給者)の集積は新規工場の立地を誘引する効果が あり、それらの効果の大きさは企業の生産性の高さにはあまり影響されない。 これらの結果は、生産性の高い企業は、自らの技術知識が競合企業にスピルオーバーして自ら の競争優位が低下するリスクを回避するために、あえて非集積地を新たな立地先に選んでいる可 能性を示している。一方、生産性の低い企業が新たな工場を設立する場合、生産性の高いライバ ル企業からの技術知識のスピルオーバーを享受することを狙って、生産性の高いライバル企業が 既に立地している地域を新設工場の立地先として選択していることを示唆している。 以上のような分析結果から導かれる政策的含意は、知識のスピルオーバーのメリットを最大限 活かすためには、何らかの政策的な介入が必要となることである。第1には、研究開発や特許な ど企業の技術知識に関する観察可能な情報を用いて生産性の高い企業を識別し、特別減税等の措置を用いてそのような優れた技術知識を有する企業が産業集積地に立地する誘因を引き上げる ような政策が有効であると考えられる。第2には、地域をまたぐ企業間の共同研究を奨励する等、 地理的な距離を超越した知識のスピルオーバーを直接的に促すような政策が挙げられよう。第3 に、輸出企業の生産性をより高めたり、生産性の高い輸出企業の国内立地を増大したりすること も有効である可能性がある。なぜなら、輸出企業は非輸出企業とは対象とする市場が異なるため、 生産性が高い企業においても、国内の企業の産業集積地を避ける傾向はないことが明らかになっ たためである。輸出企業の研究開発や産学連携を奨励することで輸出企業の生産性を高めたり、 生産性の高い輸出企業の規模の拡大を促して国内での工場の新設が行われれば、国内の他企業へ の技術知識のスピルオーバーの増加を通じて、産業全体の生産性も向上すると期待される。 概要図表 1:企業の生産性と産業集積が新規立地の期待利益に与える効果 概要図表 2:直接輸出の有無別の産業集積の新規立地の期待利益に与える効果
参考文献
アルフレッド・マーシャル(1922)『経済学の原理(原題:Principles of Economics)』MacMillan. 0.234 -0.040 -0.100 -0.050 0.000 0.050 0.100 0.150 0.200 0.250 低生産性企業 高生産性企業 0.291 -0.063 -0.149 0.008 0.075 0.178 0.198 0.058 -0.200 -0.1000.000 0.100 0.200 0.300 0.400 非 輸出工 場の集 積 輸 出工場 の集積 非 輸出工 場の集 積 輸 出工場 の集積 低生産性企業 高生産性企業 非輸出企業 輸出企業1
Agglomeration and Adverse Selection:
Evidence from Multi-Plant Firms
*René Belderbos
University of Leuven, UNU-MERIT, Maastricht University, and NISTEP
Kenta Ikeuchi
NISTEP
Kyoji Fukao
Hitotsubashi University, NISTEP, and RIETI
Young Gak Kim
Senshu University and NISTEP
Hyeog Ug Kwon
Nihon University, NISTEP, and RIETI
Keywords: productivity, location, agglomeration, spillovers, adverse selection JEL codes: D24, O32
1. INTRODUCTION
Recent empirical evidence has firmly established that the locational agglomeration of firms is associated with productivity benefits (e.g. Melo, Graham, and Noland, 2009; Combes et al., 2012). Two competing explanations have been put forward for this correlation. The predominant explanation is the notion of Marshallian agglomeration externalities, which contends that firms can enjoy positive externalities stemming from geographic industry clustering. These can occur on the input side, as increased demand for inputs stimulates the provision of specialized (labour) inputs and specialized business services. Externalities may also occur on the demand side, as co-location of firms lowers search costs for customers and thus heightens local industry demand, or through locally bounded spillovers of technological and organizational knowledge. These
* This paper is the result of a joint research project of the National Institute of Science and Technology Policy (NISTEP) and the Research Institute for Economy, Trade and Industry (RIETI) under the “Science for Science, Technology and Innovation Policy” program. René Belderbos gratefully acknowledges financial support from NISTEP, and the Centre for Economic Institutions and the Joint Usage and Research Center (Fiscal 2014 Project Research Program) at the Institute of Economic Research, Hitotsubashi University.
2
possible externalities motivate firms to choose locations where similar establishments are clustered, an intuition that has been supported by formal economic models (Krugman, 1991; David and Rosenbloom, 1990) and empirical work (e.g. Belderbos, Olffen, and Zou, 2011; Head et al., 1994; Alcacer and Delgado, 2012; Alcacer and Chung, 2007).
A second explanation that has been put forward is a selection effect associated with the increased competition within clusters. Collocation of firms in local markets leads to tougher competition, forcing the exit of weaker firms with lower productivity (Melitz and Ottaviano, 2008; Syverson, 2004). In addition, the more productive firms may benefit more from agglomeration, for instance because hiring the more specialized, productive workers provides relatively large productivity benefits to firms that operate more efficiently (Combes et al., 2012), or because efficient firms benefit more from the presence of specialized suppliers (Baldwin and Okubu, 2006). In an analysis of French establishment data, Combes et al. (2012) find empirical patterns consistent with agglomeration benefits that are more pronounced for more productive firms.
The notion that there are greater advantages and chances for survival in higher density locations for productive firms would also imply that these firms self-select into high-density locations. However, this conjecture has received little support. Faberman and Freedman (2013) find no evidence of positive sorting effects for U.S. establishments in metropolitan areas. Combes et al. (2012) similarly fail to find evidence of positive selection effects. They suggest that the absence of selection effects may be due to the fact that most markets are national or international rather than local, such that the extent of competitive pressure is not related to local density. Furthermore, the literature on firm heterogeneity and market entry, often utilizing data on foreign-invested manufacturing plants, has, by and large, concluded that larger and more R&D-intensive firms are less, rather than more, responsive to locational agglomeration than smaller, less R&D-intensive firms (Shaver and Flyer, 2000; Alcacer, 2007; Belderbos and Carree, 2002; Alcacer and Chung, 2007).1 The explanation for this pattern relates to the role of knowledge
1
Belderbos and Carree (2002) found that smaller firms’ location choice in China was significantly more responsive to Japanese investor agglomeration than the location choice by larger firms. Shaver and Flyer (2000) and Alcacer (2007) find a similar pattern for foreign investments in the U.S. in relationship with industry agglomeration. Alcacer and Chung (2007) find that firm R&D intensity negatively moderates the effect of industry agglomeration on location choice. Recent work by Alcacer and Chung (2013), in some contrast, however, concludes that
R&D-3
spillovers in local agglomerations and is relatively straightforward. An asymmetry arises as large, productive firms with the most innovative technologies and organizational and process skills contribute the most to local knowledge spillovers. At the same time, the most productive firms may have most to lose from the presence of knowledge spillovers within the industry cluster, since competing firms may be able to increase productivity and market share if they are able to mimic product designs and organizational approaches or acquire knowledge through employee mobility. Recent evidence on the effects of large plant openings on local productivity has confirmed that local productivity effects are often substantial (Greenstone, Hornbeck, and Moretti, 2010). An asymmetry in knowledge spillovers suggests a process of adverse selection in which firms with relatively weaker (rather than stronger) competitiveness are more likely to opt to locate within clusters. This effect plays out on the supply side, regardless of whether markets are local or national.
The (co-)existence of two contrasting sorting effects (through competition and knowledge spillovers) may explain the absence of net sorting effects in prior studies. In this paper, we aim to reconcile these two contrasting views and empirical findings on firm heterogeneity and agglomeration by examining how the relationship between agglomeration and location choice differs in accordance with firms’ ex ante productivity. We posit that that the sorting effects of agglomeration depend on 1) the specific characteristics of agglomeration 2) the nature of the product market. First, while productive firms should be attracted to locations with agglomerated establishments in related industries sharing labour and suppliers, the presence of establishments in the narrowly defined product market is likely to discourage productivity leaders (relative to laggards) to collocate due to the asymmetry in knowledge spillovers.2 Here we use the decomposition of agglomeration benefits into constituting parts by distinguishing establishment density in four-digit industries from the specific agglomeration benefits that result from the broader pattern of industry establishments allowing suppliers, customers, and knowledge to be shared (Glaeser and Kerr, 2009; Alcacer and Chung, 2013; Ellison and Gleaser, 2010). Second,
intensive foreign investors in the U.S. react positively to knowledge spillovers, and that they are not less responsive to industry agglomeration.
2
In a different context, Bloom et al. (2013) also suggest that R&D spillovers have profoundly different effects if they occur between market rivals compared with R&D spillovers from firms that are not operating in similar product markets.
4
we distinguish plant entries between establishments selling to national markets and plants aiming for domestic markets; we distinguish existing industry establishments in the same manner. Since market competition effects due to industry density are attenuated if entrants and existing establishments focus on different markets, sorting effects are expected to primarily relate to asymmetry in knowledge spillovers between collocated leading and lagging firms. In such circumstances, adverse selection effects are expected to be more pronounced.
We examine these conjectures in an analysis of 3,666 plant location decisions (2002-2008) of Japanese multi-plant firms in more than 1,000 towns, wards, and cities, drawing on data from Japan’s Census of Manufacturers, matched with information from the Basic Survey of Firm Activities. By focusing on multi-plant firms, we can identify (adverse) selection effects in detail by relating location decisions to firms’ productivity in existing plants in the same industry.3 We distinguish between the density of forward and backward linkages for the industry of the entrant (through input-output tables) and agglomeration defined at the four-digit product level. The analysis controls for intra-firm agglomeration effects (e.g. Alcacer and Delgado, 2012; Alcacer, 2007) by including variables indicating the presence of prior establishments and headquarter operations of the firm in the location. The general resource competition aspects of density are taken into account by including local land rental costs. Estimating conditional logit models of location choice, we find that the more productive firms respond significantly less positively to industry agglomeration, suggesting that overall adverse selection effects outweigh competition effects. When we differentiate entries between firms and plants selling to export markets and firms or plants selling to domestic markets, we observe that adverse selection effects only occur in cases in which there is a domestic market focus – i.e. local establishments and new entrants are more likely to compete directly for market share. We find similar results when we distinguish density between industry establishments focusing on domestic markets and establishments with export sales. The findings provide strong support for the notion of adverse selection due to the risk of knowledge dissipation: if existing establishments and the high productivity entrant share
3
We note that most of the literature on the economics of agglomeration has not taken into account firm effects, but has limited attention to establishment characteristics. Since multi-plant firms in general are more productive than single plant firms, our identification strategy implies that we draw on a sample of the more productive firms. Even within this group of entrants, we find strong heterogeneity in responses to location factors.
5
the same market, knowledge dissipation concerns are salient as increases in the competitiveness of incumbent rivals directly affect the market share and profitability of the entrant. Industry agglomeration reduces, rather than increases, the likelihood of entry. If entrants and incumbents are less likely to share the same markets – i.e. entrants target export markets – positive agglomeration effects dominate.
Our work bears some resemblance to studies examining the relationship between agglomeration and the formation of new firms (e.g. Rosenthal and Strange, 2003; Glaeser and Kerr, 2009). Compared to this line of research, we abstract from de novo entrants that face uncertainty concerning their productivity and focus on self-selection processes of known productivity leaders in their industry. We conclude that sorting processes do occur, but can only be uncovered in a more fine-grained analysis that takes into account ex ante measures of firm heterogeneity and the nature of product markets. Overall, our results provide substantial support for adverse selection due to knowledge spillover asymmetries.
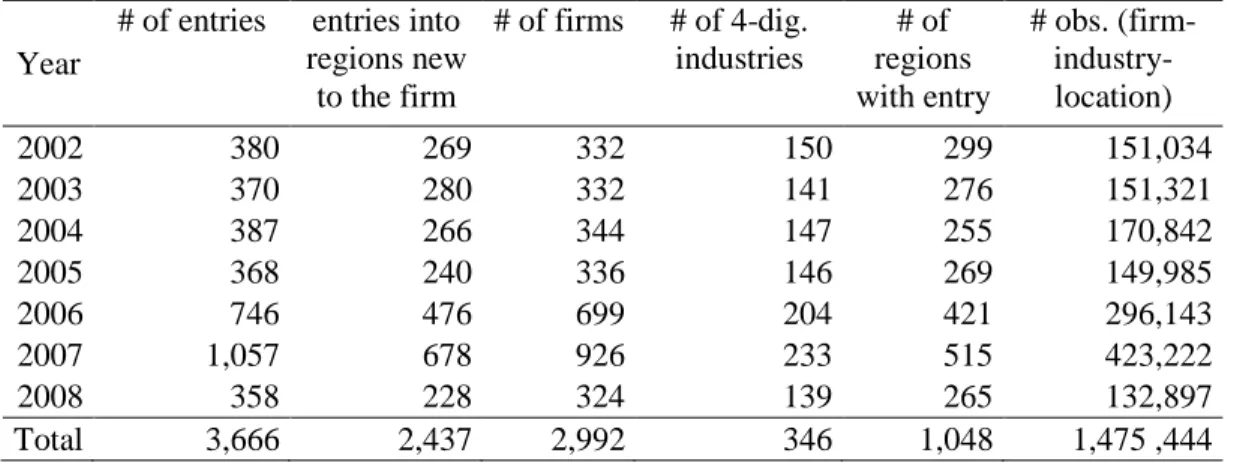
2. DATA AND EMPIRICAL MODEL
We draw on the Census of Manufacturers in Japan to establish new plant entries by firms operating existing plants in the industry during the period 2002-2008. This gives us 3,666 entries by 2,992 multi-plant firms. Figure 1 and Table 1 show the number of entries per year. The peak of new entries in 2006 and 2007 correlates with the (short-lived) growth spurt in the Japanese economy in those years. About two thirds of the plant entries are in regions in which the firms had not operated establishment or headquarter operations before. Entries occurred in 346 four-digit industries and cover 1,049 different towns, wards, cities, and villages in Japan. The latter cover about half of Japan’s territory. The distribution of entries across industries (aggregated for exposition) is shown Table 2. In the location choice models, we conservatively only include locations in the choice set of a four-digit industry if there is evidence that they are ‘at risk’ of receiving investments. Specifically, we include locations in the choice set if during the period 1998-2008 they have received entries in the industry. This reduces the number of observations but keeps the models convergent and computationally feasible.4 On average, the choice sets for
4
6
the entries consist of slightly more than 400 regions (Table 2), and they range from 4 for highly concentrated industries with little entry activity (basic organic chemicals) to 1055 regions for the geographically distributed miscellaneous foods industry.
TFP and Exports
Plant-level TFP is measured using the index number method and TFP data are available from the Japan Industrial Productivity database (see Belderbos et al., 2013). One of the main advantages of the index number method is that it allows for heterogeneity in the production technology of individual firms, while other methods controlling for the endogeneity of inputs (e.g. Olley and Pakes, 1996; Levinsohn and Petrin, 2003) assume an identical production technology among firms within an industry (Van Biesebroeck, 2007; Aw et al., 2001). TFP data are calculated at the level of 58 manufacturing industries (see Table 1). We investigate what position the existing plants of the investing firms active in the same four-digit industry occupy in the distribution of productivity levels across plants in the industry in Japan during the year prior to entry. We calculate, on a yearly basis, the TFP premium as the log of the difference between the firms’ TFP in the existing plant (the output-weighted average TFP in cases in which there are multiple existing plants) and the industry mean (output-weighted) TFP. Leading firms (those with TFP above the mean) have positive values for the TFP premium, while lagging firms (those with TFP below the mean) have negative values for the TFP premium.
Only from 2001 onwards are shipment data for Japanese plants in the census distinguished between exports and domestic shipments. This is the main reason that we have limited the period of analysis to entries from 2002. We use two measures of export activity or export intensity: export by the establishment itself (plant export) and export by the existing plants of the investing firm (firm export).
lead to a violation of the IIA assumption characterizing conditional logit models. We return to this issue below.
7 Agglomeration Variables
In order to disentangle buyer and supplier agglomeration effects from agglomeration effects related to competition and spillovers to rivals, we adopt the specification of Alcacer and Chung (2013) and Gleaser and Kerr (2009). We separate an industry ‘volume’ effect from the characteristics of the broader set of establishments across industries providing agglomeration advantages through supplier linkages, buyer linkages, or knowledge spillovers. Unfortunately, occupational data are not available in enough detail to allow construction of a variable that measures labour market pooling. Industry agglomeration is measured as employment in the industry at the four-digit level.5 The latter level is chosen because, at this detail, direct product market rivalry between firms is more likely (Shankerman et al., 2013). The supplier ‘fit’ variable is constructed as in Gleaser and Kerr (2009) and measures the locations’ relative specialization in related supplier (buyer) industries. To establish specialization, we use yearly input-output tables provided by the JIP database, such that weights vary by year. Formally, we measure supplier agglomeration fit (SF) for industry j in location l (abstracting from time subscripts):
𝑆𝑆𝑗𝑗 = − ∑ ��𝐼𝑗𝑗− 𝐸𝑘𝑘
𝐸𝑘��
𝑗 (1)
where 𝐼𝑗𝑗 is the share of industry k in total inputs of industry j obtained from input-output tables, 𝐸𝑗𝑗 is the number of employees of industry k in location l, and 𝐸𝑗 is total manufacturing
employment in location l. Equation (1) compares the input share of industry k with the employment share in the region of industry k. The smaller the sum of deviations across industries, the stronger the ‘fit’ between local industry structure and the supply needs of industry j. Demand side agglomeration benefits are likely to occur if the region is responsible for a large share of manufacturing employment specifically in the industries that are important buyers of the focal industry j. Buyer fit (BF) is specified as:
𝐵𝑆𝑗𝑗 = �∑ �𝑂𝑗𝑗𝐸𝑘𝑘 𝐸𝑘� 𝑗 � �∑𝑗𝐸𝑗𝑘𝑘� −1 (2) 5
8
where 𝑂𝑗𝑗 is the share of sales of industry j to industry k based on national input-output tables. This share is multiplied with the share of the location in total manufacturing employment in industry k, such that the measure BF is highest if there is a match between the importance of industry k as a buyer for industry j and the importance of location l as a manufacturing location for industry k. As suggested by Gleaser and Kerr (2009), this expression is multiplied by the inverse sum of shares of the location’s employment in total national employment in the buyer industries, in order to ensure independence of industry size.
Other Variables
The analysis controls for the general manufacturing establishment density of the region by including overall manufacturing employment. In order to measure congestion effects, we include a measure of land prices. We obtain information on land prices from the Chiiki-keizai-deta
CD-ROM (Regional Economy Data CD-CD-ROM) published by Toyo Keizai.6 The analysis also controls for ‘internal agglomeration’ or collocation effects due to previous establishments of the firm in the location. We include a dummy variable for the presence of other plants, the presence of headquarters, the distance of the location from headquarters (in cases in which headquarters is located in a different region), and the distance to the nearest other plant of the firm. Land prices are positively related with total manufacturing agglomeration (56 per cent).
Specification and Testing
Within the location choice literature (e.g. Alcacer and Chung, 2007; Head et al., 1995; 1999), the conditional logit model (McFadden, 1974) has been widely used to analyze the location determinants of foreign direct investments. The conditional logit model can be derived from a profit maximization framework under suitable assumptions concerning the distribution of the
6 We also experimented with a regional wage premium variable, using figures obtained by Kawaguchi and Kambayashi (2009). Based on micro data of the Basic Survey on Wage Structure, Kawaguchi and Kambayashi estimated regional wage premiums by estimating a Mincer-type wage function with each worker’s educational attainment, work experience, tenure, factory size, city dummies, and industry dummies as explanatory variables. The wage premium data are available only for one year, however, and appear strongly correlated with the land price variable. Joint inclusion left the wage variable insignificant.
9
error term. A drawback of this model is the restrictive assumption of the independence of irrelevant alternatives (IIA). The IIA property states that for any two alternatives, the ratio of probabilities is independent of the characteristics of any other alternative in the choice set. This characteristic also implies the absence of correlations between error terms across alternatives. At the detailed regional level of analysis, the likelihood of spatial correlation is high, as regional boundaries do not necessarily demarcate the border of agglomeration externalities.7 One solution to this is to estimate mixed logit models that relax the IIA assumption by allowing coefficients to vary. With our choice set of more than 1,000 locations and the close to 4,000 entries, combined with the fact that the random utility maximization (RUM) framework of the mixed logit model has no closed form solution and has to be approximated via simulation techniques, the computational burden of mixed logit models, however, becomes extreme. Another partial solution is to add distance-weighted variables measured across (neighbouring) regions to the models. For instance, an industry agglomeration variable could be added that is the sum of all industry establishments in the focal region and all other (neighbouring) regions weighted by the geographic distance between regions, with weights taken as 1/0.5r (where r represents distance).8 We are planning to extend the analysis in a future version of this paper in these directions.
We test for adverse selection or positive sorting by including the interaction between the four-digit industry agglomeration measure and the TFP premium variable. We also interact the TFP premium variable with the buyer and supplier fit variables to allow for heterogeneity in the agglomeration benefits due to demand and supply externalities. We subsequently examine location decisions separately for different types of entries: plants with and without export activities, plants established by firms with and without prior export activities, and variations of these measures related to the export intensity and the joint occurrence of exports of the plant and the firm.
7 Jofre-Monseny et al. (2011) do suggest that knowledge spillover considerations only play a rol in entry decisions as at a higly localized level.
8
This follows Head and Mayer (2004) and Belderbos, Fukao, Ito, and Letterie (2013). The weight assumes that demand is equally distributed in a circle of radius r.
10 Descriptive Statistics
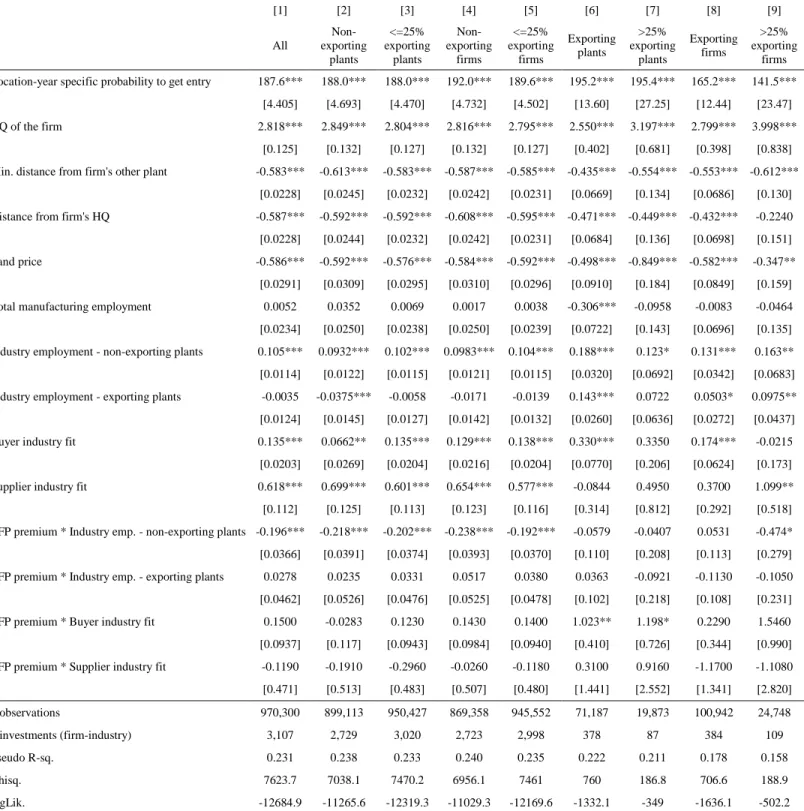
Count and (employment) volume variables are taken in natural logarithms. Descriptives and correlations of the variables are presented in Table 3. On average, the TFP premium of investing firms is positive, which is to be expected, as investing firms are multi-plant firms that generally are expected to have higher productivity. Mean export ratios at the plant and firm level are around two per cent, which is related to the relatively small numbers of exporting plants and exporting firms. Among the 3,666 entries, about 10 per cent (356) are exporting plants, and there are 462 entries by exporting firms. The correlation between the two export measures is a little more than 50 per cent. Among the industry location-specific variables, the correlation between land prices and total manufacturing activity is sizeable (56 per cent) as is to be expected, but no multicollinearity concerns are apparent.
3. RESULTS
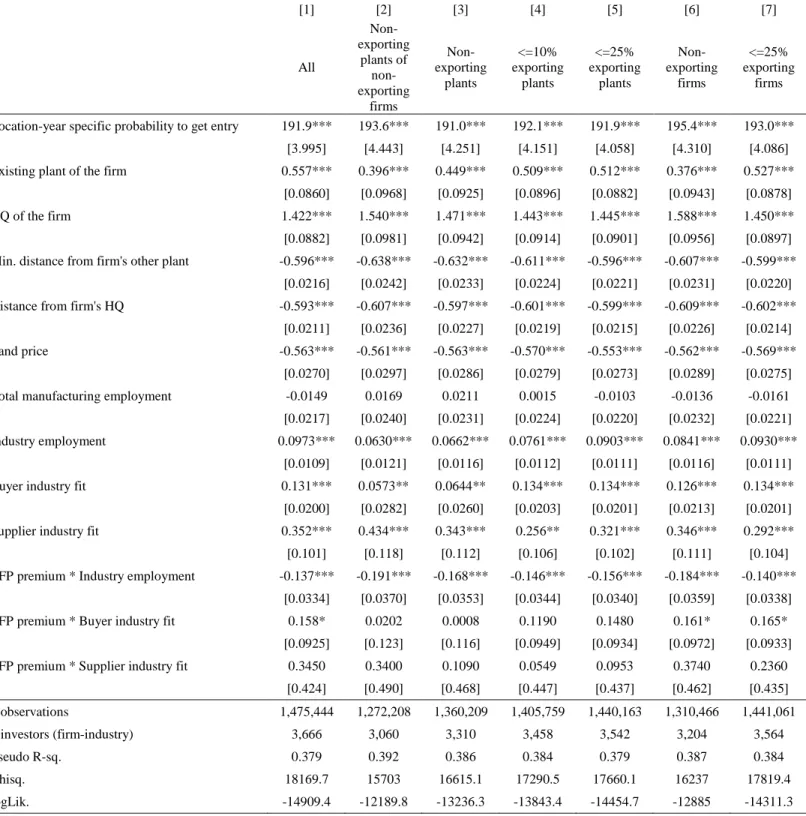
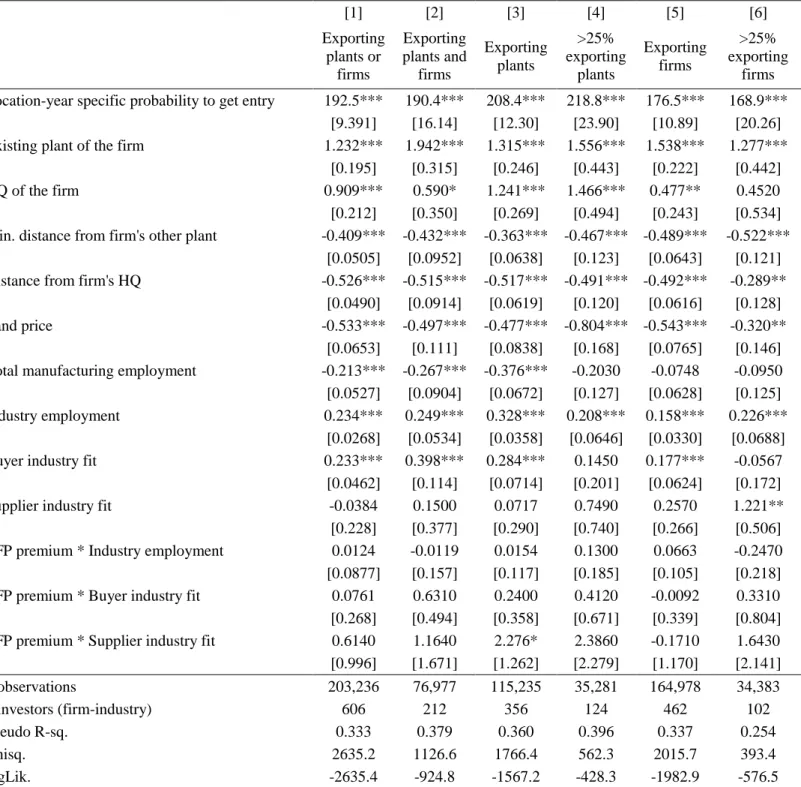
The results of the conditional logit models are presented in models 4-6. Table 4a presents the results of estimations for non-exporting plants and firms or plants and firms with limited export activity; Table 4b presents the results for exporting plants and firms. Tables 5a and 5b are similar but differentiate the four-digit industry agglomeration between exporting and non-exporting establishments. Table 6 presents the results of a number of models with entries restricted to those located in regions that are new to the firm (hence, the variable ‘existing plant of the firm in the region’ is omitted). The first model in Table 4a includes all entries and provides intuitive results. Entry probabilities are positively affected by buyer and supplier fit, same industry agglomeration, overall manufacturing agglomeration, and prior activities in the region by the firm (headquarters and other plants), while land prices and distance to other establishments of the firm exert negative influences. The coefficients of the variable in logarithm can be interpreted as average elasticities (Head et al., 1994). This effect is about four times larger than the effect of same-industry employment. The elasticity of land prices is larger at 0.56.
The variable TFP premium in interaction with industry agglomeration represents the sorting effect. The negative and significant coefficient suggests that, overall, there is adverse selection: productivity leaders are less attracted to same industry agglomeration than productivity laggards
11
are. The magnitude of this adverse selection is relatively small, though. Taking into account the range of values for the TFP premium, it appears that negative overall effects of same industry agglomeration on entry only occurs for firms with a productivity premium close to four standard deviations above the mean. No significant coefficient interaction is observed between the TFP premium and buyer and supplier fit.
As expected, the evidence of negative sorting is much stronger in the case of non-exporting firms and non-exporting plants. If both the firm (with its existing plants) and the newly established plant are non-exporters, the coefficient on industry agglomeration is reduced in magnitude, and the negative coefficient on the interaction effect becomes larger. Negative overall agglomeration effects are now observed for a broader range of TFP premium (about 1.5 standard deviations above the mean). This pattern gets weaker again in close association with the strictness of the definition of non-exporting entries: non-exporting plant (but not necessarily non-exporting firm), and plants with limited exports (< 25 per cent). The same pattern is observed if exporting is defined at the firm level only. In contrast, if the analysis focuses on exporting plants or firms (Table 4b), industry agglomeration effects are larger (in the range of 0.16-0.33) and a significantly negative interaction effect between industry agglomeration and the TFP premium is not observed for any of the models. Hence, there is no evidence of adverse selection when productive entrants aim for export markets and are thus less likely to compete directly with local rivals.
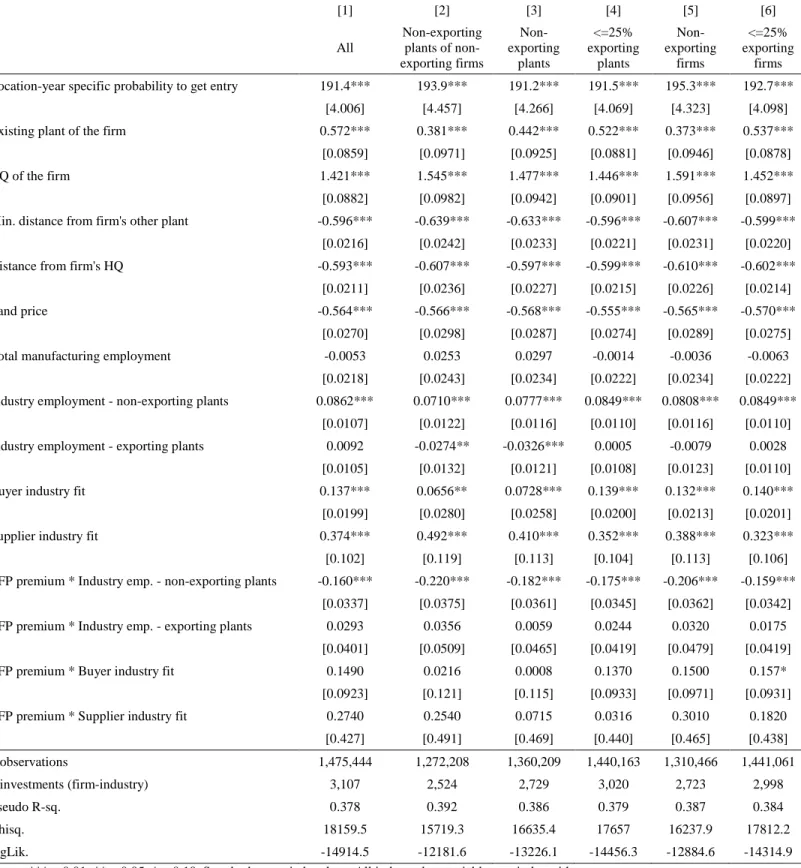
The latter notion is further tested in the models presented in Tables 5a and 5b. Table 5a shows that non-exporting plants and firms are primarily attracted to agglomerations of non-exporting firms in the industry. At the same time, adverse selection occurs due to the agglomeration of non-exporting plants that are the direct rivals of non-exporting entrants, providing further evidence of adverse selection when firms focus on similar markets. The pattern of coefficients follows a similar consistent pattern as in Table 4a. In Table 5b, the models suggest that exporting entries are attracted to agglomeration of both non-exporting and exporting plants. There is no evidence of adverse selection due to sorting related to non-exporting plant or exporting plant agglomeration. The absence of the latter is likely to be related to the large potential variety in export markets. Finally, estimations reported in Table 6 for entries into new regions show a pattern of coefficients consistent with the patterns observed in Tables 5a and 5b.
12
4. CONCLUSIONS
The literature has produced ambiguous findings concerning the salience and direction of the sorting process on entry in response to establishment density and agglomeration. This is related to the variety of sorting influences at play. On the one hand, productive firms may benefit more from the presence of specialized suppliers in agglomerated areas, and they are more likely to survive heightened product market competition. On the other hand, productive firms face greater risks of knowledge dissipation to collocated rival firms and contribute more than they receive in terms of knowledge spillovers. Our study sought to provide more insights into these relationships by linking entries to a clear indicator of ex ante productivity (examining entries by multi-plant firms for which existing productivity levels can be observed), and by distinguishing broader agglomeration effects related to buyer and supplier agglomeration from agglomeration in four-digit industries where market rivalry plays an important role. Our results for manufacturing entries in Japan at the disaggregate regional level provided strong support for the notion of adverse selection in manufacturing entry related to the risk of knowledge dissipation: if existing establishments and the high productivity entrant share the same (domestic) market, knowledge dissipation concerns are salient as increases in competitiveness of incumbent rivals directly affect market share and profitability of the entrant. Industry agglomeration reduces, rather than increases, the likelihood of entry. If entrants and incumbents are less likely to share the same markets – i.e. entrants target export markets – positive agglomeration effects dominate and are generally more pronounced in comparison with entries by non-exporting firms. Hence, knowledge dissipation concerns clearly outweigh possible positive sorting effects due to the stronger competitiveness of productive firms in high density settings. Such sorting may occur but is more likely after entry, when productive firms’ entries induce exit of low productive plants. Similarly, we find no evidence that highly productive firms are more responsive to supplier agglomeration when they choose a location for investment. We conclude that sorting processes on entry do occur, but that these have to be uncovered in a more detailed analysis that takes into account ex ante measures of firm heterogeneity and the nature of product markets.
Our current research agenda focuses on further establishing the robustness of these findings by 1) estimating mixed logit models, 2) incorporating better controls for regional attractiveness, e.g. through a fixed effects analysis, 3) examining cross-regional agglomeration effects by
13
calculating distance-weighted measures, which reduces concerns of spatial correlation, and 4) including a measure of the ‘knowledge fit’ of the regions: the specialization of the regions’ R&D activities in sectors that provide knowledge spillovers to the focal industry (Alcacer and Chung, 2013).
REFERENCES
Alcacer, J., and Delgado, M., 2012. Spatial organization of firms and location choices through
the value chain. Harvard Business School Working Paper 13-025, Harvard Business
School, Boston.
Alcacer, J., 2006Alcacer, J., 2006. Location Choices Across the Value Chain: How Activity and Capability Influence Collocation, Management Science, 52(10), pp.1457-1471.
Alcacer J. and Chung W., 2007. Location Strategies and Knowledge Spillovers, Management
Science, 53(5), pp.760-776.
Alcacer, J., and Chung, W., 2013. Location Strategies for Agglomeration Economies. Strategic
Management Journal, 35(12), pp.1749-1761.
Alcacer, J. and Zhao M., (2012.) Local R&D Strategies and Multi-location Firms: The Role of Internal Linkages, Management Science 58, pp.734-53.
Aw, B. Y., Chen, X., and Roberts, M. J., 2001. Firm-level Evidence on Productivity Differentials and Turnover in Taiwanese Manufacturing. Journal of Development Economics, 66, pp.51-86.
Baldwin, R. E. and Okubo, T., 2006. Heterogeneous Firms, Agglomeration and Economic Geography: Spatial Selection and Sorting, Journal of Economic Geography, 6(3), pp. 323-346.
Belderbos, R. and Carree, M., 2002. The Location of Japanese Investments in China: Agglomeration Effects, Keiretsu, and Firm Heterogeneity, Journal of the Japanese and
International Economies 16, pp.194-211.
Belderbos, R., Fukao, K., Ito, K., Letterie, W., 2013. Global Fixed Capital Investment by Multinational Firms, Economica, 80(318), pp.274-299.
Belderbos, R., Olffen, W. van, and Zou, J., 2011. Generic and Specific Social Learning Mechanisms in Foreign Entry Location Choice. Strategic Management Journal, 32(12), pp.1309-1330.
14
Biesebroeck, J. Van, 2007. Robustness of Productivity Estimates. Journal of Industrial Economics, 55(3), pp.529-569.
Bloom, N., Schankerman, M., and Reenen, J. Van., 2013. Identifying Technology Spillovers and Product Market. Econometrica, 81(4), pp.1347-1393.
Ciccone, A. and Hall, R. E., 1996. Productivity and the Density of Economic Activity, American
Economic Review, 86, pp.54-70.
Combes, P-P., Duranton, G., Gobillon, L., Puga, D., and Roux, S., 2012. The Productivity Advantages of Large Cities: Distinguishing Agglomeration from Firm Selection,
Econometrica, 80(6), pp.2543-2594.
Crozet, M., Mayer, T., and Mucchielli, J-L., 2004. How Do Firms Agglomerate? A Study of FDI in France, Regional Science and Urban Economics, 34, pp.27-–54.
David, P.A. and Rosenbloom, J.L., 1990. Marshallian Factor Market Externalities and the Dynamics of Industrial Location, Journal of Urban Economics, 28(3), pp.349-370.
Ellison, G., Glaeser, E., Kerr, W., 2010. What Causes Industry Agglomeration? Evidence from Coagglomeration Patterns, American Economic Review, 100, pp.1195-1213.
Faberman, J. and Freedman, M., 2013. The Urban Density Premium across Establishments, WP 2013-01, Federal Reserve Bank of Chicago.
Glaeser, E., and Kerr, W., 2009. Local Industrial Conditions and Entrepreneurship: How Much of the Spatial Distribution Can We Explain? Journal of Economics and Management
Strategy, 18(3), pp.623-663.
Good, D. H., Nadiri, M. I., and Sickles, R. C., 1997. Index Number and Factor Demand Approaches to the Estimation of Productivity, in M.H. Pesaran and P. Schmidt (eds.),
Handbook of Applied Econometrics: Vol. 2. Microeconometrics, Oxford, England: Basil
Blackwell, pp. 14-80.
Greenstone, M., Hornbeck, R., and Moretti, E., 2010. Identifying Agglomeration Spillovers: Evidence from Winners and Losers of Large Plant Openings, Journal of Political Economy, 118(3), pp.536-598.
Head, K. and Mayer, T., 2004. Market Potential and the Location of Japanese Investment in the European Union, Review of Economics and Statistics, 86(4), pp.959-972.
15
Head, K., Ries, J., and Swenson, D., 1994. Agglomeration Benefits and Location Choice: Evidence from Japanese Manufacturing Investments in the United States, Journal of International
Economics, 38(3/4), pp. 223-247.
Jofre-Monseny, J., Marin-Lopez, R., and Viladecans-Marsal, E., 2011. The Mechanisms of Agglomeration: Evidence from the Effect of Inter-industry Relations on the Location of New Firms, Journal of Urban Economics, 70 (2-3), pp. 61-74.
Johnson, D. K., 2002. The OECD Technology Concordance (OTC): Patents by Industry of Manufacture and Sector of Use. OECD Science, Technology and Industry Working Papers, (No. 2002/05).
Kawaguchi, D. and Kambayashi, R., 2009. Tokei no Setsugo Data no Sakusei to Riyo: Kogyo Tokei Chosa to Chingin Kozo Kihon Chosa no Rei [Compilation and Use of Merged Micro-Data of Government Surveys: The Case of the Census of Manufactures and the
Basic Survey on Wage Structure], in Yukinobu Kitamura (ed.), Ohyo Mikuro Keiryo Keizai-gaku [Applied Micro-Econometrics], Tokyo, Japan: Nihon Hyoron-sha.
Krugman, P., 1991. Increasing Returns and Economic Geography. Journal of Political Economy, 99(3), pp.483-499.
Leten, B., Belderbos, R. & Van Looy, B., 2007. Technological Diversification, Coherence, and Performance of Firms. Journal of Product Innovation Management, 24(6), pp.567–579. Levinsohn, J., and Petrin, A., 2003. Estimating Production Functions Using Inputs to Control for
Unobservables. Review of Economic Studies, 70(2), pp.317-341.
McFadden, D., 1974. Conditional Logit Analysis of Qualitative Choice Behavior, in Frontiers in
Econometrics Ed P. Zarembka (Academic Press, New York). pp.105-142.
Melitz, M. and Ottaviano, G. I. P., 2008. Market Size, Trade and Productivity, Review of
Economic Studies, 75(1), pp.295-316.
Melo, P. C., Graham, D. J., and Noland, R. B., 2009. A Meta-Analysis of Estimates of Urban Agglomeration Economies, Regional Science and Urban Economics, 39(3), pp.332-342. Nakajima, K., Y. Saito. Y., and I. Uesugi, I., 2012. Measuring Economic Localization: Evidence
from Japanese Firm-level Data, Journal of the Japanese and International Economies, 26(2), pp.201-220.
Olley, S., and Pakes, A., 1996. The Dynamics of Productivity in the Telecommunications Equipment Industry. Econometrica, 64, pp.1263-1297.
16
Rosenthal, S. and Strange, W. C., 2003. Geography, Industrial Organization, and Agglomeration,
Review of Economics and Statistics, 85, pp.377-93.
Shaver, J. M. and Flyer, F., 2000. Agglomeration Economies, Firm Heterogeneity, and Foreign Direct Investment in the United States, Strategic Management Journal, 21(12), pp.1175-1193.
Syverson, C., 2004. Market Structure and Productivity: A Concrete Example, Journal of Political
17 Table 1. New plant establishments by multi-plant firms
Year
# of entries entries into regions new to the firm # of firms # of 4-dig. industries # of regions with entry # obs. (firm- industry-location) 2002 380 269 332 150 299 151,034 2003 370 280 332 141 276 151,321 2004 387 266 344 147 255 170,842 2005 368 240 336 146 269 149,985 2006 746 476 699 204 421 296,143 2007 1,057 678 926 233 515 423,222 2008 358 228 324 139 265 132,897 Total 3,666 2,437 2,992 346 1,048 1,475 ,444
Figure 1. Entries and entries into new regions (in red) per year
0 200 400 600 800 1,000 1,200 2002 2003 2004 2005 2006 2007 2008
# of entries of existing firms # of entries into new regions for the firm-iudustry
18 Table 2. Entries and number of locations per industry
# industries (four digit)
# entries in the sample (2002-2008)
Choice set size (# locations)
JIP Industries Mean S.D. Median Min. Max. 8 Livestock products 3 86 341.9 97.1 316 207 478 9 Seafood products 6 55 356.7 156.4 479 112 527 10 Flour and grain mill products 3 11 141.6 74.8 182 5 189 11 Miscellaneous foods and related products 24 315 614.1 338.7 629 26 1055 12 Prepared animal foods and organic fertilizers 3 12 125.5 3.1 123 123 129 13 Beverages 8 46 196.9 119.2 260 28 316 15 Textile products 61 105 232.7 203.2 172 10 772 16 Lumber and wood products 16 42 317.9 138.9 300 22 684 17 Furniture and fixtures 9 17 444.6 260.6 641 65 733 18 Pulp, paper, and coated and glazed paper 7 34 41.9 12.2 42 28 68 19 Paper products 9 83 282.2 93.9 272 35 375 20 Printing, plate making for printing and bookbinding 5 245 777.1 234.0 831 68 913 21 Leather and leather products 10 3 75.7 43.9 99 25 103 22 Rubber products 13 43 297.3 134.6 355 16 380 23 Chemical fertilizers 3 2 47.0 2.8 47 45 49 24 Basic inorganic chemicals 5 16 111.4 2.7 111 107 117 25 Basic organic chemicals 1 1 4.0 . 4 4 4 26 Organic chemicals 7 24 68.7 33.3 78 6 98 27 Chemical fibers 1 1 25.0 . 25 25 25 28 Miscellaneous chemical products 17 65 82.7 57.2 67 4 188 29 Pharmaceutical products 5 45 106.6 51.1 135 15 142 30 Petroleum products 2 5 17.8 13.0 12 12 41 31 Coal products 3 10 115.9 84.5 55 48 214 32 Glass and its products 8 36 113.0 39.2 131 16 139 33 Cement and its products 4 82 405.5 129.3 411 137 627 34 Pottery 9 8 40.9 25.1 41 12 92 35 Miscellaneous ceramic, stone and clay products 21 46 79.6 87.4 45 5 348 36 Pig iron and crude steel 4 1 13.0 . 13 13 13 37 Miscellaneous iron and steel 20 91 179.8 139.3 171 8 382 38 Smelting and refining of non-ferrous metals 6 11 53.3 20.1 63 23 71 39 Non-ferrous metal products 11 49 125.4 33.1 132 33 159 40 Fabricated constructional and architectural metal products 3 110 814.3 82.6 811 715 996 41 Miscellaneous fabricated metal products 27 241 230.3 123.8 239 38 483 42 General industry machinery 13 93 249.9 109.6 283 27 460 43 Special industry machinery 19 193 329.3 156.6 280 31 676 44 Miscellaneous machinery 9 108 420.1 248.3 606 15 683 45 Office and service industry machines 3 59 230.1 50.3 242 156 288 46 Electrical generating, transmission, distribution and industrial apparatus 7 145 398.4 125.4 398 173 583 47 Household electric appliances 1 21 382.8 18.0 372 360 401 48 Electronic data processing machines, digital and analog computer
equipment and accessories
2 19 378.5 12.5 390 363 390 49 Communication equipment 6 27 104.7 63.2 118 22 196 50 Electronic equipment and electric measuring instruments 7 33 170.8 50.7 183 38 219 51 Semiconductor devices and integrated circuits 2 45 69.2 14.3 78 45 80 52 Electronic parts 7 135 416.1 224.3 354 16 704 53 Miscellaneous electrical machinery equipment 6 28 196.8 82.2 178 43 275 54 Motor vehicles 2 7 45.1 29.1 67 14 69 55 Motor vehicle parts and accessories 1 382 788.8 47.8 767 736 845 56 Other transportation equipment 12 56 84.9 34.3 85 6 142 57 Precision machinery & equipment 18 62 106.6 43.9 118 30 173 58 Plastic products 23 276 401.5 191.6 366 6 629 59 Miscellaneous manufacturing industries 30 36 194.4 158.8 159 18 554 Total 502 3,666 402.5 291.6 343 4 1055 Notes: Choice sets are the locations that have received at least one new plant investment during 1997 to 2008 for each 4 digit industry.
T a bl e 3 . D es cri p ti v e s ta ti st ics a n d c o rrel a ti o n s V ar iab les M ean S .D. M ed ian M in . M ax. [1] T F P p re m iu m ( lo g ., in d u str y m ea n = 0) 0. 0 24 0. 2 42 0. 0 00 -1. 1 21 1. 5 34 [2] E x por ti ng pl an t ( d um m y ) 0. 0 78 0. 2 68 0. 0 00 0. 0 00 1. 0 00 [3] N e w p la n t e x p o rt r atio ( %) 1. 7 55 8. 9 46 0. 0 00 0. 0 00 100 .0 00 [4] E x por ti ng f ir m ( dum m y ) 0. 1 12 0. 3 15 0. 0 00 0. 0 00 1. 0 00 [5] F ir m e x p o rt r atio ( %) 1. 6 20 7. 6 22 0. 0 00 0. 0 00 100 .0 00 [6] L o cat io n -y e ar s p ec if ic p ro b ab ility to g et e n tr y 0. 0 01 0. 0 02 0. 0 00 0. 0 00 0. 0 23 [7] Ex is tin g p la n t o f th e f ir m ( in th e c ity , d u m m y ) 0. 0 03 0. 0 57 0. 0 00 0. 0 00 1. 0 00 [8] H Q o f t h e fi rm ( in th e c ity , d u m m y ) 0. 0 02 0. 0 41 0. 0 00 0. 0 00 1. 0 00 [9] M in. di st anc e f rom f ir m 's ot he r pl ant ( k m ) 364 .2 86 307 .3 38 276 .3 34 0. 9 69 276 6. 43 0 [1 0] Di st an ce f ro m f ir m 's HQ ( k m ) 385 .6 03 309 .1 59 301 .6 44 0. 9 69 274 2. 93 4 [1 1] L and pr ic e ( log .) -0. 4 23 0. 9 46 -0. 4 63 -4. 8 52 2. 1 24 [1 2] T o tal m an u fact u ri n g e m pl oy m ent ( log .) 8. 4 01 1. 2 41 8. 4 92 1. 6 09 11. 60 4 [1 3] Ind us tr y e m pl o y m ent ( sa m e 4 -d ig it in th e c ity , lo g .) 3. 6 25 2. 1 71 3. 8 71 0. 0 00 10. 97 7 [1 4] Ind us tr y e m pl o y m ent non -e xpo rt in g p la nt s ( lo g. ) 3. 5 27 2. 1 24 3. 7 84 0. 0 00 10. 12 8 [1 5] Ind us tr y e m pl o y m ent e x por ti ng pl ant s (l og .) 0. 4 65 1. 5 46 0. 0 00 0. 0 00 10. 41 8 [1 6] B uy er i ndus tr y f it i nde x 0. 4 24 0. 6 43 0. 2 27 0. 0 00 29. 49 0 [1 7] S u p p lie r i n d u str y f it in d ex -1. 1 84 0. 2 25 -1. 1 77 -1. 8 02 -0. 2 81 Co rre la ti o n [1] [2] [3] [4] [5] [6] [7] [8] [9] [1 0] [1 1] [1 2] [1 3] [1 4] [1 5] [1 6] [1 7] [1] 1. 0 00 [2] 0. 0 99 1. 0 00 [3] 0. 0 97 0. 6 74 1. 0 00 [4] 0. 1 57 0. 5 14 0. 3 81 1. 0 00 [5] 0. 0 93 0. 4 26 0. 5 10 0. 5 99 1. 0 00 [6] 0. 0 03 0. 0 09 0. 0 09 0. 0 10 0. 0 07 1. 0 00 [7] 0. 0 05 0. 0 07 0. 0 06 0. 0 08 0. 0 04 0. 0 49 1. 0 00 [8] 0. 0 00 0. 0 01 0. 0 01 0. 0 00 0. 0 01 0. 0 53 0. 5 59 1. 0 00 [9] -0. 0 45 -0. 0 66 -0. 0 44 -0. 0 86 -0. 0 49 -0. 0 81 -0. 0 67 -0. 0 44 1. 0 00 [1 0] -0. 0 34 -0. 0 58 -0. 0 39 -0. 0 68 -0. 0 48 -0. 0 92 -0. 0 46 -0. 0 51 0. 9 01 1. 0 00 [1 1] 0. 0 09 0. 0 22 0. 0 19 0. 0 21 0. 0 14 0. 2 16 0. 0 15 0. 0 27 -0. 2 00 -0. 2 32 1. 0 00 [1 2] 0. 0 08 0. 0 25 0. 0 21 0. 0 27 0. 0 18 0. 4 46 0. 0 37 0. 0 33 -0. 1 83 -0. 2 08 0. 5 33 1. 0 00 [1 3] 0. 0 07 0. 0 04 -0. 0 13 0. 0 23 0. 0 09 0. 1 97 0. 0 55 0. 0 38 -0. 1 16 -0. 1 24 0. 1 93 0. 4 09 1. 0 00 [1 4] 0. 0 06 -0. 0 07 -0. 0 23 0. 0 11 -0. 0 01 0. 1 96 0. 0 52 0. 0 37 -0. 1 09 -0. 1 16 0. 1 91 0. 4 02 0. 9 74 1. 0 00 [1 5] 0. 0 07 0. 0 53 0. 0 34 0. 0 75 0. 0 54 0. 1 22 0. 0 32 0. 0 26 -0. 0 87 -0. 0 97 0. 0 78 0. 1 90 0. 4 04 0. 2 60 1. 0 00 [1 6] 0. 0 06 0. 0 08 0. 0 06 0. 0 11 0. 0 09 -0. 0 12 0. 0 28 0. 0 19 -0. 0 04 -0. 0 01 -0. 0 64 -0. 0 68 0. 2 58 0. 2 30 0. 2 69 1. 0 00 [1 7] -0. 0 07 -0. 0 62 -0. 0 28 -0. 0 95 -0. 0 57 -0. 1 02 0. 0 15 0. 0 06 0. 1 18 0. 1 40 -0. 1 72 -0. 2 92 -0. 1 09 -0. 1 19 0. 0 11 0. 3 19 1. 0 00 19
20
Table 4a. Conditional logit estimates: all entries, non/limited exporters
[1] [2] [3] [4] [5] [6] [7] All Non-exporting plants of non-exporting firms Non-exporting plants <=10% exporting plants <=25% exporting plants Non-exporting firms <=25% exporting firms
Location-year specific probability to get entry 191.9*** 193.6*** 191.0*** 192.1*** 191.9*** 195.4*** 193.0***
[3.995] [4.443] [4.251] [4.151] [4.058] [4.310] [4.086]
Existing plant of the firm 0.557*** 0.396*** 0.449*** 0.509*** 0.512*** 0.376*** 0.527***
[0.0860] [0.0968] [0.0925] [0.0896] [0.0882] [0.0943] [0.0878]
HQ of the firm 1.422*** 1.540*** 1.471*** 1.443*** 1.445*** 1.588*** 1.450***
[0.0882] [0.0981] [0.0942] [0.0914] [0.0901] [0.0956] [0.0897] Min. distance from firm's other plant -0.596*** -0.638*** -0.632*** -0.611*** -0.596*** -0.607*** -0.599***
[0.0216] [0.0242] [0.0233] [0.0224] [0.0221] [0.0231] [0.0220]
Distance from firm's HQ -0.593*** -0.607*** -0.597*** -0.601*** -0.599*** -0.609*** -0.602***
[0.0211] [0.0236] [0.0227] [0.0219] [0.0215] [0.0226] [0.0214]
Land price -0.563*** -0.561*** -0.563*** -0.570*** -0.553*** -0.562*** -0.569***
[0.0270] [0.0297] [0.0286] [0.0279] [0.0273] [0.0289] [0.0275]
Total manufacturing employment -0.0149 0.0169 0.0211 0.0015 -0.0103 -0.0136 -0.0161
[0.0217] [0.0240] [0.0231] [0.0224] [0.0220] [0.0232] [0.0221]
Industry employment 0.0973*** 0.0630*** 0.0662*** 0.0761*** 0.0903*** 0.0841*** 0.0930***
[0.0109] [0.0121] [0.0116] [0.0112] [0.0111] [0.0116] [0.0111]
Buyer industry fit 0.131*** 0.0573** 0.0644** 0.134*** 0.134*** 0.126*** 0.134***
[0.0200] [0.0282] [0.0260] [0.0203] [0.0201] [0.0213] [0.0201]
Supplier industry fit 0.352*** 0.434*** 0.343*** 0.256** 0.321*** 0.346*** 0.292***
[0.101] [0.118] [0.112] [0.106] [0.102] [0.111] [0.104]
TFP premium * Industry employment -0.137*** -0.191*** -0.168*** -0.146*** -0.156*** -0.184*** -0.140***
[0.0334] [0.0370] [0.0353] [0.0344] [0.0340] [0.0359] [0.0338]
TFP premium * Buyer industry fit 0.158* 0.0202 0.0008 0.1190 0.1480 0.161* 0.165*
[0.0925] [0.123] [0.116] [0.0949] [0.0934] [0.0972] [0.0933]
TFP premium * Supplier industry fit 0.3450 0.3400 0.1090 0.0549 0.0953 0.3740 0.2360
[0.424] [0.490] [0.468] [0.447] [0.437] [0.462] [0.435] # observations 1,475,444 1,272,208 1,360,209 1,405,759 1,440,163 1,310,466 1,441,061 # investors (firm-industry) 3,666 3,060 3,310 3,458 3,542 3,204 3,564 Pseudo R-sq. 0.379 0.392 0.386 0.384 0.379 0.387 0.384 Chisq. 18169.7 15703 16615.1 17290.5 17660.1 16237 17819.4 logLik. -14909.4 -12189.8 -13236.3 -13843.4 -14454.7 -12885 -14311.3
21
Table 4b. Conditional logit estimates: exporting firms and plants
[1] [2] [3] [4] [5] [6] Exporting plants or firms Exporting plants and firms Exporting plants >25% exporting plants Exporting firms >25% exporting firms Location-year specific probability to get entry 192.5*** 190.4*** 208.4*** 218.8*** 176.5*** 168.9***
[9.391] [16.14] [12.30] [23.90] [10.89] [20.26] Existing plant of the firm 1.232*** 1.942*** 1.315*** 1.556*** 1.538*** 1.277***
[0.195] [0.315] [0.246] [0.443] [0.222] [0.442] HQ of the firm 0.909*** 0.590* 1.241*** 1.466*** 0.477** 0.4520 [0.212] [0.350] [0.269] [0.494] [0.243] [0.534] Min. distance from firm's other plant -0.409*** -0.432*** -0.363*** -0.467*** -0.489*** -0.522***
[0.0505] [0.0952] [0.0638] [0.123] [0.0643] [0.121] Distance from firm's HQ -0.526*** -0.515*** -0.517*** -0.491*** -0.492*** -0.289**
[0.0490] [0.0914] [0.0619] [0.120] [0.0616] [0.128] Land price -0.533*** -0.497*** -0.477*** -0.804*** -0.543*** -0.320**
[0.0653] [0.111] [0.0838] [0.168] [0.0765] [0.146] Total manufacturing employment -0.213*** -0.267*** -0.376*** -0.2030 -0.0748 -0.0950 [0.0527] [0.0904] [0.0672] [0.127] [0.0628] [0.125] Industry employment 0.234*** 0.249*** 0.328*** 0.208*** 0.158*** 0.226***
[0.0268] [0.0534] [0.0358] [0.0646] [0.0330] [0.0688]
Buyer industry fit 0.233*** 0.398*** 0.284*** 0.1450 0.177*** -0.0567 [0.0462] [0.114] [0.0714] [0.201] [0.0624] [0.172] Supplier industry fit -0.0384 0.1500 0.0717 0.7490 0.2570 1.221** [0.228] [0.377] [0.290] [0.740] [0.266] [0.506] TFP premium * Industry employment 0.0124 -0.0119 0.0154 0.1300 0.0663 -0.2470
[0.0877] [0.157] [0.117] [0.185] [0.105] [0.218]
TFP premium * Buyer industry fit 0.0761 0.6310 0.2400 0.4120 -0.0092 0.3310 [0.268] [0.494] [0.358] [0.671] [0.339] [0.804] TFP premium * Supplier industry fit 0.6140 1.1640 2.276* 2.3860 -0.1710 1.6430 [0.996] [1.671] [1.262] [2.279] [1.170] [2.141] # observations 203,236 76,977 115,235 35,281 164,978 34,383 # investors (firm-industry) 606 212 356 124 462 102 Pseudo R-sq. 0.333 0.379 0.360 0.396 0.337 0.254 Chisq. 2635.2 1126.6 1766.4 562.3 2015.7 393.4 logLik. -2635.4 -924.8 -1567.2 -428.3 -1982.9 -576.5
22
Table 5a. Conditional logit estimates: all entries, non/limited exporters / agglomeration heterogeneity
[1] [2] [3] [4] [5] [6] All Non-exporting plants of non-exporting firms Non-exporting plants <=25% exporting plants Non-exporting firms <=25% exporting firms Location-year specific probability to get entry 191.4*** 193.9*** 191.2*** 191.5*** 195.3*** 192.7***
[4.006] [4.457] [4.266] [4.069] [4.323] [4.098]
Existing plant of the firm 0.572*** 0.381*** 0.442*** 0.522*** 0.373*** 0.537***
[0.0859] [0.0971] [0.0925] [0.0881] [0.0946] [0.0878]
HQ of the firm 1.421*** 1.545*** 1.477*** 1.446*** 1.591*** 1.452***
[0.0882] [0.0982] [0.0942] [0.0901] [0.0956] [0.0897]
Min. distance from firm's other plant -0.596*** -0.639*** -0.633*** -0.596*** -0.607*** -0.599***
[0.0216] [0.0242] [0.0233] [0.0221] [0.0231] [0.0220]
Distance from firm's HQ -0.593*** -0.607*** -0.597*** -0.599*** -0.610*** -0.602***
[0.0211] [0.0236] [0.0227] [0.0215] [0.0226] [0.0214]
Land price -0.564*** -0.566*** -0.568*** -0.555*** -0.565*** -0.570***
[0.0270] [0.0298] [0.0287] [0.0274] [0.0289] [0.0275]
Total manufacturing employment -0.0053 0.0253 0.0297 -0.0014 -0.0036 -0.0063
[0.0218] [0.0243] [0.0234] [0.0222] [0.0234] [0.0222]
Industry employment - non-exporting plants 0.0862*** 0.0710*** 0.0777*** 0.0849*** 0.0808*** 0.0849***
[0.0107] [0.0122] [0.0116] [0.0110] [0.0116] [0.0110]
Industry employment - exporting plants 0.0092 -0.0274** -0.0326*** 0.0005 -0.0079 0.0028
[0.0105] [0.0132] [0.0121] [0.0108] [0.0123] [0.0110]
Buyer industry fit 0.137*** 0.0656** 0.0728*** 0.139*** 0.132*** 0.140***
[0.0199] [0.0280] [0.0258] [0.0200] [0.0213] [0.0201]
Supplier industry fit 0.374*** 0.492*** 0.410*** 0.352*** 0.388*** 0.323***
[0.102] [0.119] [0.113] [0.104] [0.113] [0.106]
TFP premium * Industry emp. - non-exporting plants -0.160*** -0.220*** -0.182*** -0.175*** -0.206*** -0.159***
[0.0337] [0.0375] [0.0361] [0.0345] [0.0362] [0.0342]
TFP premium * Industry emp. - exporting plants 0.0293 0.0356 0.0059 0.0244 0.0320 0.0175
[0.0401] [0.0509] [0.0465] [0.0419] [0.0479] [0.0419]
TFP premium * Buyer industry fit 0.1490 0.0216 0.0008 0.1370 0.1500 0.157*
[0.0923] [0.121] [0.115] [0.0933] [0.0971] [0.0931]
TFP premium * Supplier industry fit 0.2740 0.2540 0.0715 0.0316 0.3010 0.1820
[0.427] [0.491] [0.469] [0.440] [0.465] [0.438] # observations 1,475,444 1,272,208 1,360,209 1,440,163 1,310,466 1,441,061 # investments (firm-industry) 3,107 2,524 2,729 3,020 2,723 2,998 Pseudo R-sq. 0.378 0.392 0.386 0.379 0.387 0.384 Chisq. 18159.5 15719.3 16635.4 17657 16237.9 17812.2 logLik. -14914.5 -12181.6 -13226.1 -14456.3 -12884.6 -14314.9
![Table 3. Descriptive statistics and correlations VariablesMeanS.D.MedianMin. Max. [1]TFP premium (log., industry mean = 0)0.0240.2420.000-1.1211.534 [2]Exporting plant (dummy) 0.0780.2680.0000.0001.000 [3]New plant export ratio (%)1.7558.9460.0000.000100](https://thumb-ap.123doks.com/thumbv2/123deta/6848225.739214/29.918.87.837.75.1111/descriptive-statistics-correlations-variablesmeans-medianmin-premium-industry-exporting.webp)