Development of remediation technique utilizing plant-microbe synergy on
persistent organic pollutants contaminated soil
University of Yamanashi, Graduate School Department of Education
Integrated Graduate School of Medicine, Engineering and Agricultural
Sciences PhD Program
March 2020
i Table of Contents
CHAPTER 1 INTRODUCTION ... 1
1.1. Background ... 1
1.2. Endophytic bacteria and their diversity... 2
1.3. Plant growth promoting bacteria ... 5
1.4. Bacteria-assisted remediation of problem soils ... 6
1.4.1. Soil salinity and rhizosphere bacteria ... 6
1.4.2. Persistent organic pollutants and bacteria ... 9
CHAPTER 2 DIVERSITY OF ENDOPHYTIC BACTERIAL COMMUNITIES IN CUCUMBER (CUCUMIS SATIVUS L.) ... 12
2.1. Introduction ... 12
2.2. Materials and methods ... 13
2.2.1. Plant material ... 13
2.2.2. Sample preparation for endophytic bacteria ... 14
2.2.3. Culturable endophytic bacteria ... 15
2.2.3.1. Isolation ... 15
2.2.3.2. DNA Extraction and PCR amplification ... 15
2.2.3.3. PCR-Restriction Fragment Length Polymorphism (RFLP) ... 15
2.2.3.4. 16S rRNA gene sequencing and submission of sequences ... 16
2.2.4. Non-culturable endophytic bacteria ... 16
2.2.5. Data Analysis ... 18
2.3. Results ... 18
2.3.1. Number of culturable isolates and non-culturable operational taxonomic units ... 18
2.3.2. The diversity across different stages ... 19
2.3.3. Dynamic change in endophytic bacteria ... 25
2.3.4. Comparison of endophytic bacteria between both geographical locations ... 32
2.3.5. Differences between culturable and non-culturable endophytic bacteria ... 33
2.4. Discussion ... 33
2.5. Summary ... 36
CHAPTER 3 PLANT GROWTH-PROMOTING ABILITY OF ENDOPHYTIC BACTERIA ... 37
3.1. Introduction ... 37
3.2. Materials and methods ... 40
ii
3.2.2. PGP screening ... 40
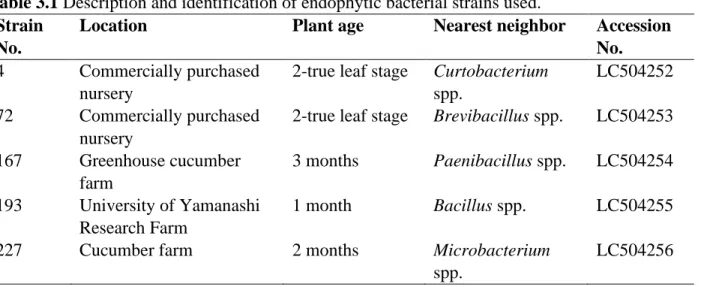
3.2.3. Characterization and 16S rRNA sequencing-based identification of selected strains ... 41
3.2.4. Pot experiments ... 42
3.2.5. Field experiments ... 44
3.2.6. Metabolome analysis... 44
3.3. Results ... 46
3.3.1. Isolation and screening of isolates ... 46
3.3.2. Pot experiments ... 46
3.3.3. PGP trait characterization of selected strains ... 50
3.3.4. Field experiments ... 50
3.3.5. Metabolome analysis... 53
3.4. Discussion ... 61
3.4.1. PGP ability of endophytic bacteria ... 61
3.4.2. Plant growth promotion by endophytic bacteria in the field experiment ... 62
3.4.3. Metabolomic analysis ... 64
3.5. Summary ... 69
CHAPTER 4 ... 71
APPLICATION OF BACTERIA IN AMELIORATION OF SALINITY ... 71
4.1. Introduction ... 71
4.2. Materials and methods ... 73
4.2.1. Soil and Plant Material ... 73
4.2.2. Isolation of rhizosphere bacteria ... 74
4.2.3. Screening and characterization of rhizosphere bacteria ... 74
4.2.4. Assay for plant growth promoting ability and PGP traits of selected strains... 75
4.2.5. 16S rRNA analysis of selected bacteria ... 75
4.2.6. Pot experiment for plant growth promoting ability of selected strains ... 75
4.2.7. Statistical Analysis ... 76
4.3. Results ... 76
4.3.1. Isolation, and characterization of rhizosphere bacteria ... 76
4.3.2. Assay for plant growth promoting ability ... 78
4.3.3. 16S rRNA analysis of selected bacteria ... 79
4.3.4. Assay for PGP traits of selected strains ... 80
4.3.5. Pot experiment for plant growth promoting ability of selected strains ... 81
4.4. Discussion ... 82
iii
CHAPTER 5 PERSISTENT ORGANIC POLLUTANTS (POPS) DEGRADING BACTERIA ... 86
5.1. Introduction ... 86
5.2. Materials and Methods ... 89
5.2.1. Site description, soil and plant material ... 89
5.2.2. Chemicals and measurement of DDTs from soil ... 91
5.2.3. Isolation and identification of bacteria ... 91
5.2.3.1. Isolation from DDT-contaminated soil from Pakistan ... 91
5.2.3.2. Isolation from stem and root endosphere ... 92
5.2.4. Identification of bacteria ... 92
5.2.5. DDD, DDE and PCP degradation assays and metabolites detection ... 92
5.2.5.1. Petri-plate assay ... 92
5.2.5.2. Degradation test in broth culture ... 92
5.2.6. Time-course degradation of DDD and PCP by strains 885C and 14 ... 93
5.2.7. Biomass determination of strain 885C ... 94
5.3. Results ... 94
5.3.1. DDTs in Pakistan soil ... 94
5.3.2. Isolation of bacteria and screening for degradation of DDD, DDE and PCP ... 95
5.3.3. Time course degradation of DDD and PCP ... 97
5.3.4. Putative DDD degradation pathway ... 98
5.4. Discussion ... 100
5.4.1. Degradation of DDD by strain 885C ... 100
5.4.2. Degradation of PCP by strain 14 ... 103
5.4.3. Endophytic bacterial degradation of DDTs ... 104
5.5. Summary ... 105
CHAPTER 6 ENDOPHYTIC BACTERIA-ASSISTED PHYTOREMEDIATION ... 106
6.1. Introduction ... 106
6.2. Materials and methods ... 107
6.2.1. Isolation and characterization of endophytic bacteria ... 107
6.2.2. Plant-uptake assay ... 107
6.2.3. Quantification of pollutants’ in soil and plant ... 108
6.3. Results ... 108
6.3.1. PCP uptake by cucumber plants ... 108
6.3.2. DDD and DDE uptake by cucumber plants ... 109
6.4. Discussion ... 110
iv
CHAPTER 7 CONCLUSIONS ... 114 ACKNOWLEDGEMNETS ... 118 REFERENCES ... 119
1 CHAPTER 1 INTRODUCTION
1.1. Background
Continuous rise in world population asks for increase in food production which has been achieved using input-intensive agriculture. However, the food production is facing certain challenges including those of plant nutrition and soil pollution. Plant nutrition has issues regarding widely used sole-application of chemical fertilizers which are: increase in fertilizer prices, exhaustion of raw materials, environmental pollution, and decreasing soil fertility status (Mahmood and Kataoka, 2018). Another important and emerging issue is the effect of such chemicals on functionality of natural plant growth nutrition factories; the microbes (Berg and Koskella, 2018). Therefore, it is necessary to search for sustainable plant nutrition solutions, which can not only sustain crop production, but also maintain soil health and productivity.
Another emerging issue is that of soil degradation, which is threatening food security worldwide. This degradation is of several types among which magnitude of soil salinization and organic pollutants contamination is amongst the largest contributors. Soil salinity is intimidating crop production around the globe and is affecting approximately 20% of irrigated land (Qadir et al., 2014). Under the changing climate and rising sea levels, it is foreseen that coastal areas would face the problem of salinization (Dasgupta et al., 2015). Similarly, irrigation water has been among major causes of salinity in some parts of the world (Abbas et al., 2013). The salinization of soil impacts livelihood of farmers due to severe effects on crop yields besides damaging global food production. Similarly, soil pollution is another major cause of soil degradation encompassing different pollutants, where persistent organic pollutants (POPs) have been termed alarmingly dangerous due to their effect on human and animals health. POPs were categorized in 2001 under Stockholm Convention and until today 32 pollutants have been categorized aimed at a) elimination and b) restriction of their use and production, besides c) reducing their unintentional release (Secretariat of the Stockholm
2
Convention). These POPs not only pose threat of entry into food chain (Namiki et al., 2013), but also affect plant growth (Zhang et al., 2017). Therefore, soils facing issues of salinity and POPs-contamination need to be cleaned for better and safe crop production.
Sustainable agriculture and utilization of degraded soils hold the answer to above questions. Both the approaches can be augmented with the use of microorganisms which through several mechanisms help plants grow better, overcome stresses and/or thrive in stress environments. These microbes have been termed as plant growth promoting microorganisms. Other classes of microbes have also been found which degrade pollutants and help plants ameliorate the salinity stress. These microbes constitute epiphytes and endophytes where endophytes have gained priority due to certain merits over those of free-living microbes. Such microbes can thus be utilized in addressing the issues like those of crop nutrient requirement, soil salinity and organic pollutants.
1.2. Endophytic bacteria and their diversity
The bacteria which spend at least part of their life within the plant body without showing symptoms of disease are termed as endophytic bacteria. The endophytic bacteria are ubiquitous in nature and colonize all type of plants (Santoyo et al., 2016). The reports from of isolation of such bacteria from different plants bring forward the concept of interactions between plants, and microbes beyond just rhizosphere (reviewed by Hardoim et al., 2015). The endophytes bacteria help the plant grow better, like that of rhizosphere microbes, through several mechanisms encompassing production, and competition (Mahmood and Kataoka, 2019). The widely accepted direct mechanisms include release of certain hormones, fixing nitrogen, solubilizing phosphorus, and sequestering iron. Among the indirect mechanisms; physical, and chemical competition with the pathogenic microbes, induced systemic resistance, 1-aminocyclopropane-1-carboxylate (ACC) deaminase, and siderophore production can be reported (Santoyo et al., 2016).
3
The endophytic environment provides stability as compared to phyllosphere, and rhizosphere, thus ensuring stress-free functionality of the microbes. The soil microbes, on the other hand, must cope with the competition posed by indigenous microbial community (Mahmood et al., 2016), thus the endophytes have a plus. For instance, the diversity of soil environments; be it polluted with organics, or inorganics, or the hurdles of carbon to nitrogen ratios limit the functionality of rhizosphere microbes. Simultaneous problems of desiccation, and exposure to extreme climatic parameters limit their functioning and survival so the endophytes become advantageous.
The plants and endophytic bacteria evolved simultaneously and comprise certain kinds of relationships among themselves. These synergic and/or antagonistic associations constitute several functions, helping or damaging one or both organisms (Lundberg et al., 2012; van der Lelie et al., 2009). The plants being the employer in most cases look to recruit the desired functional microbes (Lemanceau et al., 2017), and consequently, they search for the best candidates in the available pools; rhizosphere (Schulz and Boyle, 2005) and phyllosphere in endophytic instances. The frequently changing rhizosphere as compared to endosphere proposes difficulties to the microbial community triggering certain evolutionary mechanisms. Besides, physical transport of microbes also leads to much diverse soil microbial community pool (Hooper et al., 2008). The temporal and spatial changes in plant endophytic community are therefore apparent. The extent of diversity among microbes can be enormous, as around 3000 new genera have been published in last 40 years (Parte, 2018), yet major part remains undiscovered.
Diversity derives the survival of the organisms. The microbial survival leads to upper trophic levels’ survival thus the formers’ density and diversity holds salient position. The changing climate scenarios having mixed effect on functionality and plant-associations of the microbes (Compant et al., 2010b) are joined by varying crop husbandry and soil conditions.
4
Thus, under such circumstances it is need of the time to look for microbes which can help plants sustain under diverse and adverse environments besides tolerating such instances. Similarly, the increasing role of biofertilizers in sustainable agriculture asks for suitable candidates for inoculation. This suitability varies with the objectives, however single strain contributing to several plant growth-promoting (PGP) abilities would be preferable. Similarly, the soil contamination getting complex with every day, especially in developing countries, poses survival and functionality hurdles for the microbes in rhizosphere. Eevers et al. (2016) reported the alteration in endophytic community due to organic pollutant incidence. So, the microbes tolerant to such sites besides the targeted function can be chosen. Finally, the microbes are source of novel metabolites (reviewed by Demain and Sanchez, 2009) and pathways. This characteristic of microbes can be used conventionally besides their potential for biotechnology.
The search for best suitable microbes asks for thorough study of microbial pools. If the sampling stage, for example, does not coincide with the targeted functional microbes, then they would be seldom found. Thus, exploring the diversity of microbes linked with the growth stages stands vital. Past studies chasing microbial diversity bring forward different aspects studied. Microbial community is mainly determined by the genotype and environmental factors (Andrew et al., 2012). The bacterial community in Arabidopsis was found to be influenced by soil type and the host (Bulgarelli et al., 2012). Another instance from Arabidopsis explored the effect of organs too besides the habitat, and found both factors structuring the bacterial community within roots and leaves (Bodenhausen et al., 2013). Among the edaphic factors, the shifts in bacterial community corresponded to changes in pH (Hardoim et al., 2012). Another study documents the prominent effect of microbe-microbe interaction determining the endophytic community besides the abiotic and genotypic factors (Agler et al., 2016).
5
Except for the habitat- and genotype-related community structuring, the rhizosphere bacterial community determines the endophytic community when it comes to temporal diversity follow up. In grapevine, different organ-associated microbes emerged mainly from that of rhizosphere (Zarraonaindia et al., 2015). Specifically, culturable endophytic bacterial diversity checked in sugarcane resulted in 32 strains belonging mainly to Enterobacteriaceae, Bacilli, Microbacteriaceae and Pseudomonadaceae (Magnani et al., 2010). Another study exploring the cultivable and non-cultivable endophytic bacteria concluded the mixed trend before transplanting in the field where diversity increased (Miguel et al., 2016). Correa-Galeote et al. (2018) checked the maize endophytic bacteria diversity and found profound effect of continuous cropping over fallow soil. Ulrich et al. (2008) explored the culturable endophytic bacteria diversity in field grown poplar and found the effect of plant genotype on bacterial community. The studies observing temporal diversity include a rhizosphere study in canola bringing forward the effect of environment (Farina et al., 2012), yet the endophytic diversity, particularly with respect to growing stages is seldom studied to best of our knowledge. Another diversity-check gap remains in plants as the only such study has been carried out in eucalyptus tree (Miguel et al., 2016).
1.3. Plant growth promoting bacteria
The environmental, and sustainability factors are major motives behind the preference of biological or organic fertilizers over the chemical ones. The biological fertilizers also termed as biofertilizers include certain microorganisms, plant growth promoting microorganisms (PGPM) including plant growth promoting bacteria (PGPB), fungi (PGPF) and cyanobacteria (PGPC). Potential of beneficial microorganisms in enhancing crop productivity and combating stress conditions has been widely discussed and reviewed (Ahemad and Kibret, 2014; Glick, 2012; Goswami et al., 2016; Hayat et al., 2010; Santoyo et al., 2016; Souza et al., 2015b). PGPB includes the bacteria showing positive effects on the plants, either free living in the
6
rhizosphere, or endophytic; living within the plants without showing symptoms of any damage, and enhance the plant growth and stress tolerance through different mechanisms viz. symbiotic and non-symbiotic nitrogen fixation, facilitation of nutrient uptake including phosphorus, potassium and iron, release of certain metabolites involved in plant growth promotion and stress tolerance, and remediation of organic and inorganic pollutants (Ahemad and Kibret, 2014; Meena et al., 2015; Santoyo et al., 2016). They have been used in wide plants and positive effects have been studied (reviewed by Berg et al., 2016; Saha et al., 2016; Yakhin et al., 2017). However, increase in stress environments like those of saline, polluted and drought affected etc. are increasing throughout the world and plant survival is at stake in most environments. These challenges are posing difficulties for conventional methods, thus PGPM come as attractive alternative. Similarly, application of such plant beneficial microbes is usually studied for their effect on plant growth rather the crop yield. Hence, there are gaps how the application can help plants grow better in field as applied inoculum has to survive and compete. Also, long-term application of plant growth promoting bacteria is hypothesized to reduce the chemical fertilizer requirement which needs to be investigated in real scale.
1.4. Bacteria-assisted remediation of problem soils 1.4.1. Soil salinity and rhizosphere bacteria
Soil salinity is among major abiotic stresses and severely affects plant growth and yield because most of the crop plants are sensitive to salt (Shrivastava and Kumar, 2015). Therefore, soils with even slightest concentrations of salts are unable to be cultivated or perform poorly when cultivated. Changing climate, mismanagement and other factors are making it worse. Utilization of such soils is thus needed which will not only enhance the productivity but also can improve the soil conditions.
Plant-microbe interaction as discussed above has developed certain shapes including antagonism, and synergism, where the plants, besides providing space, and food, also utilizes
7
such relationships for coping biotic, and abiotic stresses. Same is the case in the salt-loving plants or halophytes which in combination with epiphytic and endophytic microbes cope the stress more efficiently (Ruppel et al., 2013). The microbes in the discussion include fungi, bacteria, and archaea; which have different extent of salinity tolerance and ameliorating the stress. Instances of such microbes from extreme environments, and their adaptation to the particular locale (Imhoff, 2017; Siliakus et al., 2017), especially isolations from saline habitats indicate that the microbes have promising ability to counter such stress.
Microbes associated with saline habitats or halophytes can be categorized as halotolerant, and halophilic. The former can, occasionally, tolerate up to 25% sodium chloride (NaCl), and among the latter; microbes needing salts for their growth. Additionally, the non-halophiles require less than 1% NaCl, slight non-halophiles grow in 1-3% NaCl, moderate halophiles grow in 3-15% NaCl, and the extreme halophiles can grow in an environment containing 15-25% NaCl concentrations (Margesin and Schinner, 2001; Ventosa et al., 2008). The heterotrophic nature of the microbes contrasting to the autotrophs has enabled the formers with adaptation towards certain environments, as of saline, resulting in an abundance of microbes even in saturated environments. The tolerance and utilization mechanisms bring forward the prospects of such microbes in saline and hypersaline soils.
Wide range of habitats has resulted in halophilic and/or halotolerant microbes, for instance, salt lakes (Hedi et al., 2009), sea coasts (Kumar et al., 2012), arctic terrains (Yukimura et al., 2009), salt mines (Enache et al., 2014), plants pickled in salt solution (Abou-Elela et al., 2010), soil (Orhan and Gulluce, 2015), and endophytic environments (Zhao et al., 2013). Several examples of isolation from habitats mentioned above and application to other crops have shown salinity tolerance, along with enhancing the plant growth.
Halotolerance and halophilicity show different responses and adapt to such circumstances differently, offering the manipulation of such interactions for enhancing
8
required, and ever-sought better plant growth. The diversity of halotolerant bacteria has been reported from rhizosphere soil, and endophytic environment and genera like Arthrobacter, Azospirillum, Azotobacter, Bacillus, Burkholderia, Enterobacter, and Pseudomonas have been reported as enhancing salt stress tolerance in diverse kind of plants (Paul and Lade, 2014). The isolations of endophytic bacteria from Medicago truncatula, followed by sequencing analysis revealed similarities of the isolates with reported halotolerant, and halophilic bacteria (Yaish et al., 2016). The study further documented the alteration of the bacterial community due to salinity, and PGP mechanisms. Another instance showed the effect of salinity on the metabolism of rhizobacteria (Szymańska et al., 2016a), suggesting the hinderance in physiology, thus leading the bacteria towards tolerance and utilization of salts. Such circumstances lead towards the biochemical, and genetic adaptation of bacterial communities towards adverse environments (van der Meer, 2003), such as salinity. The bacterial interaction with the halophytes therefore offers potential of ameliorating the salinity along with enhancing the growth of plants.
Common ice-plant (Mesembryanthemum crystallinum L) being a halophyte, can grow in up to 400 mM salinity level (Agarie et al., 2007; Hasanuzzaman et al., 2014; Herppich et al., 2012), and can be used as food, feed, and phytoremediation agent besides its exploration for associated bacteria. Besides plants’ adaptation to saline environments, they also recruit bacteria adapted to such environments help the former grow better (Mahmood et al., 2019a). The bacteria thus help the plants thrive in extreme environments through plant growth promotion as discussed above. Other specific mechanisms can be activation of defense mechanisms like cell wall restructuring, and release of exopolysaccharides (Rampelotto, 2010). Additionally, the problem of nutrient fixation within the soil, phosphate as an example when applied in the saline soils is quickly immobilized, and bacteria capable of solubilization can help increase
9
availability leading towards better plant growth (Goldstein, 2009). Potential of such bacteria from saline habitats thus stands important for remediation of soils and thriving of plants. 1.4.2. Persistent organic pollutants and bacteria
Persistence of pesticides has led to widespread environmental pollution, which was not foreseen at the time of advent of such chemicals. Such chemicals were extensively used when first introduced, and were applied to not only the plants, but also human, and animals. The massive, and uncontrolled use has led to pesticide pollution in all the habitats, where soil persistence remains prominent. The pesticides in discussion include a wide variety, however, organochlorines; although banned decades ago yet have been reported widely from soil (Camenzuli et al., 2016; Wang et al., 2007a). The dichlorodiphenyltrichloroethane (DDT) has been used, and persisted so long, and so wide that it has even been reported in human milk (Smith, 1999), and devastatingly in developed countries too, putting the extent of pollution in developing countries so at risk. Similar is the case with pentachlorophenol (PCP) which was also developed simultaneously, banned later on but still being used and is toxic to living beings (Proudfoot, 2003).
Both DDT and PCP have been banned during 1970s and 1990s in developed and developing countries, respectively. And even decades later, the reports of DDTs and PCP from soil seldom stop. Considering the consequences of such pollution, the remediation procedures started immediately after the ban, but the initial techniques used included usually chemical methods, hydrolysis, redox, and photolysis, yet the lack of sustainability, limited efficiency, secondary pollutants issue, and high costs restricted such methods. Under these circumstances, biological methods gained importance for their ease, efficiency, and sustainability. The plants, among the biological methods, used as phytoremediation agents; prefer conjugation, and sequestration of the pollutants, but some microbes on the other hand, have evolved themselves,
10
and are able to transform such persistent chemicals to the simplest, and nontoxic end products i.e. carbon dioxide and water.
The transformation, and remediation capability of microbes depends on the microorganism type, type, and level of pollutant, and prevailing environmental conditions. The bioaugmentation, and bio-stimulation have been found increasing the remediation, however the diversity of the environment, and co-contamination often restricts the function of even potential strains. Therefore, the synergism between phytoremediation, and bioremediation gained importance, which in other words can be simplified as microbe assisted phytoremediation. The microbes can help the plant better adapt, sequester, or transform the pollutants which have been up-taken by the plants with the collective or individual objective of reducing the toxicity, eliminating the water potential dynamics for better moisture uptake, and/or helping the symbionts. There are chances of subsequent in planta degradation as well. Although rhizosphere microbes have shown potential for bioremediation of several pollutants (Matsumoto et al., 2009), the interest in endophytic microbes increased which have the advantage of stable environment on their side opposite to the free living, or generally referred to as rhizosphere microbes. The ideal culture conditions provided by the plants usually correspond to those of the laboratory, which include single pollutant, optimum temperature, and pH. This synergism can lead to better remediation even in co-contaminated sites, and higher level of the pollutants.
Endophytic bacteria have been isolated, and characterized for diverse kind of pollutants including phenol (Chen et al., 2017), trichloroethylene (Doty et al., 2017), chlorpyrifos (Feng et al., 2017), and diuron (Wang et al., 2017b) recently. On the other hand, the remediation of effluents, as an example of co-contaminations, the tannery effluent (Ashraf et al., 2017), have been reported. Similar cases from the heavy metal pollutants have also been observed, where fungal endophytes have enhanced tolerance (Gong et al., 2017; Li et al., 2016; Yamaji et al.,
11
2016), and phytoremediation, and bacterial endophytes have also showed increased tolerance (Román-Ponce et al., 2016), and enhanced phytoremediation (Mesa et al., 2017; Montalbán et al., 2017).
The resistance, tolerance, metabolism, and co-metabolism of DDT (Lin et al., 2014; Wang et al., 2010; Zhu et al., 2012) and PCP (Ito et al., 2018) by bacteria including those of rhizosphere bacteria have been reported. However, not much has been explored been carried out by endophytic bacteria in case of DDTs, while there is one report of PCP degradation by endophytic bacteria (Marihal et al., 2014). The gaps thus remain in our understanding about endophytic degradation of such pollutants.
This study was thus planned with the objectives of investigating:
• the endophytic bacterial diversity in the leaf-stalk of cucumber at two different locations with various management practices,
• cucumber plant growth promoting ability of endophytic bacteria and their application in real scale field experiment,
• the potential of endophytic and rhizosphere bacteria in amelioration of salinity stress, • the capability of endophytic bacteria in biodegradation of persistent organic pollutants, • enhancement of plant growth in persistent organic pollutants-contaminated soil, • uptake of persistent organic pollutants by cucumber plant applied with plant growth
promoting,
• and developing endophytic bacteria assisted phytoremediation for persistent organic pollutants.
12
CHAPTER 2 DIVERSITY OF ENDOPHYTIC BACTERIAL COMMUNITIES IN CUCUMBER (CUCUMIS SATIVUS L.)
2.1. Introduction
Cucumber (Cucumis sativus L.) is majorly consumed worldwide in the daily diet. Its global production is approximately 80.6 million tons (Food and Agriculture Organization of the United, 1998), where China leads with 67.4% (Burton, 2017). The supply–demand competition in several countries requires continuous increase in the cucumber yield. Furthermore, it absorbs persistent organic pollutants from the soil (Otani et al., 2007). Thus, cucumber is an essentially used in daily diet and also plays a vital role in environmental conditions. Due to the increasing demand of cucumber in Japan, there is a shortage of cultivable land area (35,800 ha in 1966 to 10,800 ha in 2017) and overall production (1,089,000 t in 1979 to 559,500 t in 2017) (Ministry of Agriculture, 2017). The cucumber yield per unit area can be increased by application of microbes.
The endophytic bacteria reside in the internal plant tissues without causing any pathogenesis, and thus help the plant growth through various functions such as release of certain chemicals, biomass production, bioavailability and activation mechanisms (Hardoim et al., 2015; Santoyo et al., 2016). The endophytes have been reported to suppress diseases (Malfanova et al., 2013; Sun et al., 2013) and enhance growth (Ozaktan et al., 2013) in cucumber plants. A meta-analysis revealed the abiotic stress mitigation in several crops by diverse endophytic bacteria and fungi (Rho et al., 2018). The microorganisms present in the plants compared to those in the rhizosphere have a closer interaction with their host due to their ability of colonizing the plant tissues. The endophytic microbes besides having superiority over rhizosphere microbes due to stability of endosphere also have plants’ preference. Consequently, endophytic bacteria are comparatively less prone to the environmental adversities, xenobiotics and nutrient limitation, which are quite prevalent in soil. These characteristics make
13
endophytes preferable candidates. Nevertheless, information of endophytic bacterial diversity in cucumber, regarding the stages of plant growth, is insufficient.
In contrast, plants commonly face several stresses throughout their lifecycle and adapt to such conditions via various strategies including the association with microbes during their growth. The knowledge of endophytic bacterial diversity enables better crop management. Besides, the follow-up of non-culturable endophytic bacteria using high throughput sequencing has enabled to monitor the whole endophytic community rather than a small culturable fraction. This endophytic community mainly derives from rhizosphere as observed in grapevine (Zarraonaindia et al., 2015). In this context, it is essential to periodically evaluate diversity and endophytic bacterial count, nevertheless the multi-phasic endophytic bacterial diversity in the above-ground plant parts, in particular leaf-stalk has been rarely studied. This study was thus conducted to reveal the endophytic bacterial diversity in the leaf-stalk of cucumber. We compared the endophytic bacterial diversity at two different locations with various management practices.
2.2. Materials and methods 2.2.1. Plant material
Two locations were selected for the experiment: a commercial cucumber farmer’s greenhouse (Site 1: N35.573616, E138.486816) and University of Yamanashi Research Farm (Site 2: N35.604073, E138.578506). For Site 1, the cucumber (Cucumis sativus L.) was purchased as pumpkin–cucumber (rootstock–scion) grafted nursery commercially. The first sampling was carried out immediately after transplantation (Nursery Stage). For Site 2, six un-grafted seedlings were purchased commercially, of which three were used for isolation and three were planted under field conditions. Both locations were sampled for leaf stalk (from three plants) after every month making a total of four samples Stage 1) Nursery Stage, Stage 2) Flowering Initiation Stage: 30 days after transplanting, Stage 3) Fruit Development Stage: 60 days after
14
transplanting, and Stage 4) Maturity Stage: 90 days after transplanting. The lowest healthy leaves were selected every time and only the leaf stalk was considered for isolation. The samples as a whole were transferred to the sampling bags, moved to laboratory, and were subjected to manipulation approximately within 1 h of the sampling.
Crop husbandries at both sites differed, as for the Site 1, drip irrigation system was used once in two days for almost 30 min. Conventional intensive agriculture was practiced: including pesticide application (fungicides having active ingredient Manzeb (20.0%), Flutianil (5.0%) and 2,4,5,6-tetrachloroisophthalonitrile (TPN) 40.0% among others were applied 12 times, and insecticide having active ingredients Emamectin benzoate (1.0%), Tolfenpyrad (15%), Flonicamid (10.0%), Buprofezin (25.0%) were applied 7 times) and fertilizer and growth enhancers’ application (9 doses making a total of 189 kg ha-1 nitrogen, 38.5 kg ha-1
phosphorus, 185.5 kg ha-1 potassium, 208 kg ha-1 magnesium, 742 kg ha-1 calcium, 0.7 kg ha-1 boron, and foliar spray of a liquid formulation including nitrogen, phosphorus, potassium, magnesium, manganese, molybdenum, boron, iron, copper, zinc and silicic acid). Manure was also applied before transplanting the nursery. At Site 2, irrigation was applied once every day to maintain the field capacity and no other inputs were used. Both locations offered shoot support to the plants. In the Site 1, two cucumber crops per year have been being processed for more than 30 years; however, Site 2 is used for experimental purpose otherwise is fallow.
2.2.2. Sample preparation for endophytic bacteria
The stalk samples were washed and cut into 2–3 mm discs with aseptic scissors which were surface sterilised by thorough washing with 70% ethanol for 1 min and 1% NaOCl (Sodium Hypochlorite) for 10 min. Discs were then washed and rinsed with sterilised distilled water (SDW) for several times (at least 5 times). For the first samplings, the disinfected discs were pressed against the agar plates to check the success of surface sterilization, and no signs of microbial presence were observed. Half of the samples were subjected to isolation as explained
15
in the next section and the remaining half were stored at −80 °C for next generation sequencing (NGS) for non-culturable bacteria.
2.2.3. Culturable endophytic bacteria 2.2.3.1. Isolation
The surface disinfected discs were crushed with 5 mL of SDW using sterilised mortar and pestle under aseptic conditions. An aliquot of 50 µL was spread on Reasoner's 2A agar (R2A) (Oxoid Limited, Hampshire, UK) and was replicated 2–3 times using disposable spreader. The plates were incubated for 6–7 days at 25 °C and appearing colony forming units (CFUs) were enumerated. Even slightly distinct colonies were considered and streaked until a single colony per plate was obtained. These colonies were stored at −80 °C in 20% glycerol (in 0.8% NaCl w/v).
2.2.3.2. DNA Extraction and PCR amplification
The DNA of bacterial strains was extracted via ZR Fungal/Bacterial DNA MiniPrep Kit™ (Zymo Research Corp., CA, USA). The 16S rRNA gene was amplified by a T100™ Thermal Cycler (Bio-rad, CA, USA), comprising cycles as: 95 °C for 5 min; 30 cycles at 94 °C for 30 s, 58 °C for 30 s and 72 °C for 1 min; and a final extension at 72 °C for 7 min. A total of 25 µL polymerase chain reaction (PCR) mixture was used, with 1 µL of sample, and 10 mM
primers, 9F (5ʹ-GAGTTTGATCCTGGCTCAG-3ʹ) and 1541R
(5ʹ-AAGGAGGTGATCCAGCC-3ʹ), 9.5 µL of nuclease free water and 12.5 µL of GoTaq® Green Master Mix. Differential primer selections for culturable and non-culturable endophytic bacteria were selected based on suitable long base pairs for each analysis. The success of DNA extraction was confirmed by gel electrophoresis.
2.2.3.3. PCR-Restriction Fragment Length Polymorphism (RFLP)
The isolated strains were further screened for their genotype using two restriction enzymes HinfI and AluI (New England Biolabs Japan Inc., Tokyo). About 4.5 µL of amplified nucleotide
16
sample of each strain was mixed with one of the enzymes (0.5 µL), buffer (1 µL) and SDW (4 µL) in 1.6-mL Eppendorf Tubes. The tubes were incubated for 30 min at 37 °C. The incubated-samples were later loaded into 2% agarose gel (in TAE buffer), run for 23 min and compared amongst and with co-run 100 bp ladder, after staining.
2.2.3.4. 16S rRNA gene sequencing and submission of sequences
The 16S rRNA gene was amplified as explained above. The direct sequencing method was employed to obtain the sequences of the amplified nucleotides. The obtained sequences were cross-compared with those of the DNA Data Bank of Japan (http://blast.ddbj.nig.ac.jp/) and the nearest species was noted. Then the sequences corresponding to the identified isolates were submitted to DDBJ under the accession numbers LC440722–LC440763 (42 isolates) for Site 1, and LC441044-LC44111 (68 isolates) for Site 2 (Table 2.1).
2.2.4. Non-culturable endophytic bacteria
The stored surface sterilised leaf-stalk samples were subjected to DNA isolation using FastDNA™ Spin Kit for Soil (MP Biomedicals Europe, Japan). The concentration of DNA was checked using a nano-spectrophotometer and DNA was diluted to 1 ng μl−1 using sterile water accordingly. The V4 region of 16S rRNA gene was amplified using specific primers;
515F (5ʹ-GTGCCAGCMGCCGCGGTAA-3ʹ) and 806R
(5ʹ-GGACTACHVGGGTWTCTAAT-3ʹ) with the barcode. All PCR reactions were carried out with Phusion® High-Fidelity PCR Master Mix (New England Biolabs). The PCR product quantification and qualification were done by mixing same volume of 1× loading buffer (containing SYB green) with PCR products and operating electrophoresis on 2% agarose gel for detection. Samples with bright main strip between 400–450 bp were chosen for further experiments. PCR products were mixed in equal density ratios. Thereafter, the mixed PCR products were purified with Qiagen Gel Extraction Kit (Qiagen, Germany). The libraries, 250 bp paired-end reads, generated with NEBNext® UltraTM DNA Library Prep Kit for Illumina
17
and quantified via Qubit and Q-PCR, were sequenced on an Illumina HiSeq 2500 platform. In order to maintain the reliability of the data, quality control was performed at each step of the procedure. Paired-end reads were assigned to samples based on their unique barcode and truncated by cutting off the barcode and primer sequence. Paired-end reads were merged using FLASH (V1.2.7, http://ccb.jhu.edu/software/FLASH/) (Magoč and Salzberg, 2011). Quality filtering on the raw tags was performed under specific filtering conditions to obtain high-quality clean tags (Bokulich et al., 2013) according to the Qiime (V1.7.0, http://qiime.org/scripts/split_libraries_fastq.html) quality controlled process (Caporaso et al., 2010). The tags were compared with the reference database (Gold database, http://drive5.com/uchime/uchime_download.html) using UCHIME algorithm (UCHIME Algorithm, http://www.drive5.com/usearch/manual/uchime_algo.html) (Edgar et al., 2011) to
detect the chimera sequences
(http://www.drive5.com/usearch/manual/chimera_formation.html). Next, the chimera sequences were removed (Haas et al., 2011), and the effective tags were finally obtained. Sequence analysis were performed via Uparse software (Uparse v7.0.1001 http://drive5.com/uparse/) using all the effective tags (Edgar, 2013). Sequences with ≥97% similarity were assigned to the same OTUs. Representative sequence for each OTU was screened for further annotation. For each representative sequence, Mothur software was used against the SSU rRNA database of SILVA Database (http://www.arb-silva.de/) (Wang et al., 2007b) for species annotation at each taxonomic rank (Threshold:0.8~1) (Quast et al., 2013). To obtain the phylogenetic relationship of all OTUs representative sequences, the MUSCLE software (Version 3.8.31, http://www.drive5.com/muscle/) was used for rapid comparison of multiple sequences (Edgar, 2004). OTUs abundance information was normalised using a standard of sequence number corresponding to the sample with the least sequences. Subsequent analyses were all performed based on this output normalised data.
18
The reads were submitted to DDBJ Sequence Read Archive (https://www.ddbj.nig.ac.jp/dra/index-e.html) under Bioproject and are available under accession number DRA007980 (In sequence of Site 1: stage 1–4 and Site 2: stage 1–4).
2.2.5. Data Analysis
The data was aligned on the basis of different stages for both sites. The Shannon–Weiner and Simpson diversity indices were calculated (Keylock, 2005; Spellerberg and Fedor, 2003).
2.3. Results
2.3.1. Number of culturable isolates and non-culturable operational taxonomic units The culturable isolates and non-culturable OTUs observed in the four stages of cucumber from two different sites have been compiled in Table 2.1. The culturable bacteria presented a continuous increase at Site 1. Four culturable strains were isolated in 1st sampling, which
increased seven times in the 2nd sampling and other five-times in the 3rd sampling. The fourth sampling provided 166 isolates. Culturable endophytic bacteria also increased at Site 2 but starting from Flowering Initiation Stage onwards, as the Nursery Stage revealed numerous isolates than that of Flowering Initiation Stage and Fruit Development Stage. This trend observed at Site 2 was different from that of Site 1; moreover, the extent of increase also differed from that observed at Site 1. The Nursery Stage of Site 2 presented 76 isolates, which reduced by 2.7 times in Flowering Initiation Stage. From the second stage onwards, there was continuous increase in the number of isolates. The increase from Flowering Initiation Stage to Fruit Development Stage was observed 1.5 times and from Fruit Development Stage to Maturity Stage, it was 2.1 times. In contrast, the non-culturable endophytic bacteria evidenced a varying trend than that of the culturable ones, which also varied between the locations. For the Site 1, non-culturable endophytic bacteria increased until the first three stages, and decreased in Maturity Stage; however; this count in Maturity Stage was higher than that of Flowering Initiation Stage. For Site 2, the Nursery Stage presented maximum number of OTUs,
19
a decrease in the following stage which increased later on. The number of OTUs differed on big scale among both sites as Site 2 indicated on-average less number when compared with Site 1.
Table 2.1 Comparison of culturable isolates and non-culturable operational taxonomic units (OTUs) observed, Shannon-Weiner and Simpson Diversity Indices of both locations. Stage 1: Nursery Stage, Stage 2: Flowering Initiation Stage at 30 days after transplanting, Stage 3: Fruit Development Stage at 60 days after transplanting, and Stage 4: Maturity Stage at 90 days after transplanting
Culturable Non-culturable
Sampling No. of
Isolates Shannon Simpson OTUs Shannon Simpson
Site 1 Stage 1 4 0.69 0.50 310 1.68 0.47 Stage 2 28 1.71 0.81 431 2.10 0.53 Stage 3 149 2.13 0.86 643 2.46 0.55 Stage 4 166 2.02 0.86* 506 2.22 0.54 Site 2 Stage 1 76 0.12 0.05 125 1.44 0.43 Stage 2 28 2.04 0.85 46 1.21 0.47 Stage 3 42 2.26 0.87 49 1.33 0.52 Stage 4 89 2.37 0.89 100 1.46 0.54
*Not rounded off value =0.856
2.3.2. The diversity across different stages
The diversity of endophytic bacteria was compared considering the Shannon–Weiner and Simpson diversity indices (Table 2.1). The Shannon–Weiner diversity index of culturable endophytic bacteria from Site 1 increased for the first three stages and then decreased. The Simpson index, presenting the same trend differed slightly (Fruit Development Stage = 0.860 > Maturity Stage = 0.856). For Site 2, both Shannon–Weiner and Simpson Diversity Indices revealed increase in the growth of cucumber plants. Although the number of isolates was significantly higher in Nursery Stage, it presented decreased diversity.
The non-culturable endophytic bacterial diversity changed in a similar pattern to that of culturable endophytic bacteria; however, the extent of change was comparatively lower. Site 1 revealed increase in both the diversity indices until Fruit Development Stage and then they decreased. This extent of increase was more evident in Shannon–Weiner index, where Simpson
20
index also presented similar but smaller changes. In contrast, Site 2 revealed higher Shannon– Weiner index in the Nursery Stage, which further decreased in Flowering Initiation Stage but increased later. The Simpson index showed a constant increase since Nursery Stage, opposite to that of Shannon–Weiner index. The extent of increase of both diversity indices was almost similar.
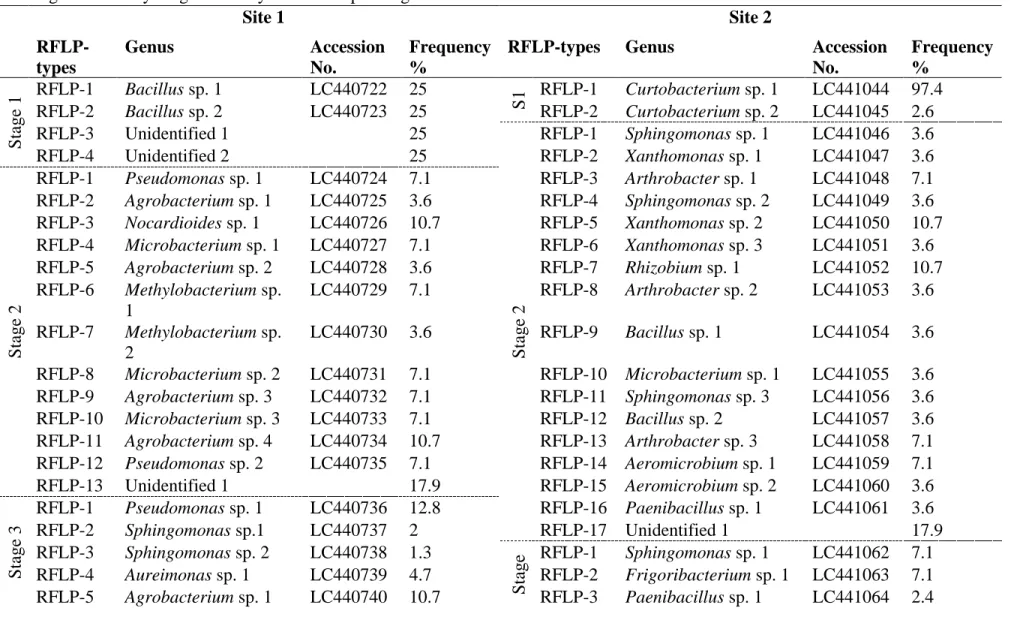
The culturable endophytic bacteria were classified based on RFLP analysis, where a total of 18 types in Site 1 and 30 types in Site 2 were observed (Table 2.2). The DNA sequences of each RFLP type resulted in a total of 11 genera (not included unidentified = 4) from Site 1, which belonged to three phyla: Firmicutes, Proteobacteria and Actinobacteria. Similarly, 21 genera (not included unidentified = 4) appeared from Site 2 and belonged to five phyla: Firmicutes, Proteobacteria, Actinobacteria, Bacteroidetes and Deinococcus-Thermus (Figure 2.1). Excluding the unidentified genus and comparing among the sampling stages, only one genus appeared in Nursery Stage at Site 1. The Flowering Initiation Stage, Fruit Development Stage and Maturity Stage presented 5, 7 and 8 genera, respectively. For Site 2 as well, only 1 genus appeared in Nursery Stage, and thereafter, an 8-fold increase in the genera was observed in Flowering Initiation Stage. Subsequently, 10 and 11 genera were observed in Fruit Development and Maturity Stages, respectively.
The non-culturable endophytic bacterial analysis revealed overall 320 genera from Site 1 and 63 genera from Site 2 (excluding unidentified genera). There were instances of several genera shared by different stages which is explained in later parts. Furthermore, at Site 1, 141 (44.1% among the total genera observed) different genera were observed in Nursery Stage, which further increased to 172 (53.8% among the total genera observed) different genera in the Flowering Initiation Stage, 280 (87.5% among the total genera observed) genera in Fruit Development Stage and later decreased to 230 (71.9% among the total genera observed) genera in Maturity Stage (90 days after transplanting). In contrast, at Site 2, 48 (76.2% among the total
21
genera observed) genera appeared in Nursery Stage (maximum in all the stages sampled), which further decreased to 13 genera (20.6% among the total genera observed) in Flowering Initiation Stage, further increasing to 17 (27% among the total genera observed) genera in Fruit Development Stage, followed by 42 (66% among the total genera observed) genera (2.5 times than that of Fruit Development Stage) in Maturity Stage. Thus, taxonomically at the phylum level, 36 phyla appeared at Site 1, whereas only 7 phyla were observed at Site 2 (excluding unidentified phyla). Proteobacteria being the most abundant at both sites was followed by Firmicutes and Bacteroidetes, respectively (Figure 2.2a & 2.2b).
22
Table 2.2 Frequency of culturable endophytic bacterial isolates; their nearest genus and accession numbers from Site 1 and 2 based on RFLP. The isolates sharing same RFLP number across different stages and sites do not represent the same species. S1 (Stage 1): Nursery Stage, Stage 2: Flowering Initiation Stage at 30 days after transplanting, Stage 3: Fruit Development Stage at 60 days after transplanting, and Stage 4: Maturity Stage at 90 days after transplanting.
Site 1 Site 2 RFLP-types Genus Accession No. Frequency %
RFLP-types Genus Accession
No. Frequency % S tage 1 RFLP-1 Bacillus sp. 1 LC440722 25 S 1 RFLP-1 Curtobacterium sp. 1 LC441044 97.4 RFLP-2 Bacillus sp. 2 LC440723 25 RFLP-2 Curtobacterium sp. 2 LC441045 2.6 RFLP-3 Unidentified 1 25 S tage 2 RFLP-1 Sphingomonas sp. 1 LC441046 3.6 RFLP-4 Unidentified 2 25 RFLP-2 Xanthomonas sp. 1 LC441047 3.6 S tage 2 RFLP-1 Pseudomonas sp. 1 LC440724 7.1 RFLP-3 Arthrobacter sp. 1 LC441048 7.1 RFLP-2 Agrobacterium sp. 1 LC440725 3.6 RFLP-4 Sphingomonas sp. 2 LC441049 3.6 RFLP-3 Nocardioides sp. 1 LC440726 10.7 RFLP-5 Xanthomonas sp. 2 LC441050 10.7 RFLP-4 Microbacterium sp. 1 LC440727 7.1 RFLP-6 Xanthomonas sp. 3 LC441051 3.6 RFLP-5 Agrobacterium sp. 2 LC440728 3.6 RFLP-7 Rhizobium sp. 1 LC441052 10.7 RFLP-6 Methylobacterium sp. 1 LC440729 7.1 RFLP-8 Arthrobacter sp. 2 LC441053 3.6 RFLP-7 Methylobacterium sp. 2 LC440730 3.6 RFLP-9 Bacillus sp. 1 LC441054 3.6 RFLP-8 Microbacterium sp. 2 LC440731 7.1 RFLP-10 Microbacterium sp. 1 LC441055 3.6 RFLP-9 Agrobacterium sp. 3 LC440732 7.1 RFLP-11 Sphingomonas sp. 3 LC441056 3.6 RFLP-10 Microbacterium sp. 3 LC440733 7.1 RFLP-12 Bacillus sp. 2 LC441057 3.6 RFLP-11 Agrobacterium sp. 4 LC440734 10.7 RFLP-13 Arthrobacter sp. 3 LC441058 7.1 RFLP-12 Pseudomonas sp. 2 LC440735 7.1 RFLP-14 Aeromicrobium sp. 1 LC441059 7.1 RFLP-13 Unidentified 1 17.9 RFLP-15 Aeromicrobium sp. 2 LC441060 3.6 S tage 3 RFLP-1 Pseudomonas sp. 1 LC440736 12.8 RFLP-16 Paenibacillus sp. 1 LC441061 3.6 RFLP-2 Sphingomonas sp.1 LC440737 2 RFLP-17 Unidentified 1 17.9 RFLP-3 Sphingomonas sp. 2 LC440738 1.3 S tage 3 RFLP-1 Sphingomonas sp. 1 LC441062 7.1 RFLP-4 Aureimonas sp. 1 LC440739 4.7 RFLP-2 Frigoribacterium sp. 1 LC441063 7.1 RFLP-5 Agrobacterium sp. 1 LC440740 10.7 RFLP-3 Paenibacillus sp. 1 LC441064 2.4
23 RFLP-6 Pseudomonas sp. 2 LC440741 7.4 RFLP-4 Sphingomonas sp. 2 LC441065 9.5 RFLP-7 Microbacterium sp. 1 LC440742 6 RFLP-5 Agrobacterium sp. 1 LC441066 2.4 RFLP-8 Methylobacterium sp. 1 LC440743 6 RFLP-6 Paenibacillus sp. 2 LC441067 2.4 RFLP-9 Microbacterium sp. 2 LC440744 6 RFLP-7 Phycicoccus sp. 1 LC441068 2.4 RFLP-10 Curtobacterium sp. 1 LC440745 4 RFLP-8 Rhizobium sp. 1 LC441069 2.4 RFLP-11 Microbacterium sp. 3 LC440746 6 RFLP-9 Agrobacterium sp. 2 LC441070 2.4 RFLP-12 Methylobacterium sp. 2 LC440747 6 RFLP-10 Microbacterium sp. 1 LC441071 2.4 RFLP-13 Sphingomonas sp. 3 LC440748 7.4 RFLP-11 Massilia sp. 1 LC441072 2.4 RFLP-14 Agrobacterium sp. 2 LC440749 8.7 RFLP-12 Lysinimonas sp. 1 LC441073 4.8 RFLP-15 Unidentified 1 3.4 RFLP-13 Microbacterium sp. 2 LC441074 2.4 RFLP-16 Unidentified 2 2 RFLP-14 Frigoribacterium sp. 2 LC441075 2.4 RFLP-17 Unidentified 3 3.4 RFLP-15 Frigoribacterium sp. 3 LC441076 2.4 RFLP-18 Unidentified 4 2 RFLP-16 Pseudomonas sp. 1 LC441077 2.4 S tage 4 RFLP-1 Pseudoclavibacter sp. 1 LC440750 10.8 RFLP-17 Sphingomonas sp. 3 LC441078 2.4 RFLP-2 Brachybacterium sp. 1 LC440751 7.2 RFLP-18 Pseudomonas sp. 2 LC441079 2.4 RFLP-3 Curtobacterium sp. 1 LC440752 15.7 RFLP-19 Lysinimonas sp. 2 LC441080 2.4 RFLP-4 Pseudomonas sp. 1 LC440753 5.4 RFLP-20 Methylobacterium sp. 1 LC441081 2.4 RFLP-5 Agrobacterium sp. 1 LC440754 3.6 RFLP-21 Massilia sp. 2 LC441082 2.4 RFLP-6 Sphingomonas sp. 1 LC440755 1.8 RFLP-22 Rhizobium sp. 2 LC441083 2.4 RFLP-7 Methylobacterium sp. 1 LC440756 2.4 RFLP-23 Massilia sp. 3 LC441084 2.4 RFLP-8 Microbacterium sp. 1 LC440757 7.2 RFLP-24 Frigoribacterium sp. 4 LC441085 2.4 RFLP-9 Agrobacterium sp. 2 LC440758 3 RFLP-25 Unidentified 1 23.8 RFLP-10 Agrobacterium sp. 3 LC440759 17.5 S tage 4 RFLP-1 Frigoribacterium sp. 1 LC441086 3.4 RFLP-11 Methylobacterium sp. 2 LC440760 6.6 RFLP-2 Hymenobacter sp. 1 LC441087 1.1 RFLP-12 Methylobacterium sp. 3 LC440761 8.4 RFLP-3 Sphingomonas sp. 1 LC441088 3.4
24 RFLP-13 Microbacterium sp. 2 LC440762 3 RFLP-4 Sphingomonas sp. 2 LC441089 1.1 RFLP-14 Methylobacterium sp. 4 LC440763 5.4 RFLP-5 Microbacterium sp. 1 LC441090 3.4 RFLP-15 Unidentified 1 1.8 RFLP-6 Microbacterium sp. 2 LC441091 1.1 RFLP-7 Microbacterium sp. 3 LC441092 1.1 RFLP-8 Microbacterium sp. 4 LC441093 1.1 RFLP-9 Variovorax sp. 1 LC441094 2.2 RFLP-10 Microbacterium sp. 5 LC441095 1.1 RFLP-11 Flavobacterium sp. 1 LC441096 1.1 RFLP-12 Aureimonas sp. 1 LC441097 1.1 RFLP-13 Methylobacterium sp. 1 LC441098 7.9 RFLP-14 Sphingomonas sp. 3 LC441099 2.2 RFLP-15 Frigoribacterium sp. 2 LC441100 7.9 RFLP-16 Frigoribacterium sp. 3 LC441101 1.1 RFLP-17 Sphingomonas sp. 4 LC441102 3.4 RFLP-18 Deinococcus sp. 1 LC441103 3.4 RFLP-19 Rhizobium sp. 1 LC441104 4.5 RFLP-20 Sphingomonas sp. 5 LC441105 1.1 RFLP-21 Sphingomonas sp. 6 LC441106 3.4 RFLP-22 Sphingomonas sp. 7 LC441107 2.2 RFLP-23 Sphingomonas sp. 8 LC441108 5.6 RFLP-24 Frigoribacterium sp. 4 LC441109 7.9 RFLP-25 Lysinimonas sp. 1 LC441110 7.9 RFLP-26 Deinococcus sp. 2 LC441111 1.1 RFLP-27 Unidentified 1 12.4 RFLP-28 Unidentified 2 1.1 RFLP-29 Unidentified 3 3.4 RFLP-30 Unidentified 4 2.2
25 2.3.3. Dynamic change in endophytic bacteria
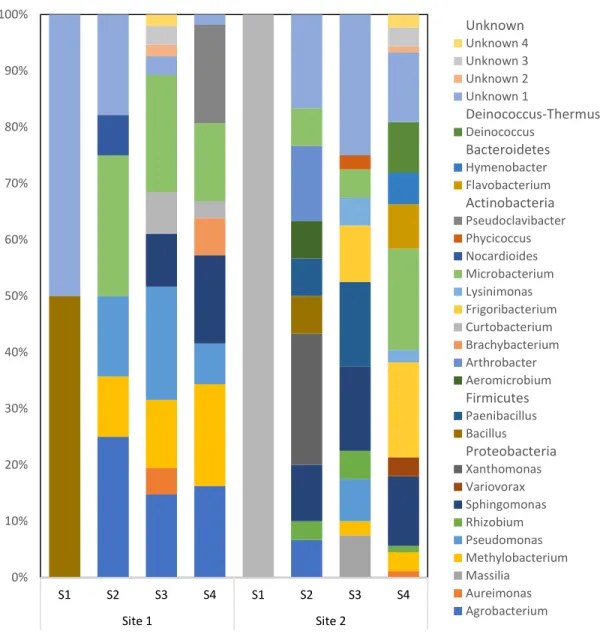
The identification of the culturable isolates revealed different genera among various stages of the cucumber plant. Bacillus from Site 1 and Curtobacterium from Site 2, observed in Nursery Stage, were not observed in the later stages (Figure 2.1). Four genera, namely Agrobacterium, Methylobacterium, Pseudomonas and Microbacterium, were observed commonly in the Flowering Initiation, Fruit Development and Maturity Stages at Site 1. Frequencies of these genera from all the culturable bacteria at that stage revealed a different trend, wherein only Methylobacterium indicated continuous increase (Figure 2.1). For Site 2, three genera, namely Microbacterium, Sphingomonas and Rhizobium persisted temporarily for Flowering Initiation, Fruit Development and Maturity Stages. Percentage of Microbacterium indicated a decline in Fruit Development Stage compared to that of the pervious growth stage (Flowering Initiation Stage), but again increased in later Maturity Stage. Sphingomonas, however, constantly increased; whereas, Rhizobium increased in Fruit Development Stage and later decreased in Maturity Stage. Microbacterium spp. was interestingly prevalent in all the three stages; Flowering Initiation, Fruit Development and Maturity Stages, at both sites; however, the trend was different (Figure 2.1).
Except for the genera prevalent over the last three stages, few were observed only in two stages. Curtobacterium and Sphingomonas were observed in Fruit Development and Maturity Stages at Site 1, whereas four genera, namely Methylobacterium, Frigoribacterium, Lysinimonas at Fruit Development and Maturity Stages, and Paenibacillus (Flowering Initiation and Fruit Development Stages) were observed incident in two temporal stages at Site 2. Curtobacterium from Site 1 indicated decrease in the Maturity Stage from that of Fruit Development Stage, whereas Sphingomonas was increased. For Site 2, all the above-mentioned
26
genera presented an increase in the subsequent stages except for Lysinimonas, which remained constant.
Figure 2.1 Distribution of different culturable bacterial genera from Site 1 and Site 2. The unknown genera across stages and sites don’t necessarily represent same genus. S1: Nursery Stage, S2: Flowering Initiation Stage at 30 days after transplanting, S3: Fruit Development Stage at 60 days after transplanting, and S4: Maturity Stage at 90 days after transplanting.
0% 10% 20% 30% 40% 50% 60% 70% 80% 90% 100% S1 S2 S3 S4 S1 S2 S3 S4 Site 1 Site 2 Unknown Unknown 4 Unknown 3 Unknown 2 Unknown 1 Deinococcus-Thermus Deinococcus Bacteroidetes Hymenobacter Flavobacterium Actinobacteria Pseudoclavibacter Phycicoccus Nocardioides Microbacterium Lysinimonas Frigoribacterium Curtobacterium Brachybacterium Arthrobacter Aeromicrobium Firmicutes Paenibacillus Bacillus Proteobacteria Xanthomonas Variovorax Sphingomonas Rhizobium Pseudomonas Methylobacterium Massilia Aureimonas Agrobacterium
27
For the non-culturable endophytic bacteria at Site 1, 93 (29.1% among the total genera observed) of the genera indicated existence among all of the stages sampled. Similarly, 72 (22.5% among the total genera observed) genera were appeared among three stages; whereas, 79 (24.7% among the total genera observed) of the distinct genera were appeared among two different stages. Remaining 76 (23.8% among the total genera observed) genera were observed only in one stage (excluding unidentified ones, classified as others). For Site 2, only 6 (9.5% among the total genera observed) genera were appeared in all the 4 stages of sampling, and 12 (19% among the total genera observed) distinct genera were appeared in 3 different stages and 14 (22.2% among the total genera observed) were by two distinct stages. Remaining 31 (49.2% among the total genera observed) genera were observed solely in any one stage of sampling.
The multiphasic heatmap of different phyla from Site 1 and Site 2 presented the dynamics of non-culturable endophytic bacteria in cucumber (Figure 2.2a, 2.2b). Certain phyla, in particular, Proteobacteria, Bacteroidetes and Actinobacteria were abundant at Site 1 and increased gradually. Few other phyla also indicated an increasing trend; however, some of these were intriguingly abundant only in Fruit Development Stage of sampling corresponding to similar results in the culturable endophytic bacteria (Table 2.1, Figure 2.1). Firmicutes were more abundant in Fruit Development Stage. The density of certain phyla decreased with the age of plant. Site 2 presented more phyla in culturable endophytic bacteria when compared with Site 1; however, it only revealed seven non-culturable phyla excluding the unidentified ones, classified as others (Figure 2.2b). The number of non-culturable endophytic bacterial phyla at Site 2 unlike Site 1 (Table 2.1) revealed different trend, and maximum density was observed in Nursery Stage except for Proteobacteria; which indicated increasing trend until Fruit Development Stage and then decreased further.
28
Firmicutes and Bacteroidetes decreased once after Nursery Stage and further tended to increase in the later plant growth phases.
29 (a) (b)
Figure 2.2 Heatmap illustrating the trend of operational taxonomic units (OTUs) of non-culturable endophytic bacteria from each phylum from Site 1 (a) and Site 2 (b) across different stages. Color from light to dark represents the increase in incidence of OTUs in each phylum. S1: Nursery Stage, S2: Flowering Initiation Stage at 30 days after transplanting, S3: Fruit Development Stage at 60 days after transplanting, and S4: Maturity Stage at 90 days after transplanting.
Phyla S1 S2 S3 S4 Proteobacteria Firmicutes Bacteroidetes Chloroflexi Actinobacteria Synergistetes Tenericutes Spirochaetes Planctomycetes Armatimonadetes Acidobacteria Euryarchaeota Aminicenantes Thermotogae Fusobacteria Nitrospirae Verrucomicrobia Chlorobi Gemmatimonadetes Deinococcus-Thermus Ignavibacteriae Atribacteria WS1 Lentisphaerae Thermomicrobia Deferribacteres Hydrogenedentes Cloacimonetes Latescibacteria BRC1 Saccharibacteria SR1_(Absconditabacteria) RBG-1_(Zixibacteria) TM6_(Dependentiae) TA06 Caldiserica Others Phyla S1 S2 S3 S4 Proteobacteria Firmicutes Bacteroidetes Actinobacteria Planctomycetes Spirochaetes Verrucomicrobia Others Minimum Maximum
30
The Venn diagrams from Site 1 (Figure 2.3a) and Site 2 (Figure 2.3b) depict the division of non-culturable OTUs in each stage and their overlapping across different stages. Both the sites revealed differential response and differed in number of OTUs (compiled in Table 2.1). Results revealed that 183 (22.3%) OTUs from Site 1 and 30 (19.3%) from Site 2 were common among all the stages sampled. For Site 1, the number of OTUs belonging specifically to each stage and not found in other stages presented an increasing trend with the age of plant until Fruit Development Stage. From Fruit Development Stage onwards, the number decreased by almost three times. The OTUs’ incidence indicated that Nursery Stage had 22 (2.7%) of the total strains, which were not observed in any other stage. Fruit Development Stage stood with the highest sole possession of 172 (20.9%); whereas, Flowering Initiation Stage and Maturity Stage exhibited 37 (4.5%) and 51 (6.2%) of the total OTUs, respectively, as not observed in any other stage. Moreover, Nursery Stage shared 19 (2.3%) OTUs with Flowering Initiation Stage, 17 (2.1%) with Fruit Development Stage and only 7 (0.9%) OTUs with Maturity Stage. The stages 2 and 3 shared maximum number of OTUs with their subsequent stages, respectively. For Site 2, the stage-specific non-culturable endophytic bacteria presented a variant response where Nursery Stage comprised 44 (28.4%) of the total OTUs. Furthermore, Flowering Initiation Stage presented 3 (1.9%) and Fruit Development Stage showed only 1 (0.6%) of the strains solely attributed to the corresponding stage. The last stage revealed 21 (13.5%) OTUs only observed in this particular stage. The distribution at Site 2 as depicted in Venn diagram (Figure 2.2b), revealed preference for Nursery Stage except for the OTUs observed commonly in all stages, and sole attribution of Maturity Stage. Interestingly, there was no sharing of non-culturable OTUs among the first three stages. Similarly, stages 2 and 3 shared none of the strains between themselves.
31 (a)
(b)
Figure 2.3 Venn-diagram of non-culturable operational taxonomic units (OTUs) from Site 1 (a) and Site 2 (b). Stage 1: Nursery Stage, Stage 2: Flowering Initiation Stage at 30 days after transplanting, Stage 3: Fruit Development Stage at 60 days after transplanting, and Stage 4: Maturity Stage at 90 days after transplanting
32
2.3.4. Comparison of endophytic bacteria between both geographical locations
Of all the 25 culturable genera isolated from both sites, only 8 (32%) genera were observed common at both locations (Figure 2.1). Different extents of similarity were found between the locations as Microbacterium spp. existed in the six different sampling stages across both locations (Flowering Initiation, Fruit Development and Maturity Stages at both Sites). Sphingomonas spp. (Fruit Development and Maturity Stages at Site 1 and Flowering Initiation, Fruit Development and Maturity Stages at Site 2) and Methylobacterium spp. (Flowering Initiation, Fruit Development and Maturity Stages at Site 1 and Fruit Development and Maturity Stages at Site 2) followed as they were found at five different sampling stages across the locations. Similarly, Agrobacterium spp. and Pseudomonas spp. were present at four different sampling stages (Flowering Initiation, Fruit Development and Maturity Stages at Site 1 and only Flowering Initiation Stage at Site 2), Curtobacterium spp. at three different sampling stages (Fruit Development and Maturity Stages at Site 1 and only Nursery Stage at Site 2), and Aureimonas spp. (Fruit Development Stage at Site 1 and Maturity Stage at Site 2) and Bacillus spp. (Nursery Stage at Site 1 and Flowering Initiation Stage at Site 2) at two different stages across both sites.
The non-culturable endophytic bacterial analysis presented 47 (14% of the total distinct genera observed which were 336) genera, which were common at both locations with varying levels. There were 3 (7.3% of the shared 47 genera) genera which were observed common in all the stages at both locations. Similarly, 7 (14.9%) genera were present at seven stages, 8 (17%) were present in six stages and 9 (19.1%) in five stages across the locations. The number declined further presenting 8 (17%) genera in four stages, 6 (12.8%) in three stages, and also 6 (12.8%) genera in two different stages at both sites. Site 1 showed exclusive possession of 289 (86% of the total distinct genera=336) genera, whereas Site 2 only showed that of 16 (4.8% of the total distinct genera=336) genera.
33
2.3.5. Differences between culturable and non-culturable endophytic bacteria
Certain differences among the culturable and non-culturable endophytic bacteria from cucumber were observed. Site 1 revealed more differences among the OTUs observed in the culturable and non-culturable bacteria as compared to Site 2. Comparing the culturable and non-culturable endophytic bacteria genera from both sites (Table 2.1), Site 1 showed major differences compared to Site 2. Site 1 presented a total of 11 culturable genera (+ 4 unidentified) while 320 non-culturable endophytic bacterial genera, indicating a difference of 29.1-fold. For Site 2, however, the difference accounted for only 3-fold. The density also differed as observed in CFU and OTU count (Table 2.1). Although several endophytic bacteria were present at Site 1, only a fraction was found to be culturable. Site 2, corresponding to genera-based discussion, presented better cultivability results.
2.4. Discussion
This study revealed the dynamic change of culturable and non-culturable endophytic bacteria in the leaf-stalk of cucumber. As listed in Table 2.1, the continuous increase in the culturable and non-culturable endophytic bacteria presented the increasing interaction of host with its internal microbiome. Bourceret et al. (2018) observed the rhizosphere microbial community changes due to the presence of plants which reflects the influence on endophytic community later. Chi et al. (2005) observed the recruitment of root endophytic bacteria from soil, which eventually move to the aboveground parts of plants. Ju and Zhang (2015) also reported that the shifts of microbial community have been established based on the environment. The environment inside the plant might be stable compared to the outside environment; however, endophytic bacteria might undergo certain changes with increasing environmental stresses on the plant. Circumstantially, the plants recruit microbes from the soil reservoir as observed in grapevine (Zarraonaindia et al., 2015).
34
Actinobacteria, Firmicutes, Proteobacteria and other phyla as observed in culturable and non-culturable endophytes in this study (Table 2.2, Figs. 21, 2.2a, and 2.2b) are well known for their diverse functions and promote plant growth (Gontia-Mishra et al., 2017) besides their abundance in the endosphere (reviewed by Liu et al., 2017). The presence of these phyla in cultivation dependent techniques has previously been observed in cucumber (Mahaffee and Kloepper, 1997) and common bean (Costa et al., 2012).
In this study, the endophytic bacterial count from Site 1 was comparatively higher than that of Site 2. This can be related to the continuous fertilizer application and irrigation practices being followed at Site 1. The irrigation and fertilizer applied, activate the microbes in soil, which with the help of certain plant exudates are able to colonise the plants. Both the culturable and non-culturable approaches indicated major differences in the endophytic bacterial diversity among various sampling stages and across the two sites explored (Table 2.1). At Site 1, the diversity of culturable endophytic bacteria revealed lower values in the Nursery and Maturity Stages compared to Site 2, which indicated a continuous increase. The cucumber plants at Site 1 were grafted using pumpkin rootstock, a common practice among farmers of the area; consequently, higher endophytic bacterial richness and diversity was observed after the Flowering Initiation Stage. Thus, endophytic bacteria detected in the Nursery Stage may have been derived from the rootstock and they disappeared in Flowering Initiation Stage due to their adaptation ability. A previous study reported a strong effect of breed type on the endophytic microbial community in variant rootstock– scion grafted apple (Liu et al., 2018). Similarly, the effect of rootstock on the endophytic bacterial community has been observed (Poudel et al., 2018); however, the of microbial functions such as plant growth promoting ability was not linked to the rootstock source (Marasco et al., 2018).