Does disclosure of school quality information
increase disparity in academic achievement?
The effect through the housing market
著者
Kuroda Yuta
journal or
publication title
DSSR Discussion Papers
number
90
page range
1-55
year
2018-12
URL
http://hdl.handle.net/10097/00124280
Data Science and Service Research
Discussion Paper
Discussion Paper No.90
Does disclosure of school quality information
increase disparity in academic achievement?
The effect through the housing market
Yuta Kuroda
December, 2018
Center for Data Science and Service Research
Graduate School of Economic and Management
Tohoku University
27-1 Kawauchi, Aobaku
Sendai 980-8576, JAPAN
1
Does disclosure of school quality information increase
disparity in academic achievement?
The effect through the housing market
*
Yuta Kuroda
†Abstract
This study investigates the effect of disclosure of information regarding school quality on the stratification of elementary schools and the widening disparity in the academic ability of students between schools. Using the event in which school-level test scores were first disclosed in October 2014 in Matsue City in Japan, I estimated the change of the effect of test scores on housing rents and population in a school district before and after disclosure. I found that school-level test scores had a significantly positive effect on housing rents of apartments intended for a family after the scores were disclosed. I also found that disclosure significantly increased the population of elementary school-aged individuals within the attendance district of school with high test scores. Additionally, I found that the relative standard deviation of test scores after disclosure became larger than that measured before disclosure. These results suggest that disparity in the academic ability of students between schools may expand through increased housing rents after disclosure of school-level test results.
Keywords: Housing rent, School quality, School district, Disparity in school, Information disclosure JEL classifications: R31, R21, I20, I24
* I would like to thank my advisors, Kentaro Nakajima, Midori Wakabayashi and Akira Hibiki. I am
deeply grateful to Paul Thorsnes, Lixing Li, Iljoong Kim, Jenn-Jou Chen, and Wen-Chieh Wu for helpful comments and suggestions. I would also like to express my gratitude to the participants at the Joint Seminar at the University of Tsukuba, the 2018 Japanese Economic Association Spring Meeting, the 21st Labor Economics Conference at Doshisha University, the Tokyo Labor Economics
Workshop and the Data Science Workshop at Tohoku University. All remaining errors are my own. This study was supported by Joint Research Program No.762 at the Center for Spatial Information Science (CSIS), University of Tokyo (Real Estate Database 1999-2016 by At Home Co., LTD).
† Graduate School of Economics and Management, Tohoku University, Sendai 980-8576, Japan.
2
1. Introduction
In recent years, accountability has been introduced by many public institutions for the purpose of efficient operation and improving performance, and the disclosure of information regarind the quality of service is progressing. With disclosure of information on quality, suppliers will operate more responsibly, and demanders will be able to make better decisions. In the field of education, the disclosure of school quality information may change the educational behavior of parents or improve students’ academic performance. Koning and van der Wiel (2013) found that disclosure of negative information related to quality of a school decreased the number of first-year students in the Netherlands who chose that school after disclosure. Hastings and Weinstein (2008) demonstrated that the fraction of parents who chose higher-performing schools significantly increased with receipt of information on school quality. Burgess, Wilson, and Worth (2013) found significant and robust evidence indicating that the abolition of school performance tables markedly reduced school effectiveness in Wales relative to England.
In Japan, despite concerns over excessive competition and expansion of disparities among schools, national academic achievement tests for elementary and junior high school (compulsory education) students were not conducted until 2007. Furthermore, only the average scores of prefectures on the national test were disclosed until 2014 (Kawaguchi, 2011). Under such circumstances, since 2000, several educational problems such as a decline in children’s academic performance, inequality of education, and expansion of child poverty have been discussed in Japan (Kariya et al., 2002; Abe, 2008), and the introduction of a national test and disclosure of its results were strongly requested for efficient operation and improved performance. As a result, the national test known as the National Assessment of Academic Ability (NAAA) has been conducted since 2007, and since 2014 schools’ average test scores have been disclosed in several municipalities.
In this study, I used the unique event of disclosure of school quality information, which had not occurred until 2014, and investigated how it affected students’ academic performance and parental educational behavior. However, because there is no difference in fees associated with public education among schools in Japan, parents’ educational demand is not reflected in school fees and it is difficult to directly observe their educational investment behavior and willingness to pay for their children’s schooling. Therefore, I focused on the housing market in areas where a school district system existed to indirectly observe the effect of the disclosure of school quality information on the behavior of parents.
There have been many studies investigating the effect of school quality on real estate prices, and consistent results have been obtained indicating that "school quality has a significantly positive effect on housing or land prices" (Black & Machin, 2011; Nguyen-Hoang & Yinger, 2011). The mechanism is as follows: If a school district system exists, in order to attend a specific school it is necessary to live within its attendance district; thus, the demand for housing or land within the
3
attendance district of high quality schools rises, and as a result, the price of housing and land within the attendance district also become high. Specifically, the value that parents place on education is capitalized as housing or land prices. However, there have not been many studies investigating the effect of the disclosure of school quality information on the housing market compared to studies focusing on the relationship between school quality and the housing market. Particularly, few studies have tried to determine whether competition and disparities among schools occurs as a result of disclosure, and therefore the effect of disclosure on them must be examined. Additionally, from the policy evaluation perspective, because the educational system and environment greatly differ from country to country, it is also important to investigate what happened after disclosure of school quality information using Japanese data..
In this study, using the event that the school-level test scores were first disclosed in October 2014 in Matsue City in Japan, I estimated the effect of disclosure on housing rents and population in the school district. To avoid the problem of unobserved confounding factors, I controlled the area fixed effect and the various trends of the region. I also investigated how disparity in academic achievement among schools changed after disclosure. As a result, I found that school-level test score had a significantly positive effect on rents of apartments intended for a family after the school-level test scores were disclosed. I also found that the disclosure effect was significant only in areas with many children, and was insignificant in areas with few children. Additionally, my results suggest that disclosure significantly increased the population of elementary school-aged individuals within the attendance district of schools with high test scores. These results indicate that parents choose residential areas in response to new information regarding school quality, and that the housing market is also affected. Finally, I also found that the value which indicated the degree of disparity (i.e., relative standard deviation of test scores) became large as a result of disclosure.
These results suggest that disparity in the academic ability of students between schools may expand through increased housing rents after disclosure of school-level test results. The potential mechanisms are as follows: The disclosure of information on school quality makes parents exercise more selective behavior for their children, and as a result, the amount of money they need to pay to attend good schools increases, reflecting growing demand for good education. Additionally, parents' school choice behavior is heterogeneous, and parents with a higher educational background and income, or with more enthusiasm for their children's education, tend to choose higher quality schools. In contrast, parents with a relatively low educational background and income, or with less willingness to pay for their children's education, are crowded out of good school districts through increased housing rentals, and sorting of students occurs. As a result, potentially talented students (who have parents with good educational backgrounds, higher incomes, or enthusiasm for education) gather at high quality schools, and therefore disparity in academic achievement between schools will expand.
4
Relative to previous studies, this study makes several contributions to the literature. First, by using housing prices instead of land prices, I was able to estimate and interpret the effect of school quality on the property market more clearly because the rental housing data included indices on whether the properties were intended for families. Second, previous studies mainly imply the possibility of selective disclosure by real estate agencies; however, by using not only housing data but also population census data for small areas organized by age group, my results indicate that there is evidence that the residential choice of parents is also changing due to disclosure of school quality information. Third, I was able to clearly measure the effect of disclosure of public school quality information on a regional community by focusing on a city where a school district system clearly existed and few private schools were present. Finally, although academic performance, school choice, and the property market were estimated in each previous study, in this investigation I consider the effect of disclosure on all three categories.
The structure of this paper is as follows: Section 2 reviews the previous literature and explains the contributions of this study. Section 3 describes the empirical strategies used. Section 4 discusses the data and setting of the study. Section 5 presents the results and discussion. Finally, Section 6 provides concluding remarks.
2. Literature review
Many studies have considered the effects of school quality on housing rents, and Black and Machin (2011) and Nguyen-Hoang and Yinger (2011) offer comprehensive reviews of this literature. These studies have shown consistent results, indicating that school quality has a significant positive effect on the price of housing or land (e.g., Black, 1999; Figlio & Lucas, 2004). In Japan, Ushijima and Yoshida (2009) and Kuroda (2018) also found that increasing school quality increased property price significantly. Ushijima and Yoshida (2009) found that school quality affected land prices only in areas with high-quality schools, and the results of Kuroda’s investigation (2018) indicated that school quality had a greater effect on rents of apartments with larger occupied areas. These results suggest that there is heterogeneity among families or properties affected by school quality.
Studies investigating the effect of disclosure of school quality information can be roughly classified as focusing on the following categories, depending on the type of outcome variable: academic achievement, school choice, and property price. Koning and van der Wiel (2012) investigated the effect of disclosure of school quality information on academic performance. They found that disclosure of information on the relative quality of schools in the national newspaper improved performance in a group of schools with relatively lower performance scores. Conversely, Burgess, Wilson, and Worth (2013) investigated whether the abolition of disclosure of school performance information negatively affected school effectiveness. They found significant and robust
5
evidence suggesting that abolition of school performance tables markedly reduced school effectiveness, but that it did not affect schools in the top quartile of the league tables. The results of these studies indicated that disclosure of school quality information had an effect on academic performance, but that the effect might have heterogeneity among schools depending on quality.
There have also been studies on the effect of disclosure of school quality information on choice of school. Koning and van der Wiel (2013) found that the number of enrollments for schools with lower scores decreased after disclosure of information about the quality of high schools in the Netherlands. They also found that these effects were large for the most academically rigorous path, such as the college-preparatory track. Nunes, Reis, and Seabra (2015) found that disclosure of school ranking based on the national academic exam decreased the number of enrollments in schools that were rated poorly and increased the probability that they would be closed. They also observed that these effects were stronger for private schools. Hastings and Weinstein (2008) examined both a natural experiment and a field experiment in which direct information on school test scores was provided to lower-income families in a setting involving a public school choice plan, and they found that receiving information significantly increased the fraction of parents who chose higher-performing schools. Their results also indicated that attending a higher-scoring school increased student test scores, thus implying that school choice would effectively increase academic achievement for disadvantaged students when parents could access school quality information. According to these results, parents and children referred to school quality information when choosing their school if they could access the information; therefore, high-quality schools attracted a large number of enrollments. Conversely, the number of enrollments at low-quality schools decreased. Additionally, because of the heterogeneity among schools and parents, children and parents that were more interested in education cared more about school quality; thus, high-quality schools might be attractive to students with high motivation or ability. Consequently, disparity in academic achievement among schools might expand due to disclosure of school quality information.
Recently, there have been several studies on the effect of disclosure of school quality information on the price of housing or land. Imberman and Lovenheim (2016) studied the effect of disclosure of value-added information regarding school quality. Their results suggest that parents and homeowners do not value the ability of schools and teachers to increase test scores, nor are they unaware of the importance of value-added information because the measures are derived from a complicated statistical model that is difficult for non-experts to understand. Carrillo, Cellini, and Green (2013) found evidence indicating that real estate agents selectively disclosed information on school assignments. They also found no significant effects of disclosure on home prices and observed point estimates very close to zero by controlling for school quality with elementary school fixed effects.
6
They reasoned that school quality information might be obtained by buyers before disclosure because of the growth of the Internet and the increasing availability of data. Haisken-DeNew et al.’s (2018) study examined the effect of launching a website providing standardized information about school quality to the Australian public. They found that favorable information on schools increased real estate prices, but bad information did not have a significant effect, and even controlling for school quality, this result is significant. They interpreted these results as indicative of buyers being unaware of the importance of school quality information and real estate agents conducting strategic and selective disclosure (i.e., disclosing information on good schools and not disclosing information on bad ones) to raise selling price.
In short, previous studies have found consistent results suggesting that disclosure of school quality information has a positive effect on academic performance in low-quality schools and increases the number of enrollments in schools with good quality. The former effect can reduce disparity between schools, while the latter can expand it. Due to heterogeneity among schools and parents, children and parents that are more interested in education care more about school quality; therefore, high-quality schools may be attractive to students with high motivation or ability. Thus, through disclosure, the scores of schools that originally had higher scores increased, while the scores of schools that originally had lower ones decreased. As a result, disparity between schools might expand.
However, there is no consistent evidence as to whether the real estate market accurately reflects of disclosure of information on school quality. If property prices within good school districts increase as a result of disclosure of information on school quality, parents have to pay more money to send their children high-quality schools. Therefore, high quality schools attract parents that have high income and high educational backgrounds, and disparity among schools may increase due to parents’ income and educational background strongly correlating with their children's academic ability.
Relative to the previous research discussed above, this study makes several contributions to the literature. First, by using housing prices instead of land prices, I was able to estimate and interpret the effect of test scores on the property market more clearly because rental housing data included indices regarding whether the properties were intended for families. I was also able to show that there were no events besides disclosure of school quality information that affected the property market by analyzing properties intended for single people and rental shops/offices that were thought insignificant in relation to school quality.
Second, I was able to demonstrate that the population of school-aged children changed as a result of disclosure, by using not only housing data but also population census data by age group of small areas. Previous studies have mainly suggested that housing rents will increase in high quality school districts due to selective disclosure by real estate agencies. However, in this study, I was able to show that disclosure of school quality information affected not only housing rents but also population. This suggests that the rise in housing rental reflects actual parents’ demands for their
7 children's education.
Third, I was able to clearly measure the effect of disclosure of public school quality information by focusing on a city where a school district system clearly existed and few private schools were present. Schwartz, Voicu, and Horn (2014) and Fack and Grenet (2010) suggest that the relationship between school quality and real estate price becomes weak when schools can be freely chosen irrespective of school district. Thus, if there are many ways to receive education besides public schools, the effects of school quality or disclosure might not be measured accurately. However, in Matsue City, which I analyzed, these problems were solved since most ways of receiving primary education are limited to public schools. Additionally, there are no entrance exams in Japanese public elementary and junior high schools; thus, the importance of residential choice is high.
Finally, I examined not only the effect of disclosure on the property market and population, but also on disparity between schools. In previous research, academic performance, school choice, and the property market have been evaluated, but in this study, I consider the effect of disclosure on all three categories. By doing so, I can suggest the possibility of the existence of the following mechanism: The disclosure of school quality information promotes parents’ residential choice behavior, which is reflected in the real estate market, and as a result, disparity between schools will expand. Although I cannot refer to each causal relation, it is important from a policy evaluation perspective to suggest the possibility that disparity will expand due to disclosure.
3. Empirical strategies
3.1. Housing rents
I estimated the effect of test scores on housing rents and the change in the effect due to information disclosure using hedonic regression. Since parents did not have a way of obtaining official information regarding school quality before disclosure, and they were able to access that information after disclosure for the first time, so the effects of the test score (which was an index of school quality) on housing rents would change before and after disclosure. Therefore, I regressed the interaction term of the test score and “after-disclosure dummy" on housing rentals with various control variables included. The basic estimation equation was as follows:
𝑙𝑙𝑙𝑙 𝑃𝑃𝑖𝑖𝑖𝑖𝑖𝑖𝑖𝑖= 𝛼𝛼 + 𝛽𝛽1𝑇𝑇𝑇𝑇𝑇𝑇𝑇𝑇𝑖𝑖∙ 𝐴𝐴𝐴𝐴𝑇𝑇𝑇𝑇𝐴𝐴𝑖𝑖+ 𝛽𝛽2𝑇𝑇𝑇𝑇𝑇𝑇𝑇𝑇𝑖𝑖+ 𝛽𝛽3𝐴𝐴𝐴𝐴𝑇𝑇𝑇𝑇𝐴𝐴𝑖𝑖+ 𝛾𝛾𝛾𝛾𝑖𝑖+ 𝛿𝛿𝛿𝛿𝑖𝑖+ 𝜃𝜃𝜃𝜃𝑖𝑖+ 𝜇𝜇𝜇𝜇𝑖𝑖𝑖𝑖+ 𝜀𝜀𝑖𝑖𝑖𝑖𝑖𝑖𝑖𝑖
where 𝑃𝑃𝑖𝑖𝑖𝑖𝑖𝑖𝑖𝑖 was the rent of apartment 𝑖𝑖 in area 𝑗𝑗 in attendance district 𝑎𝑎 in quarter 𝑇𝑇. 𝑇𝑇𝑇𝑇𝑇𝑇𝑇𝑇𝑖𝑖
was the test score of the school located in attendance district 𝑎𝑎, and was to be used as a proxy variable of the school's quality, which was converted into the deviation value and the rank of the school within the area from raw data. 𝐴𝐴𝐴𝐴𝑇𝑇𝑇𝑇𝐴𝐴𝑖𝑖 was the after-disclosure dummy taking one after
8
disclosure of school-level test scores1, or indicating the days elapsed from the date of disclosure. The
vector 𝛾𝛾𝑖𝑖𝑖𝑖𝑖𝑖 included characteristics of the apartments in question, such as occupied area and the age
of the building. 𝛿𝛿𝑖𝑖 was a quarter dummy and 𝜃𝜃𝑖𝑖 was an area dummy to control time and area fixed
effect respectively2. 𝜇𝜇
𝑖𝑖𝑖𝑖 contained the area characteristics that changed over time (such as
population and average age). 𝜇𝜇𝑖𝑖𝑖𝑖 also controlled for specific trends in the central urban and
suburban areas3, as well as the north and south areas4.
In the above estimation equation, 𝛽𝛽2 represented the effect of the test scores on housing rents
before disclosure of school-level test scores, and 𝛽𝛽1 represented the effect of test scores on housing
rents after disclosure. If parents considered the test scores as representative of school quality, and if they could not know that information before the disclosure of school-level test scores, there was no significant relationship between the test scores and housing rents before disclosure, and there should have been a significant relationship between the test scores and housing rents only after disclosure5.
As Carrillo, Cellini, and Green (2013) suggest, we must note that parents could obtain school quality information from not only official disclosure, but also other data source such as local communities and networks. Therefore, school quality was capitalized to a certain extent by housing rent before disclosure, but the impact of the first official disclosure of information was still large, and it might have had the effect of raising the rent, as well.
Additionally, I used the intersection terms of each quarter dummy and school rank to analyze changes in effect over time. I used the following estimation equation:
ln 𝑃𝑃𝑖𝑖𝑖𝑖𝑖𝑖𝑖𝑖 = 𝛼𝛼 + � 𝛽𝛽𝑖𝑖𝛿𝛿𝑖𝑖𝑇𝑇𝑇𝑇𝑇𝑇𝑇𝑇𝑖𝑖 20
𝑖𝑖=2 + 𝛾𝛾𝛾𝛾𝑖𝑖+ 𝛿𝛿𝛿𝛿𝑖𝑖+ 𝜃𝜃𝜃𝜃𝑖𝑖+ 𝜇𝜇𝜇𝜇𝑖𝑖𝑖𝑖+ 𝜀𝜀𝑖𝑖𝑖𝑖𝑖𝑖𝑖𝑖
where 𝛽𝛽𝑖𝑖 represented the impact of school quality on housing rents for each quarter 𝑇𝑇. In this study,
I performed my analysis using 20 quarterly (5 yearly) data, and information on school quality was disclosed between the 12th and 13th quarters. Therefore, with the first quarter (𝑇𝑇 = 1) as the baseline,
if school quality became capitalized related to housing rents due to disclosure, 𝛽𝛽𝑖𝑖 indicated
significance when 𝑇𝑇 ≥ 12. Conversely, if there was no significant relationship between school quality and housing rents before disclosure, 𝛽𝛽𝑖𝑖 indicated insignificance when 𝑇𝑇 < 12. I also
analyzed whether the effect of disclosure on housing rents was short-term or long-term. Additionally,
1 Specifically, this dummy variable took one after October 23, 2014.
2 I used quarter dummies instead of year dummies because the real estate market experiences seasonality.
I also analyzed data using month dummies, and the results were consistent.
3 The definitions of central urban and suburban were based on the "Matsue City Central Area
Revitalization Basic Plan" published by Matsue City.
4 Matsue City is divided into northern and southern areas by a large river, and each has different
characteristics. The southern area is downtown and has a central station, and the northern area is a residential one where a university and castle ruins exist.
5 Since the planned disclosure of school-level test scores was announced in local news, etc. for several
9
by confirming the significance of 𝛽𝛽𝑖𝑖 before the 12th quarter, we could also verify whether the
parallel trend assumption was satisfied.
3.2. Number of posted apartments
There was concern that the property data that I used in this study came from data posted on real estate information websites and did not indicate actual transactions. If cheap property was posted at a specific time and area, or a high-class condominium with large capacity was built during the analysis period, the average regarding property rentals might have been affected greatly. Additionally, if there was bias in the number of properties between the high-quality and low-quality school districts, the results might also have been biased accordingly. To deal with this concern, I estimated the number of samples in each area per month as the control variable. Additionally, I also made panel data which indicated the number of properties used for each area and month and estimated the number of properties regressed by the school quality indicator. The estimation equation used is as follows:
𝑁𝑁𝑖𝑖𝑖𝑖𝑖𝑖 = 𝛼𝛼 + 𝛽𝛽1𝑇𝑇𝑇𝑇𝑇𝑇𝑇𝑇𝑖𝑖∙ 𝐴𝐴𝐴𝐴𝑇𝑇𝑇𝑇𝐴𝐴𝑖𝑖+ 𝛽𝛽2𝑇𝑇𝑇𝑇𝑇𝑇𝑇𝑇𝑖𝑖+ 𝛽𝛽3𝐴𝐴𝐴𝐴𝑇𝑇𝑇𝑇𝐴𝐴𝑖𝑖+ 𝛿𝛿𝛿𝛿𝑖𝑖+ 𝜃𝜃𝜃𝜃𝑖𝑖+ 𝜇𝜇𝜇𝜇𝑖𝑖𝑖𝑖+ 𝜀𝜀𝑖𝑖𝑖𝑖𝑖𝑖
where 𝑁𝑁𝑖𝑖𝑖𝑖 indicated the number of posted properties in area 𝑗𝑗 in attendance district 𝑎𝑎 in quarter
𝑇𝑇. As in the case of estimating of housing rents, to analyze the change in the relationship between school quality and the number of posted properties over time, I estimated by using the intersection terms of the quarterly dummy and school quality. The estimation equation used is as follows:
𝑁𝑁𝑖𝑖𝑖𝑖𝑖𝑖 = 𝛼𝛼 + � 𝛽𝛽𝑖𝑖𝛿𝛿𝑖𝑖𝑇𝑇𝑇𝑇𝑇𝑇𝑇𝑇𝑖𝑖 20
𝑖𝑖=2 + 𝛿𝛿𝛿𝛿𝑖𝑖+ 𝜃𝜃𝜃𝜃𝑖𝑖+ 𝜇𝜇𝜇𝜇𝑖𝑖𝑖𝑖+ 𝜀𝜀𝑖𝑖𝑖𝑖𝑖𝑖𝑖𝑖
where 𝛽𝛽𝑖𝑖 represented the impact of school quality on the number of posted properties for each
quarter 𝑇𝑇. By these analyses, I was able to confirm that the number of posted properties had not changed in areas with high or low test scores. Specifically, there was no significant relationship between the number of posted properties and school quality.
3.3. Enrollment and population
Apart from analysis using housing rents, I also estimated the enrollments of each school and population by specific age of each area and each month as an independent variable to analyze the change in school and residential choice after disclosure. The estimation equation used is as follows:
𝐸𝐸𝑙𝑙𝐴𝐴𝐸𝐸𝑙𝑙𝑙𝑙𝑖𝑖𝑖𝑖= 𝛼𝛼 + 𝛽𝛽1𝑇𝑇𝑇𝑇𝑇𝑇𝑇𝑇𝑖𝑖∙ 𝐴𝐴𝐴𝐴𝑇𝑇𝑇𝑇𝐴𝐴𝑖𝑖+ 𝛽𝛽2𝑇𝑇𝑇𝑇𝑇𝑇𝑇𝑇𝑖𝑖+ 𝛽𝛽3𝐴𝐴𝐴𝐴𝑇𝑇𝑇𝑇𝐴𝐴𝑖𝑖+ 𝛿𝛿𝛿𝛿𝑖𝑖+ 𝜃𝜃𝜃𝜃𝑖𝑖+ 𝜇𝜇𝜇𝜇𝑖𝑖𝑖𝑖+ 𝜀𝜀𝑖𝑖𝑖𝑖𝑖𝑖
10
where 𝐸𝐸𝑙𝑙𝐴𝐴𝐸𝐸𝑙𝑙𝑙𝑙𝑖𝑖𝑖𝑖 indicated the number of enrollment students of school 𝑎𝑎, in year 𝑇𝑇, and 𝑃𝑃𝐸𝐸𝑃𝑃𝑜𝑜𝑖𝑖𝑖𝑖𝑖𝑖
indicated the number of people aged 𝐸𝐸 years old in area 𝑗𝑗 in attendance district 𝑎𝑎 in month 𝑇𝑇. For analysis on enrollment of students, I used panel data at the annual and school level, and analysis on population by age was estimated using panel data at the month and area level.
As with analysis of housing rents, I also analyzed changes in the effect of disclosure on population over time6. The estimation equation used is as follows:
𝑃𝑃𝐸𝐸𝑃𝑃𝑜𝑜𝑖𝑖𝑖𝑖= 𝛼𝛼 + � 𝛽𝛽𝑖𝑖𝛿𝛿𝑖𝑖𝑇𝑇𝑇𝑇𝑇𝑇𝑇𝑇𝑖𝑖 20
𝑖𝑖=2 + 𝛿𝛿𝛿𝛿𝑖𝑖+ 𝜃𝜃𝜃𝜃𝑖𝑖+ 𝜇𝜇𝜇𝜇𝑖𝑖𝑖𝑖+ 𝜀𝜀𝑖𝑖𝑖𝑖𝑖𝑖𝑖𝑖
By this estimation, I analyzed the change in population in the area with high (low) test scores.
4. Data
In this study, I mainly used three kinds of data (e.g., housing, school, and district data). This section provides detailed information regarding the data used.
4.1. About Matsue City
Matsue City is a regional city in southwest Japan. Its population was approximately 200,000 and its population density was approximately 390 people per square meters in 2018. The average score on national tests of elementary school students in Matsue City in 2014 was 66.613, which was almost the same as the national average of 66.175; therefore, Matsue City was an average city in terms of academic achievement.
In Matsue City, information on school quality was first disclosed in 2014. There was no official announcement on school quality (such as the average test score) before 2014, so parents were able to access this information for the first time after disclosure in 2014. Whether to disclose school-level results had been discussed since the beginning of 2014, and after disclosure had been decided upon, plans regarding it were announced on local news or websites a few months before the disclosure occurred. Therefore, it was believed that many people who lived in Matsue City knew about the disclosure and when it would take place.
There are several reasons why I focused on Matsue City, just like Kuroda (2018). The primary reason is that there are very few private elementary and junior high schools in Matsue City. If many private schools are present, the relationship between public school quality and housing rentals in the school district may be weakened because anyone can go to a private school regardless of where they live (Schwartz, Voicu, & Horn, 2014; Fack and Grenet, 2010). However, because there are few
11
private schools in Matsue City, we could clearly identify the effect of public school test scores on housing rentals because it was difficult for students to receive primary education from somewhere other than public schools.
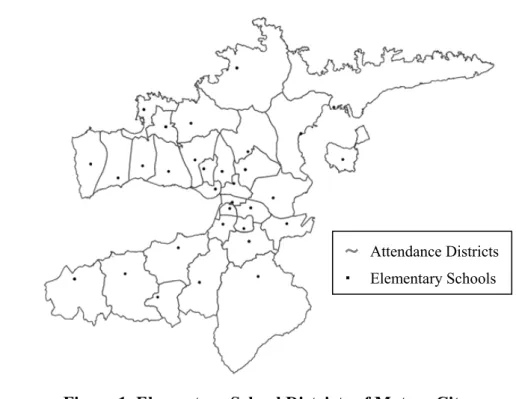
Furthermore, in Matsue City, a school choice system had not been introduced, and a school district existed. Therefore, the school that a student can attend is decided according to his/her residential address, and students cannot go to school outside the boundaries of their school district. In exceptional situations such as when an address is changed due to moving during the school fiscal year, students can go to school outside their school district; however, this situation is very rare. Therefore, in Matsue City, one’s place of residence is closely related to the quality of education that he or she can receive, and the importance of residential choice for parents with children is high. Figure 1 presents a map of the school districts in Matsue City used for this study. The bold black lines represent public elementary school district boundaries, and only one school exists in each school district.7 There are 35 public elementary schools in Matsue City, but the number of schools
used in this analysis was 25 because I could not use data for schools in non-urban areas where there were very few apartments in the district or where the district had a branch school that did not release its test scores due to a limited number of students. In Matsue City, the residential choice of parents could be influenced by school quality information due to identical school fees, lack of entrance examination, and the presence of several public transport options within the narrow area.
Figure 1. Elementary School Districts of Matsue City
7 As an exception, one branch school exists. However, since its number of students during the analysis
period was only one or two and its test scores were not disclosed, this school would not affect the estimation results.
~ Attendance Districts
12
4.2. Property data
I used rental property data from 2012 to 2016 for Matsue City from the “Real Estate Database 1999-2016.”8 This dataset includes nationwide real estate data from 1999 to 2016, and there are
22,767 samples from 2012 to 2016 for Matsue City. As I mentioned in the previous section, this property data was obtained from data posted on real estate information websites and did not indicate actual transactions. Property offered for sale by the real estate agency was included in this dataset, and it contained the date that properties were posted as for sale on the real estate websites.
In this study, I excluded land and sales property data from samples because I focused on rental properties. Each property had data on the property number, category (such as owned house or rental apartment, and newly or used), the rent or price, the occupied area (by square meter), the floor level, the number of floors in the building, the age of the building, the building’s construction (such as wooden or block), and the date of disclosure. As shown in Table 1, I set the dummy variables for each category (e.g. rental apartment, rental townhouse, rental mansion, rental store, or office9) and
structure (e.g. autoclaved lightweight aerated concrete, precast concrete, reinforced concrete, steel reinforced concrete, block, light steel, steel, and wooden). Furthermore, I set the “after-disclosure dummy” and “the number of elapsed days after disclosure.”
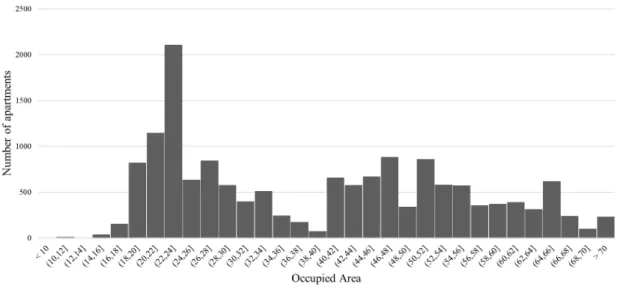
In this study, I defined apartments of over 40 square meters as "family-oriented apartments." In Japan, some real estate agencies have said that apartments with two or more rooms, or of 40 or more square meters are intended for families (e.g., Homemate, n.d.).10 As shown in Figure 2, it seems that
40 square meters is the boundary between one room and two or more rooms, so this definition was considered reasonable. I derived the main results using samples which included family-oriented apartments. To confirm the robustness of this definition, I also made estimates that divided the sample according to the occupied area.
Additionally, because this dataset did not contain a strict address, there were properties that could not be identified, such as to which school district a property belonged. In this study, since such properties were excluded from the sample, 16,065 properties (7,781 for families; 7,752 for singles; and 532 for rental shops and offices) were used for analysis.11
I must address another concern regarding whether parents with elementary school children lived in the apartments, since many people live in their own houses rather than rental properties in
8 This dataset was provided by the Center for Spatial Information Science, the University of Tokyo. 9 In Japan, the terms apartment, town house, and mansion all refer to a general type of residential real
estate, indicating a meaning similar to "apartments" in American English.
10 Of course, this definition changes depending on population density or economic conditions of a city,
but in Japanese local cities, it is ordinarily said that an apartment with 40 or 50 square meters or more is intended for families.
11 Analysis using all apartments and single-person apartments was also conducted, and the results were
used for confirming the robustness of the main results. Summary statistics of samples of single-person apartments and rental shops/offices are shown in Appendix A.
13
Japanese cities. Therefore, I demonstrated the relationship between household type and housing format in Shimane Prefecture12 as follows. Table 2 indicates the number of households by type in
Shimane Prefecture in 2013. The number of households in Shimane Prefecture was 254,700, of which 185,400 households (73%) lived in owned houses and 69,300 households (27%) lived in rented ones. However, households which had elementary school children (in this table, their age was assumed to be under 9 years old) exhibited a different tendency because many elderly households rather than younger ones tended to live in owned houses. Of all the three to five-person households evaluated, 5,100 households lived in owned houses and 8,800 households lived in rented ones. Specifically, over 60% of married couples with elementary school children lived in rented houses; therefore, it was reasonable to use the rented house for this study.
Figure 2. Number of Properties by Occupied Area
12 Matsue City is the capital city of Shimane Prefecture, and holds approximately one-third of the
population and households of the prefecture. Due to data constraints, I used Shimane Prefecture’s information instead of Matsue City’s.
14
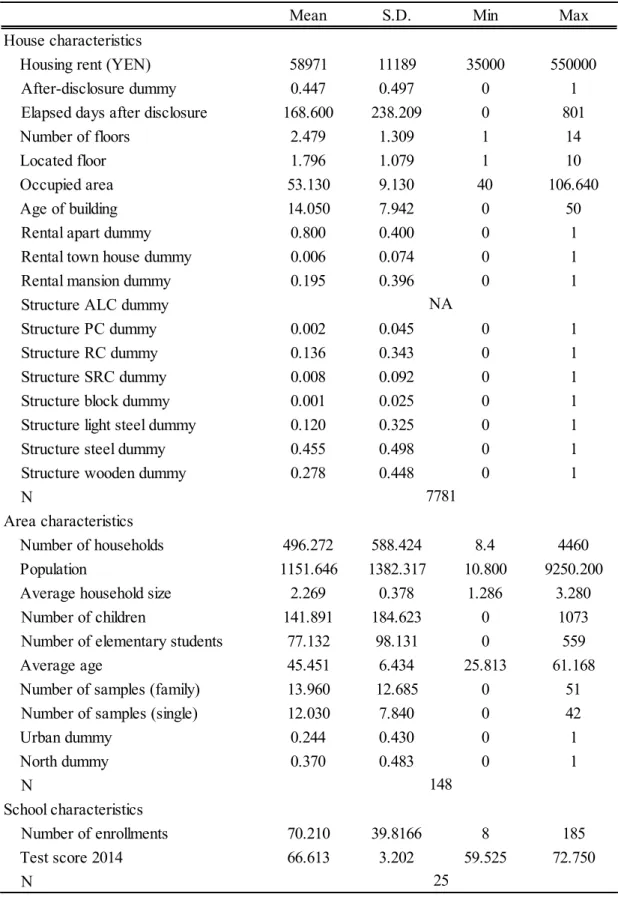
Table 1.
Summary Statistics (Main Estimation)
Mean S.D. Min Max
House characteristics
Housing rent (YEN) 58971 11189 35000 550000
After-disclosure dummy 0.447 0.497 0 1
Elapsed days after disclosure 168.600 238.209 0 801
Number of floors 2.479 1.309 1 14
Located floor 1.796 1.079 1 10
Occupied area 53.130 9.130 40 106.640
Age of building 14.050 7.942 0 50
Rental apart dummy 0.800 0.400 0 1
Rental town house dummy 0.006 0.074 0 1
Rental mansion dummy 0.195 0.396 0 1
Structure ALC dummy
Structure PC dummy 0.002 0.045 0 1
Structure RC dummy 0.136 0.343 0 1
Structure SRC dummy 0.008 0.092 0 1
Structure block dummy 0.001 0.025 0 1
Structure light steel dummy 0.120 0.325 0 1
Structure steel dummy 0.455 0.498 0 1
Structure wooden dummy 0.278 0.448 0 1
N
Area characteristics
Number of households 496.272 588.424 8.4 4460
Population 1151.646 1382.317 10.800 9250.200
Average household size 2.269 0.378 1.286 3.280
Number of children 141.891 184.623 0 1073
Number of elementary students 77.132 98.131 0 559
Average age 45.451 6.434 25.813 61.168
Number of samples (family) 13.960 12.685 0 51
Number of samples (single) 12.030 7.840 0 42
Urban dummy 0.244 0.430 0 1 North dummy 0.370 0.483 0 1 N School characteristics Number of enrollments 70.210 39.8166 8 185 Test score 2014 66.613 3.202 59.525 72.750 N 148 25
※ALC, PC, RC, and SRC stand for "Autoclaved Lightweight aerated Concrete", "Precast Concrete", "Reinforced Concrete", and "Steel Reinforced Concrete", respectively.
NA
15
Table 2.
Number of Households Living in Owned Houses and Rented Houses
4.3. Area data
I obtained statistical data and information on school districts from Matsue City’s official website. Population census data are reported on the website monthly, and populations by age and gender in each area are described.13 In the main estimation, I used the number of households, population,
average age, number of people per household, number of children (under 12 years old), number of elementary school students, and total population by each area and each month to control for local characteristics that change over time. The number of areas was 148, and details of each variable are shown in Table 1. In Matsue City, the residential environment is totally different in central urban areas versus the suburbs14, so I controlled for different time trends of housing rentals, respectively.
Additionally, because the characteristics and amenities of houses are different between areas north and south of the central river, I also controlled for different trends, respectively.
4.4. School data
In this study, I used two kinds of data on schools: the number of enrolled students and the results of academic achievement tests. The summary statistics are shown in Table 1. Test scores were derived from two types of tests: 6th grade elementary school students took the National Assessment of Academic Ability (NAAA), and 4th and 5th grade elementary school students took the Shimane Academic Ability Survey (SAAS). I used the sum of the math and language test scores, averaged over 3 years, as the test score for each school. The NAAA is the scholastic ability examination that the Ministry of Education, Culture, Sports, Science and Technology (MEXT) has carried out once
13 In this study, the minimum unit of address was called "area." This is known as "cho-cho" in Japanese,
which describes a location that is more detailed than a city but less detailed than an exact street address. Although not strict, it refers to a location such as a street name in the United States.
14 Central urban areas are commercial areas that are centered about Matsue Station, and there are many
residential areas and agricultural lands in the suburbs.
Type of household Owned houses Rented houses Total
Total 185,400 69,300 254,700
Single-person households 33,100 35,000 68,100
Two-person households 60,800 14,000 74,800
Three- to five-person households
married couple and children (under 9 years old) 5,100 8,900 14,000
married couple and children (from 10 to 17 years old) 7,600 4,200 11,800
married couple and children (over 18 years old) 43,400 3,300 46,700
others 15,000 3,000 18,000
Over six-person households 15,300 800 16,100
16
per year since 2007, and it is applied to sixth and ninth graders. The SAAS is the scholastic ability examination that Shimane Prefecture originally conducted, and it is applied to 4th, 5th, and 6th graders in public elementary schools and students in public junior high schools. In Matsue City, however, the SAAS was applied only to 4th, 5th, 7th, and 8th grade students because 6th and 9th graders took the NAAA instead of the SAAS.
Both academic ability tests did not disclose school-level results before October 2014, and school-level results were first disclosed on October 22, 2014. The NAAA was administered on April 22, 2014, and the SAAS was given on April 24th and 25th. After 2015, these tests began being
conducted around May, and results are disclosed at the end of October every year. In this study, I considered the test scores of 2014 as the scores for each school and used them, since school-level test scores did not demonstrate extreme change over several years.
For analysis, the test scores were converted into a deviation value, and the school rankings of the test scores were also used.15 This was because parents might have considered the rank of a school in
the region, rather than how many points the school’s score had risen. In either case, results that were almost consistent were obtained, but I show both results below to compare the coefficients with the previous studies.
5. Results and discussions
5.1. Main results for the housing market
Table 3 shows the results of estimating the housing samples by restricting them into family-oriented apartments.16 Column (1) indicates the results of using deviation values while
controlling for house and area characteristics. This result shows that school quality had a significant positive effect on housing rents before disclosure of school quality information, and the effect was significantly increased additionally after disclosure. Column (2) shows the result of controlling time fixed effects in addition to column (1), but the result was almost the same as in the first column. Column (3) shows the result of adding area fixed effects to the control variables, and the coefficient of the interaction term of school quality indicator and the after-disclosure dummy still had significant positive effect, although the impact was weaker than in columns (1) and (2). Column (4)
15 The deviation value was obtained by normalizing the test score so that the mean was 50 and the
standard deviation was 10, and this value is ordinarily used in Japan as the index of students’ academic achievement. Specifically, it is derived by dividing the difference between each test score and the mean of test scores by the standard deviation, multiplying by 10, and adding 50.
16 I analyzed data using all the samples without dividing, but the results suggested that main variables
had no significant effect on housing rents if I controlled for all the variables (see Appendix B and C). I interpreted these results as suggesting that the impact of family-oriented and single-person apartments was canceled out.
17
shows the result of adding the different trends in the central urban and suburban areas, and column (5) shows the result of adding the different trends in the northern and southern portions of the city, but the coefficients of the intersection term were still positive and significant. These results indicated that the rents of family-oriented apartments located within a high-quality school district significantly increased additionally after the disclosure of school quality information, and these results were robust even if various variables were controlled. The effect of the disclosure of school quality information on single-person apartments will be analyzed in a later subsection. The bottom part of Table 3 shows the results of estimation using school rank instead of deviation value as a proxy variable of school quality. Since the level of school ranking decreased as school quality increased, the main coefficients indicated the opposite of the results using deviation value. Column (6) shows the results of controlling the house and area characteristics similarly to column (1), and the results indicated that school quality had a significant positive effect on housing rents before disclosure, but the effect was strengthened by disclosure. The results of columns (7)-(10) are also similar to those of column (2)-(5). Summarizing the main result of this study, after disclosure of information on school quality, rents of family-oriented apartments located in a district with a high-quality school increased compared to those located in a school district with a low-quality school.17
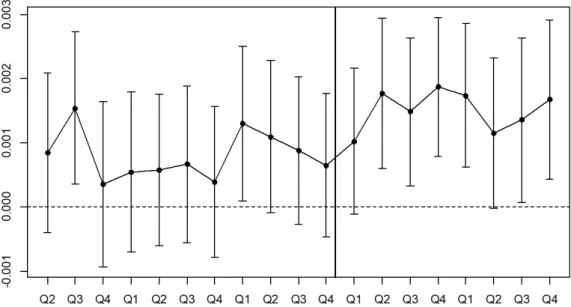
Table 4 shows the result using the number of elapsed days from disclosure instead of the after-disclosure dummy, were other specifications the same as in Table 3. Columns (1) and (2) show the results of using deviation value without controlling the area fixed effects. Both results showed that the interaction terms were positive and significant coefficients, suggesting the possibility that test score would affect housing rents gradually as time passed after disclosure. Column (3) shows the results of adding the area fixed effects, Column (4) shows the result of adding the different trends in the central urban and suburban areas, and column (5) shows the result of adding the different trends in the northern and southern parts of the city. All the coefficients of intersection terms were still positive and significant, but the number of elapsed days had no significant effect on housing rents. The results from column (6) to column (10) showed the same results as column (1) to column (5), and there were no large differences between deviation value and school rank in this estimation. To analyze the effect of changing over time, I estimated using the intersection terms of each quarter dummies and school quality indicator, and the results are shown in Table 5 and Figure 3.18
Column (1) and column (2) show the results obtained using deviation value and school rank respectively. In Figure 3, the horizontal axis represents time, the vertical axis represents the
17 I also analyzed data using housing rents per occupied area used in previous studies instead of raw
housing rents; however, the results were almost the same as those obtained using raw housing rents data. The results are shown in Appendix D.
18 The result of estimating the effect of change over time using single-person apartments is shown in
Appendix E. According to the results, rentals of single-person apartments showed a decreasing trend before disclosure, and the assumption of a parallel trend was not satisfied. Results using single-person apartments will be interpreted in detail in Section 5.2.1.
18
coefficient, the black dot represents the coefficients of interaction terms of each quarter dummy and school quality indicator, and each width represents the 95% confidence interval. According to the results of Table 5, school quality had a nearly significant effect on housing rents before disclosure of school quality information. Specifically, there was no significant difference in housing rents between high-quality school districts and low-quality school districts before disclosure, which also suggests that the probability of satisfying the parallel trend assumptions was high. However, after disclosure of school quality information, school quality had a significant positive effect on housing rents. These results emphasized that the rise in housing rents for family-oriented apartments was not due to prior trends or other shocks, but was certainly due to disclosure of school quality information. Although it was not statistically significant, it was important to note that even when controlling various variables and fixed effects, the rents of apartments in a high-quality school district were higher than those in a low-quality school district. This suggests that even before the official disclosure occurred, residents might have accessed school quality information from informal sources such as reputations or rumors. In fact, in areas where school quality information was not disclosed, unofficial information on school quality was available through parents’ interactions or local communities, so this is a plausible explanation.
Regarding the impact of the main regression results, the results for column (5) in Table 3 suggest that a 10-point increase in deviation value led to an approximately 0.05 percent additional increase in housing rents after disclosure. This implied that parents were willing to pay JPY294 more in monthly rent for housing, and this impact was very small (the mean associated with housing rents was approximately JPY59,000). This impact was about two-thirds of the result obtained by Kuroda (2018) that analyzed using cross-sectional data after disclosure in Matsue City. There were several reasons why the impact was small compared to previous studies on school quality and the housing market. First, school quality might have already been capitalized in relation to housing rentals to some extent before disclosure. As mentioned above, there were several ways to obtain information on school quality besides through the official disclosure, although accuracy was not guaranteed, so real estate agents and parents might have made decisions based on that information before the disclosure. In column (2) of Table 3, the sum of the coefficients of the deviation value and the interaction term suggests that housing rents increased by 3.7%, with the increase of one standard deviation, which was consistent with the results of several previous studies indicating that one standard deviation was related to a 2 - 5% higher property price ((Black, 1999; Bayer, Ferreira, & McMillan, 2007). Second, there might be strong heterogeneity among parents’ behavior with respect to school quality, as previous studies suggested (Koning and van der Wiel, 2013; Ries and Somerville, 2010). This might lead to a small impact and large significance indicating that a certain minority of parents are very concerned about school quality, but the majority do not care about it. Third, since there were not many parents interested in education compared to those in large cities
19
that were used in previous studies, the impact on the real estate market might be relatively small. Parents who are interested in education enough to care about elementary school quality tend to live in a metropolitan city where many schools are available that provide advanced elementary education. In fact, there are many high-quality private elementary schools, kindergartens, and cram schools for young children in large cities such as Tokyo, and supply and demand for advanced primary education are also high. Therefore, there may be relatively fewer parents who are interested in primary education for their children in smaller areas like Matsue City compared to large cities.
20
Table 3. Baseline Results
(1) (2) (3) (4) (5)
Deviation value .0026*** .0025***
(.0001) (.0001)
After-disclosure dummy -.0710*** -.0642*** -.0281** -.0358*** -.0245**
(.0086) (.0105) (.0088) (.0093) (.0090)
Deviation value × After-disclosure dummy .0012*** .0012*** .0006*** .0007*** .0005**
(.0002) (.0002) (.0001) (.0002) (.0002)
Control variables
House characteristics YES YES YES YES YES
Area characteristics YES YES YES YES YES
Time fixed effects YES YES YES YES
Area fixed effects YES YES YES
Urban/suburban trends YES YES
North/south trends YES
N 7617 7598 7513 7494 7475 Adjusted R2 0.6638 0.6668 0.7754 0.7782 0.7795 (6) (7) (8) (9) (10) School rank -.0033*** .-0033*** (.0002) (.0002) After-disclosure dummy .0095* .0186* .0106 .0147* .0096 (.0039) (.0076) (.0058) (.0059) (.0058)
School rank × After-disclosure dummy -.0018*** -.0018*** -.0008*** -.0010*** -.0007***
(.0002) (.0002) (.0002) (.0002) (.0002)
Control variables
House characteristics YES YES YES YES YES
Area characteristics YES YES YES YES YES
Time fixed effects YES YES YES YES
Area fixed effects YES YES YES
Urban/suburban trends YES YES
North/south trends YES
N 7617 7598 7513 7494 7475
Adjusted R2 0.6623 0.6655 0.7754 0.7783 0.7795
※*, **, and *** indicate statistical significance at 5%, 1%, and 0.1%, respectively. ※Standard errors are adjusted for clustering at the area level.
21
Table 4. Elapsed Days
(1) (2) (3) (4) (5)
Deviation value .0026*** .0026***
(.0001) (.0001)
Number of elapsed days -1.584×10⁻⁴*** -.8402×10-4 -.2082×10-4 -.3701×10-4 -.2163×10-4
(.1828×10-4) (.4599×10-4) (.3571×10-4) (.3599×10-4) (.3559×10-4) Deviation value × Elapsed days 2.678×10⁻⁶*** 2.627×10⁻⁶*** 1.234×10⁻⁶*** 1.444×10⁻⁶*** 1.134×10⁻⁶***
(.3664×10-6) (.3630×10-6) (.3159×10-6) (.3421×10-6) (.3248×10-6) Control variables
House characteristics YES YES YES YES YES
Area characteristics YES YES YES YES YES
Time fixed effects YES YES YES YES
Area fixed effects YES YES YES
Urban/suburban trends YES YES
North/south trends YES
N 7617 7598 7513 7494 7475
Adjusted R2 0.6636 0.6671 0.7755 0.7782 0.7796
(6) (7) (8) (9) (10)
School rank -.0034*** -.0034***
(.0002) (.0002)
Number of elapsed days 2.802×10⁻⁵*** 9.980×10-5* 6.316×10-5 6.092×10⁻⁵ 5.416×10⁻⁵ (.8120×10-5) (4.378×10⁻⁵) (3.338×10⁻⁵) (3.342×10⁻⁵) (3.325×10⁻⁵)
School rank × Elapsed days -3.916×10⁻⁶*** -3.861×10⁻⁶*** -1.632×10⁻⁶*** -1.891×10⁻⁶*** -1.406×10⁻⁶*** (.4931×10-6) (.4900×10-6) (.4252×10-6) (.4530×10-6) (.4255×10-6)
Control variables
House characteristics YES YES YES YES YES
Area characteristics YES YES YES YES YES
Time fixed effects YES YES YES YES
Area fixed effects YES YES YES
Urban/suburban trends YES YES
North/south trends YES
N 7617 7598 7513 7494 7475
Adjusted R2 0.6618 0.6657 0.7755 0.7782 0.7795
※*, **, and *** indicate statistical significance at 5%, 1%, and 0.1%, respectively. ※Standard errors are adjusted for clustering at the area level.
22
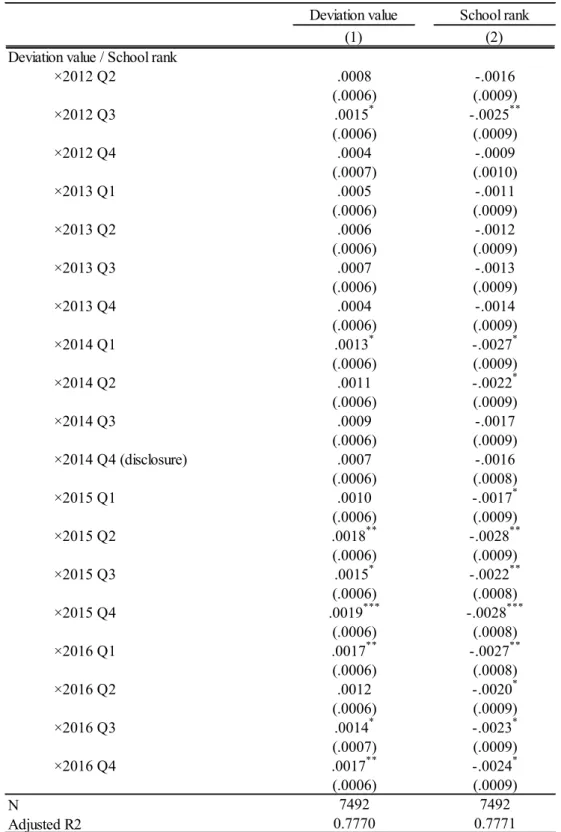
Table 5. Changes in Effect Over Time
Deviation value School rank
(1) (2)
Deviation value / School rank
×2012 Q2 .0008 -.0016 (.0006) (.0009) ×2012 Q3 .0015* -.0025** (.0006) (.0009) ×2012 Q4 .0004 -.0009 (.0007) (.0010) ×2013 Q1 .0005 -.0011 (.0006) (.0009) ×2013 Q2 .0006 -.0012 (.0006) (.0009) ×2013 Q3 .0007 -.0013 (.0006) (.0009) ×2013 Q4 .0004 -.0014 (.0006) (.0009) ×2014 Q1 .0013* -.0027* (.0006) (.0009) ×2014 Q2 .0011 -.0022* (.0006) (.0009) ×2014 Q3 .0009 -.0017 (.0006) (.0009) ×2014 Q4 (disclosure) .0007 -.0016 (.0006) (.0008) ×2015 Q1 .0010 -.0017* (.0006) (.0009) ×2015 Q2 .0018** -.0028** (.0006) (.0009) ×2015 Q3 .0015* -.0022** (.0006) (.0008) ×2015 Q4 .0019*** -.0028*** (.0006) (.0008) ×2016 Q1 .0017** -.0027** (.0006) (.0008) ×2016 Q2 .0012 -.0020* (.0006) (.0009) ×2016 Q3 .0014* -.0023* (.0007) (.0009) ×2016 Q4 .0017** -.0024* (.0006) (.0009) N 7492 7492 Adjusted R2 0.7770 0.7771
※*, **, and *** indicate statistical significance at 5%, 1%, and 0.1%, respectively. ※Standard errors are adjusted for clustering at the area level.
※All control variables (house characteristics, area characteristics, year fixed effects, area fixed effects, urban/suburban trends, and north/south trends) were controlled.
23
Table 5 - Column (1),
Changes in the effect of deviation value on rents of family-oriented apartments
Table 5 - Column (2),
Changes in the effect of school rank on rents of family-oriented apartments
24
In summary, the main finding in this study showed that school quality indicators such as deviation value and school rank had a significantly positive effect on rents of family-oriented apartments after disclosure of school quality information. Even before disclosure, school quality might have had a positive effect on housing rents. In the following section, I also analyze information concerning the heterogeneity of properties and verify that the main results were certainly derived from disclosure of information on school quality.
5.2. Various concerns
5.2.1. Placebo test
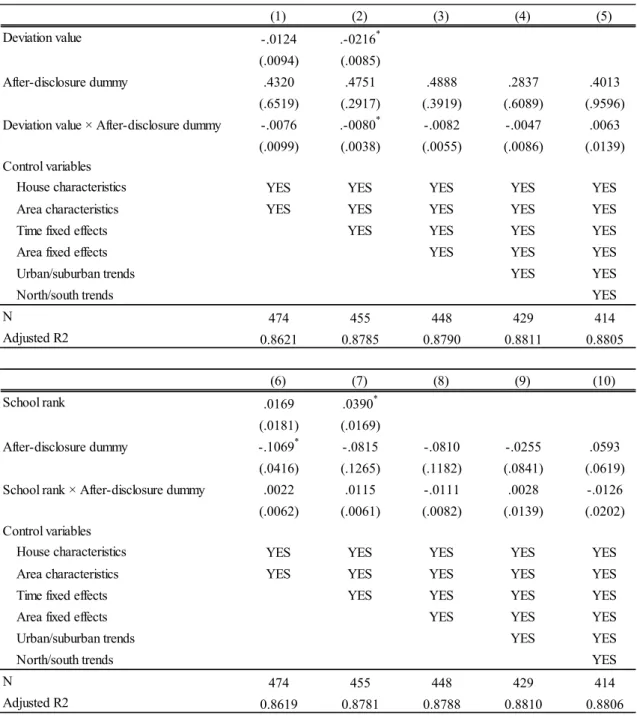
To ensure that change in rents of apartments was caused from nothing else but disclosure of school quality information, I conducted a placebo test using rents of units other than family-oriented apartments. If events which could have affected housing rents occurred at the same time as disclosure, the rent of properties such as shops and offices or single-person apartments that would not have been affected intrinsically by school quality might also have been impacted. To address this concern, I obtained results using rental shops, offices, and single-person apartments by estimating the same equation used in the main estimation. Table 6 shows the results obtained using rental shops and offices, and these results suggest that all the main variables are statistically insignificant if controlling for various variables. Of course, I must note that the rental shops and offices were located mainly in commercial areas and the number of samples was smaller than that of the residential properties.
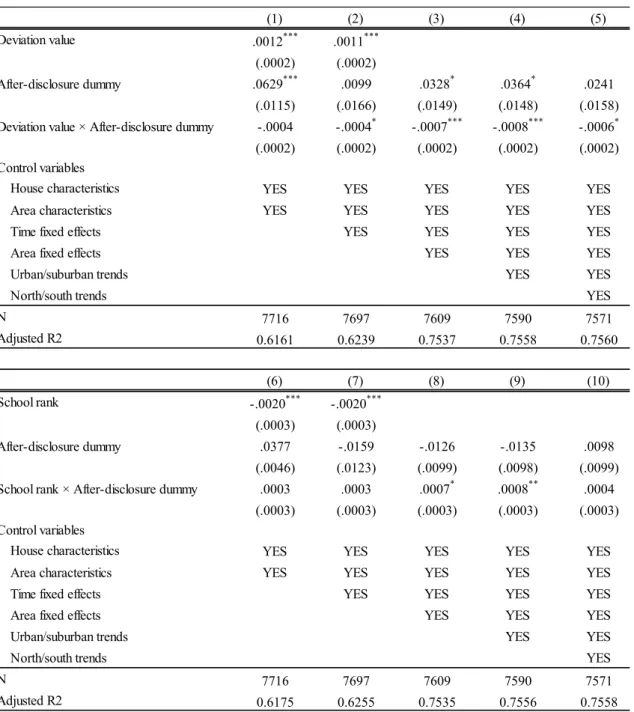
Therefore, I analyzed data using single-person apartments. These apartments are located widely in the city, and in my dataset, the number of samples was almost the same as that of family-oriented apartments (7,781 for families; 7,752 for singles). The results are shown in Table 7, and the basic specification was the same as the main estimation. Columns (1), (2), (6), and (7) show results not controlling for regional fixed effects and coefficients of interaction terms that were indicated consistently negative, although significances were low. However, the results after controlling for area fixed effects and urban/suburban trends are shown in columns (3), (4), (8), and (9). These results suggest that school quality has a significantly negative effect on housing rents after disclosure. However, controlling the northern/southern trends weakened the significance of coefficients of interaction terms, and in column (10), which shows the result obtained by using school rank, the coefficient of the interaction term was insignificant. Additionally, as a result of analyzing the changes of the effect over time using quarterly dummies, we could see that housing rents for single-person apartments tended to decrease in areas with high test scores even before disclosure. (The results are shown in Appendix E.) In summary, the results in this section indicated that
25
disclosure of school quality information had no significant effect on housing rents of single-person apartments, nor had any events occurred that affected the housing market at the same time as the disclosure.
As for what actually happens regarding single-person apartments, this can be inferred by considering the demanders of these units. University students can be cited as major users of single-person apartments in smaller cities in Japan. Shimane University, which has approximately 6,000 students, is located in Matsue City, and the residential area of the university’s students overlaps with the attendance districts of two elementary schools which rank 1st and 2nd in test
scores.19 The number of enrolled students at Shimane University is decreasing every year, which
may be one reason why rents of single-person apartments are decreasing in an area that has high-quality schools.20 In fact, enrollments decreased by approximately 100 (from 1,602 to 1,507)
between 2008 and 2016. Specifically, enrollments decreased by 43 (from 1,576 to 1,530) between 2013 and 2014 when housing rents of single-person apartments decreased significantly. Therefore, it seems that the downtrend of rents of single-person apartments might be due to the decreasing number of university students, and not the effect of disclosure.
19 The definition of the residential area where the students of Shimane University live is based on the
standards published by the Shimane University Cooperative.
20 According to statistical information published by Matsue City, the populations of the "north" and
"south" areas are almost the same (the north has 73,576 people, and the south has 72,595). However, the northern area where Shimane University is located has more than 800 people aged 18 to 22 than the southern area does. Therefore, the existence of Shimane University and the number of students can affect the housing market.
26
Table 6. Results using Shops and Offices
(1) (2) (3) (4) (5)
Deviation value -.0124 .-0216*
(.0094) (.0085)
After-disclosure dummy .4320 .4751 .4888 .2837 .4013
(.6519) (.2917) (.3919) (.6089) (.9596)
Deviation value × After-disclosure dummy -.0076 .-0080* -.0082 -.0047 .0063
(.0099) (.0038) (.0055) (.0086) (.0139)
Control variables
House characteristics YES YES YES YES YES
Area characteristics YES YES YES YES YES
Time fixed effects YES YES YES YES
Area fixed effects YES YES YES
Urban/suburban trends YES YES
North/south trends YES
N 474 455 448 429 414 Adjusted R2 0.8621 0.8785 0.8790 0.8811 0.8805 (6) (7) (8) (9) (10) School rank .0169 .0390* (.0181) (.0169) After-disclosure dummy -.1069* -.0815 -.0810 -.0255 .0593 (.0416) (.1265) (.1182) (.0841) (.0619)
School rank × After-disclosure dummy .0022 .0115 -.0111 .0028 -.0126
(.0062) (.0061) (.0082) (.0139) (.0202)
Control variables
House characteristics YES YES YES YES YES
Area characteristics YES YES YES YES YES
Time fixed effects YES YES YES YES
Area fixed effects YES YES YES
Urban/suburban trends YES YES
North/south trends YES
N 474 455 448 429 414
Adjusted R2 0.8619 0.8781 0.8788 0.8810 0.8806
※*, **, and *** indicate statistical significance at 5%, 1%, and 0.1%, respectively. ※Standard errors are adjusted for clustering at the area level.
27
Table 7. Results using Single-Person Apartments
(1) (2) (3) (4) (5)
Deviation value .0012*** .0011***
(.0002) (.0002)
After-disclosure dummy .0629*** .0099 .0328* .0364* .0241
(.0115) (.0166) (.0149) (.0148) (.0158)
Deviation value × After-disclosure dummy -.0004 -.0004* -.0007*** -.0008*** -.0006*
(.0002) (.0002) (.0002) (.0002) (.0002)
Control variables
House characteristics YES YES YES YES YES
Area characteristics YES YES YES YES YES
Time fixed effects YES YES YES YES
Area fixed effects YES YES YES
Urban/suburban trends YES YES
North/south trends YES
N 7716 7697 7609 7590 7571 Adjusted R2 0.6161 0.6239 0.7537 0.7558 0.7560 (6) (7) (8) (9) (10) School rank -.0020*** -.0020*** (.0003) (.0003) After-disclosure dummy .0377 -.0159 -.0126 -.0135 .0098 (.0046) (.0123) (.0099) (.0098) (.0099)
School rank × After-disclosure dummy .0003 .0003 .0007* .0008** .0004
(.0003) (.0003) (.0003) (.0003) (.0003)
Control variables
House characteristics YES YES YES YES YES
Area characteristics YES YES YES YES YES
Time fixed effects YES YES YES YES
Area fixed effects YES YES YES
Urban/suburban trends YES YES
North/south trends YES
N 7716 7697 7609 7590 7571
Adjusted R2 0.6175 0.6255 0.7535 0.7556 0.7558
※*, **, and *** indicate statistical significance at 5%, 1%, and 0.1%, respectively. ※Standard errors are adjusted for clustering at the area level.
28
5.2.2. Estimation of divided samples
In this section, I analyzed data considering heterogeneity of effect regarding school quality and disclosure. The degree of effect of school quality might differ depending on house characteristics or location. As larger houses are better suited for families, people living in these dwellings are likely to have children and may be more concerned about school quality. Additionally, parents with higher education and income tend to live in larger houses, so rents of these units may be more affected by test scores. Furthermore, since the definition of an area suitable for occupation by a family (over 40 square meters) is arbitrary, I must also analyze data using occupied areas other than those meeting this definition. To address this concern, I estimated by dividing the sample according to occupied area.
Table 8 shows the result of estimation performed by dividing all the samples by every 10 square meters according to the occupied area. The upper part of the table shows the results obtained using deviation value, and the lower part shows the results obtained using school rank. Most of the intersection terms of interest were not significant, but the interaction terms in columns (3), (6), and (12) were significant. The result of column (3) suggests that rents of apartments of 30-40 square meters in size that were located in high-quality school districts decreased after disclosure of school quality information. However, as mentioned in the previous section, this result might be led by the effect of the decreasing number of university students, not disclosure. The results of columns (6) and (12) suggest that the rents of apartments of over 60 square meters in size that were located in high-quality school districts significantly increased after disclosure of school quality information. The results showed that the more housing units were intended to be lived in by families, the more they were affected by school quality. This tendency was consistent with the results of previous studies (Kuroda, 2018; Carrillo, Cellini, and Green, 2013). Additionally, this result also suggests that high income or highly educated parents that tend to live in larger apartments may care more about school quality.
The effect of school quality on housing rents might differ depending not only on the size of the apartment, but also on the area where the apartment is located. An apartment located in an area where there are many children may be more affected by test scores. Conversely, even apartments intended for families may not be affected by school quality if they are in areas with few children. Specifically, if disclosure of school quality information has a significant effect on housing rents even in areas with few children, this suggests the possibility that events affecting housing rents other than disclosure were occurring at the same time. To address this concern, I estimated by dividing the sample according to the number of children in each area.