(East China University of Science and Technology)Tang Songlian, Lin Shengyue
Ultimate Controlling Shareholders, Institutional
Ownership and Corporation Resources Allocation
Efficiency: Evidence from China*
Abstract: How does the ownership structure affect the corporate governance, is always a hot
topic which researcher pay attention in the field of capital structure. Recent years, institutional investors have rapid development in china. Whether they can affect corporation resources al-location efficiency (CRAE)? Using institutional investor ownership data of listed firms over the period 2005-2011 in China, we investigate whether institutional investors can optimize corporate resource allocation efficiency. And the degree of optimization varies with different with Ultimate Controlling Shareholders or institutional investment style? We find that institution ownership really can promote corporate resource allocation efficiency. While fund and dedicated fund can cut down over-investment and alleviate under-investment, Transient fund and Quasi-indexer Fund cannot affect corporate resource allocation efficiency. Further, we find that ultimate con-trolling shareholders of listed companies will affect institutional investor ownership and corpo-rate resource allocation efficiency. And this kind of influence mainly reflect in company which controlled by local governments.
Keywords: Corporate resource allocation efficiency, Over-investment, Under-investment,
Insti-tutional investors, Ultimate controlling shareholders
1. Introduction
Shleifer and Vishny (1986) argue that in some degree institutional ownership can strengthen the company internal supervision mechanism. as an important external governance, Institution-al investors provide a new way to improve the governance mechanism for listed Corporation in China. For example, In August 2006, in the face of force against by institutional investors, Wuliangye Corporation gives up to buy Pashtoon Group Corporation ,Instead of only acquisition alcohol-related assets in Pashtoon group. The reason is that Wuliangye Group Corporation has rare success case in diversification strategy since 1997(What’s more, Wuliangye Corporation has endeavored in diversification strategy since 1997, but with little success, which in turn led to the worries of its main business). We can see that in the face of management over-investment, insti-tutional investors do not choose silence or withdraw from the company, but the force against,
* Corresponding author. TEL:13482449633.E-mail addresses: [email protected]. (Songlian Tang) We are acknowledging financial support from the National Nature Science Foundation of China
act active shareholders, then lead to the acquisition of downsizing and rationalization in finally. In recent years, researcher repeatedly verified that the feasibility of institutional investors participate in corporation resources allocation. Cella (2012) found that as the increasing long-term institutional shareholders, the degree of over-investment may be reduced. The degree of under-investment may be reduced in under-investment Company. But the short-term institu-tional shareholders can not affect the corporation’s investment decisions. Najah and Attig (2011), Elyasiani (2010) show that institutional investors are more incentive to encourage and supervise investment expenditure. Huddart (1993), Vishny (1996), Gasparetal (2005), Noe (2002) found that the larger institutional shareholding brought the right to access to investment decision, which prompted institutional investors to influence on corporate investment decisions through partici-pation in the supervision and control the company affairs. In China, Wang and Xiao (2005), Yuan (2009), Bo and Wu (2009), Pan (2010), Yang (2010) the empirical results show that institutional investors are helpful to inhibit the inefficiency investment behavior.
Previous research has opened a very good perspective for us, but there are some issues worth further studying. Such as whether institutional investment style and ultimate controlling shareholder can influence the relationship between institutional shareholders and resource al-location efficiency. In this paper, using 2005-2011 Listing Corporation in China as a sample, we investigate whether institutional investors can optimize corporate resource allocation efficiency. And whether the degree of optimization varies with different ownership property or different institution behavior style? We find that institution ownership really can promote corporate resource allocation efficiency. While Fund and Dedicated Fund can curb over-investment and alleviate under-investment, Transient Fund and Quasi-indexer Fund cannot affect corporate resource allocation efficiency. Further more, we find that ultimate controlling shareholders in listed companies will affect the relationship between institutional investor ownership and corporate resource allocation efficiency. And this kind of influence mainly reflect in company which controlled by local governments. The results of empirical research indicated that insti-tutional shareholders can control the over-investment and alleviate the under-investment. But the mechanism that different investment styles effects on the efficiency resource allocation is totally different.
The innovation in this paper is that: (1) considering the heterogeneity of institutional inves-tors, research on different institutional investment styles effect on the corporation governance. (2) Research on different ultimate controller shareholder may influence institutional investors’ governance function. From the state-owned ultimate ownership and private ultimate property, studies on different types of institutional ownership effect on resource allocation efficiency, fur-thermore, the state-owned ultimate property may be divided into the central government and local government.
The remaining part is as follows: the second part is the literature review and put forward the hypothesis; the third part introduces the research design; the fourth part is the empirical testing and analysis; the fifth part is the robust test; the last part is the conclusion and some suggestions.
2 Literature Review and Hypothesis Development
2.1 Institutional ownership and Company Resource Allocation Efficiency
The existing research focused on the asymmetric information and agency problems will make the company deviates from the optimal investment level, lead to over-investment or un-der-investment problem, which affects resource allocation efficiency (Hubbard, 1998). Gomes and Novas (2005) points out, ownership control can not only reduce the managers’ private interests, but also can prevent the major shareholder transfer resources from the company.
Compared to the minority shareholders, the characterizers of institutional investors is capital strength, high professional quality, strong ability of information discovery and excavation, It can supervise the management, reduce the agency cost, ease conflict between major shareholders and minority shareholders, that is the role of “shareholder activism”. Shleifer and Vishny (1986) put forward that institutional investors are helpful to inhibit the company’s inefficient invest-ment. Najah et al. (2011) study confirmed the long-term investment institutional investors have the power and the ability to supervise, alleviate the information asymmetry and agency prob-lems, and reduce over-investment. Liu and Bredin (2012) study found that funds and securities companies can significantly reduce the over-investment, active shareholder behavior exist in emerging countries, and the control of excessive investment is an important channel for institu-tional investors affect company performance.
In China, some empirical research the perspective of institutional investors in corporate governance effect from inefficient investment(Wang Kun and Xiao Xing (2005), Xiongyuan(2009), Bo Xianhui and Wu Liansheng (2009), Pan Lisheng (2010), Yang Qingxiang (2010) ,Jifang and Liuxing(2011)), the results show, institutional investors can supervise and restrain the over-in-vestment, under-investment. The empirical results show that institutional investors are helpful to inhibit the inefficiency investment behavior. Based on the above research; this paper put forward the following hypotheses 1:
Hypothesis 1: Institutional investors can improve resource allocation efficiency.
Graham et al. (2005) think that should focus on what kind of institutional investors may make the manager to choose long-term projects which have good gain prospects, rather than to meet short-term gains. The foreign scholars made a thorough study on the institutional investors’ heterogeneity. Bushee (1998, 2001) divided institutional investors into three categories according to investment style, the transient institutional investors focus on short-term targets; dedicated institutional investors and indexed institutional investors have incentives to influence corporate governance. Matsumoto (2002) demonstrated that transient institutional shareholders is positive-ly related to managers tend to avoid negative earnings. Liu and Peng (2006) found that company with more transient institutions shareholders has low earnings quality.
In addition, some study also found that the horizon of institutional shareholders can directly or indirectly affect company investment strategy, compared to short-time institutional share-holders; long-time institutional shareholders are more sensitive to the company announced news. Long-time institutional shareholders will continue to participate in the company’s supervision and governance (Hotchkiss & Strickland, 2003, Yan & Zhang 2009, Elyasiani & Jia, 2010). Cella (2012) found that long-term institutional investors can affect the management decision-making, reduce the agency conflict of investment decision-making, reduces investment in
Over-ment Company, increase investOver-ment in Over-investOver-ment Company; but the short-term invest-ment shareholders can not affect the company’s investment decisions.
Yin Chunhong (2006) think institutional shareholders participate in corporate governance influence by fiduciary duties, holding time, the cost of supervision and so on. Tang Songlian and Yuan Chunsheng (2012) empirical research found that high proportion of institutional own-ership and long-term institutional ownown-ership helps to enhance the company performance, as investors’ role. Fan Haifeng (2009) found that social security fund have a negative impact on the listing corporation market value because of political and social pressure; the mutual fund will increase the possibility to supervise listing Corporation as its shareholder , thereby increasing the market value of listing Corporation. Ding Fangfei (2013) divided institutional investors into the pressure-resisting institutional investors and pressure-sensitive institutional investors; insti-tutional investors react on the stock price reflects the future incremental earnings due to the pressure-resisting institutional investors. Li Yingzhao and Xiao Weina (2012) found mutual fund and QFII ownership has Significant positive correlation on the dividend distribution policy in listing Corporation; brokerage and insurance holding is not significantly affected; but the social security fund holdings can produce positive effect on dividend distribution tendency, but no significant relationship with dividend distribution intensity. Based on the above research, we propose the hypothesis 2.
Hypothesis 2: Investment styles institutional investor has different influence on corporate resource allocation efficiency.
2.2 Ultimate Controller, Institutional investor holdings and corporate resource allocation efficiency
The different system environment, the interference level is not the same (Ma Lianfu, Cao Chunfang 2010). The ultimate controller is divided into two levels according to difference of the system environment, that is two levels: state-owned and non-state-owned holding; owned holding is divided into the central government control of the state-owned enterprises, local gov-ernment control of the state-owned enterprises. The difference of the system environment has an important influence on the listing Corporation act, would further influence of institutional investors on corporate governance.
Ji fang and Liu Xing (2011) studies show that institutional investors can play active share-holders, institutional investors’ ownership have significantly negative correlation with overin-vestment or underinoverin-vestment; But the effect of this oversight is restricted in the state-controlled listed companies. Wang Yan, Yu Xuehua (2010) research on the relationship between the ulti-mate control rights, debt financing and corporate investment behavior, found that although debt financing can inhibit the over-investment behavior both the state-owned listing Corporation and Private Corporation, but compared to the state-owned listing Corporation, the role of debt financing to reduce conflict and improve governance role is better Private Corporation. Du Xiaohan (2012) studies, corporate bond issuance influence over-investment in different nature property right. The results show that: corporate bonds can play more effectively on over-invest-ment in private listing Corporation.
de-gree, enterprises with private property pursues enterprise value maximization, having more domination than state-owned enterprises. State-owned enterprises have multiple goals, heavy policy-type burden and long control chain, all of these will cause the monitor inefficiency and the influence from the external stakeholder will be weakened. Through the above analysis, this paper put forward the hypothesis 3:
Hypothesis 3: Compared with private listing Corporation, institutional investors can play more significantly role on Corporation resource allocation efficiency in stated owned en-terprises.
In accordance to administrative level, this paper further divided into state-owned enterpris-es into the central government control enterprisenterpris-es and local government control enterprisenterpris-es. Xu Xiaonian (2000), Sun Zheng (2005) thinks that the reason of over-investment in state-owned enterprises is not enterprises irrational, but is the institution. The central government control enterprise mainly engaged industry that is beneficial to the people’s livelihood. Mainly based on the consideration of national political and strategic management; other shareholders can hardly affect their decision. The China Economic Research Center of Peking University (2004) thinks that the reason of Chinese state-owned enterprises over-investment and investment inefficien-cy is the property right and the local government performance oriented. Xia Lijun and Fang Yiqiang (2005) also pointed out that, although the state-owned enterprises through initial open-ing offer. Its structure and regulatory environment has undergone great changes, but they still controlled by the government, the local governments at all levels have motivation and ability to their social or political target internal to the listing Corporation. So we can infer that, institution-al investors in the state-owned enterprises, the “discourse right” can be reduced greatly, which is not good for resource allocation. Thus, we put forward the research hypothesis4:
Hypothesis 4: Compared with the central government Corporation, institutional shareholder in local government Corporation can enhance the resource allocation efficiency more significant.
3 Research Design
3.1 The sample and Dataset
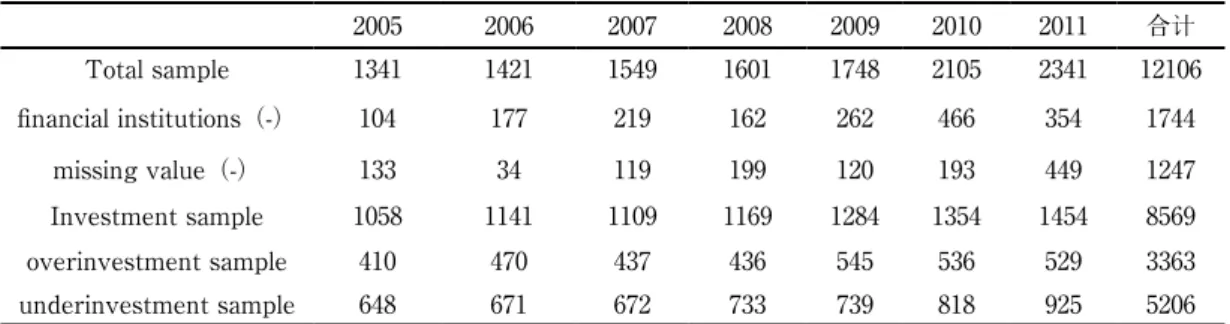
As table 1 show, our data covers Chinese companies that issue A-share stocks on either list-ing in the Shanghai or the Shenzhen Stock Exchange durlist-ing the period 2005-2011. We exclude observations: (1) they are Special Treatment Stock (ST) (2) they are financial institutions (3) contain missing values. Further, we winsorize variables at the 1st and 99th percentile to reduce the influence of extreme observations and possible data errors. Our final samples contain 8569 firm-year observations.
In this paper, the financial data mainly comes from CSMAR Database and Institutional data mainly comes from Wind Database.
Table1. Sample selection 2005 2006 2007 2008 2009 2010 2011 合计 Total sample 1341 1421 1549 1601 1748 2105 2341 12106 financial institutions(-) 104 177 219 162 262 466 354 1744 missing value(-) 133 34 119 199 120 193 449 1247 Investment sample 1058 1141 1109 1169 1284 1354 1454 8569 overinvestment sample 410 470 437 436 545 536 529 3363 underinvestment sample 648 671 672 733 739 818 925 5206
Table 2. Results of the Fund classification
Name Number Concentration Turnover Sensitivity Institutional Investor Characteristic TFUND 2333 -0.341 0.682 0.896 low concentration, high turnover, high earnings sensitivity QFUND 2088 -0.016 0.442 -1.134 Mid- concentration, mid-turnover, low earnings sensitivity DFUND 2851 0.292 -0.882 0.097 high concentration, low turnover, low earnings sensitivity
When classify institutional investors, we exclude Social security funds, Insurance companies, fund management companies, QFII etc., only maintain Securities Investment Fund. We select semi-annual and annual report data to measure Institutional Ownership Variables.
This paper refers to Bushee (1998) method, constructing seven variables that describe the past investment behavior of institutional investors. Then use factor analysis and cluster analysis to assign institutions into groups based on their past investment behavior. Table 2 demonstrates the results of the classification.
3.2 Variable design
As shown in Table 3, we define the variables in this paper:
(1) Institutional shareholders
We make two ways to measure Institutional investors’ shareholding: The first method ,which is the same to prior study ,for example,Wu Liansheng and Bo Xianhui, 2009; Tang Songlian and Hu Yiming, 2011; Yang Haiyan and Wei Dehong, 2012), the proportion institutional shareholding (IVPER) measure institutional investors shareholdings accounted for the total shares of the company.
The second method, first, the institutional investors can classify mutual fund shareholding (FUND) and no-mutual Fund shareholding (IFUND), then the FUND can further divided into transient fund (TFUND), Index Fund (QFUND) and dediacted Fund (DFUND); IFUND as the proportion of institutional shareholding minus fund ownership. Non funds including QFII, social
security funds, pension funds, insurance funds, corporate ownership, finance company owner-ship and bank holding etc.
(2) Corporate resource allocation efficiency
Proxy variables of resource allocation efficiency of the overinvestment and underinvestment (OVERIV) (UNDERIV) (Li Qingyuan and Zhang Tianxi 2009, Xu Xiaodong 2009, your flowers such as 2010), In recent years, scholars generally use the Richardson (2006) of the residual measurement model to measure, if the residual >0 is confirmed as excessive investment; if the residual <0 indicates that the shortage of the investment company.
In order to get more accurate results, we measure investment inefficiency based on both Richardson’s (2006) accounting-based framework and Titman et al. (2004) methodology. We fol-low Richardson (2006), using Eq.(1) to estimate the level of expected investments :
Inewit = a0 + a1Growthit-1 + a2Levit-1 + a3Cashit-1 + a4Ageit-1 + a5Sizeit-1
+ a6Returnit-1 + a7Inewit-1 + Σyear + Σindustry + εit Eq. (1)
represent abnormal investment, the residuals from the expectation model, over-invest-ment firms are those who have positive abnormal investover-invest-ment ( >0); On the contrary, un-der-investment firms are characterized by negative abnormal investment ( <0). Recent years, most scholars profit from this model, but this model itself has some problems: under the influ-ence of explanatory variables, the measure of the expected new investment will be inaccurate, further will have the error to the measure of inefficiency investment.
Titman et al. (2004) compare a firm’s current investment with its average investment in the previous three years. Specifically, a firm’s capital investment (CIt) in year t is measured as follows Eq.(2):
CIt = Investmentt-1 −1
Eq. (2) (Investmentt-1 + Investmentt-2 + Investmentt-3) /3
By this definition, a CI value equal to 0 indicates that the current year’s capital investment is the same as the prior three years average. Thus such a proxy can be viewed as a measure of abnormal investment with respect to the firm’s past trend in investment. Hence, a firm that over-invests has positive abnormal capital investment (CI>0) and a firm that under-invests has negative abnormal capital investment (CI<0).
This paper make sure a firm over-investment if >0 and CI>0; a firm under-investment if <0 and CI<0.
(3) The nature of ultimate controller
Using Sun Pei and Liu Naiquan, Shaojia reference Liu (2003) method, According to CSMAR the listing Corporation “shareholder notice” confirmation, chain map compiled in 2004. If the ultimate controller belongs to the government, the Gov value is 1, if the ultimate controller belongs to the private, the Gov value is 0; If the listing Corporation ultimate controller belongs to the central government, the Centralgov value is 1, if the ultimate controlling the local
govern-ment (Localgov), the Centralgov value is 0.
(4) Control variables
Literature (Xin Qingquan 2007, Yang Qingxiang 2010 and Aggarwal & Samwick 2006) show that the growth rate of income, free cash flow, leverage, the proportion of top three sharehold-ers, the ratio of first shareholders to the second shareholdsharehold-ers, company age and auditor opinion affect the resource allocation efficiency.
The operating income growth rate (GROWTH); the Tobin Q value may not represent Chi-na’s listing Corporation growth opportunities, so we use the operating income growth rate as a proxy for growth opportunities. Generally speaking, the higher growth of operating income growth, the more possibility of over-investment.
The enterprise free cash flow (FCF); the corporate invest in condition of its necessity free cash flow. It means that over-investment behavior occur in sufficient free cash flow frequency.
The leverage (Lev); it reflect the enterprise the ability to against financial risk. Generally speaking, the higher leverage the less possibility of over-investment.
The percent of top three shareholders (Top-three); the index is higher, the agency conflict is more possible, it may cause the inefficient investment behavior.
The proportion ratio of the first shareholders holding to the second shareholders holding (RATIO); when the company equity balance degree is better, is expected to inhibit the invest-ment inefficiency, so the expected negative sign.
Auditor opinion (Audit); it means information transparency and reliability, when the com-pany investment is reasonable; it is easy to accept a standard audit opinion, so the expected negative sign.
The time from IPO (Age), the longer time of listing, the more prone to inefficient investment behavior, so the expected positive sign.
3.3 Models design
Using Eq. (3) to verify the research hypothesis 1:
OVERIVt (UNDERIVt) = b0 + b1 IVPERt-1 + b2Growtht-1 + b3FCFt-1 + b4Levt-1
+ b5Top3t-1 + b6Shr1/2t-1 + b7Auditt-1 + b8Aget-1 + Σyear + ε Eq.(3) In order to study on the correlation between institutional ownership and the resource allo-cation efficiency, in Eq(3), the dependent variable is OVERIV and UNDERIV, the independent variable is the institutional ownership. Considering the endogenous problem, so the explanatory variables are lagged data in the model.
Using Eq. (4) to verify the research hypothesis 2:
OVERIVt (UNDERIVt) = b0 + b1 TypeIVt-1 + b2Growtht-1 + b3FCFt-1 + b4Levt-1
Table 3. Variables and Definition
variable Definition and calculation expected sign
DV
OVER-IV According to Richardson(2006) ,If overinvestment; >0 & CI>0 means UNDER-IV According to Richardson(2006) , If underinvestment; <0 & CI<0, means
IV
IVPER Percentage ownership by Institutional Investors
-FUND Percentage ownership by fund
-FUND
TFUND Percentage ownership by TFUND QFUND Percentage ownership by QFUND
DFUND Percentage ownership by DFUND
-IFUND Percentage ownership by Institutional Investors minus Percentage ownership by fund
CV
Gov 1 if the ultimate shareholder is state-owned ;0 if not; Centralgov 1 if the ultimate shareholder is central-government, 0 if not;
growth growth rate of operating income
+/-FCF free cash flow divided by total assets
+/-Lev the ratio of its short-term and long-term debts to total assets -Top-three the percentage of top three shareholders holding ? ratio The proportion ratio of the first shareholders holding to the second shareholders holding -Audit Auditor opinion, 1 if received standard audit opinion and 0 otherwise.
-Age The time from IPO to now +
Year From 2005 to 2011,we set 6 dummy variables
In Eq. (4),TypeIV can refer to FUND, TFUND, QFUND, DFUND and IFUND, then, can re-gress with OVERIV and UNDERIV respectively.
In order to verify hypothesis 3: according to the characteristic of ultimate controller, the sample can divide into the state-owned enterprises and private enterprises.packet inspection of equations (3) and the equation (4), effect of governance of institutional investors on different institutional environment.
In order to verify hypothesis 4: the state control of the central government control enter-prises and local government control enterenter-prises two sub-samples, packet inspection of equations (3) and the equation (4), effect of different governance role of state control of the institutional investors.
4. Empirical Results
4.1 Descriptive Statistics
sam-ple is less than under-investment (3288 less than 5092). In the over-investment samsam-ple, the mean of institutional investors is 3.65 percent, the maximum is 69.5 percent. In the under-investment sample, the mean of institutional investors is 2.26 percent, the maximum is 39.98 percent. This suggests that over-investment problem is more common and serious in China.
Moreover, the average percentage of institutional investors is 28.66%, it shows that about a quarter stocks of listed companies are hold by institutional investors. The mean of FUND share-holding is 13.30%, accounting for almost half of institutional shareholders. In contrast to Fan Haifeng, Hu Yuming,Shi shuiping(2009) study: the mean of institutional investors shareholding was 13.8%, the mean of fund shareholding proportion is 11.9%. It can see that in recent year institutional investors has been rapid development in China.
The average percentage of dedicated fund, indexed fund and Transient fund are respective-ly 10.39%, 0.77% and 4.51%. It is to say that DFUND has become the main body of the fund, it may become active shareholders in the corporate governance.
The sample of ultimate controlling is State-owned enterprise is 5409, the sample of ultimate controlling is private control enterprise is 2955. Compared to Liu Shaojia, Sun Pei and Liu Nai-quan (2003) found that 84% of the listed Corporation is controlled by the government directly or indirectly. it shows us most of listed Corporation of ultimate controlling is the government, but the proportion is declining year by year.
Mean and median of Size, Cash and Lev have little difference; they are almost in line with the normal distribution. In contrast, Growth and FCF are very different among the companies. The mean top-three reaches 38.16%, illustrates the ownership concentration of listed companies in China is high.
Table 4. Descriptive Statistics
NAME N mean med sd min max
OVERIV 3288 3.65 9.09 0.01 1.16 69.50 UNDERIV 5092 2.26 5.31 0.02 0.95 39.98 IVPER 8380 28.66 24.09 0.01 23.45 100 FUND 5548 13.30 16.56 0.01 6.15 100 TFUND 4069 4.51 5.23 0.01 2.60 42.61 QFUND 1683 0.77 1.06 0.01 0.36 9.24 DFUND 5211 10.39 13.32 0.01 4.71 75.94 IFUND 5548 17.42 19.67 0.00 9.35 100 Gov 5409 0.33 0.47 0 0 1 Centralgov 8380 0.65 0.48 0 1 1 growth 8380 0.18 0.33 -0.98 0.15 1.98 FCF 8380 0.05 0.21 -5.61 0.07 2.14 Lev 8380 0.49 0.19 0.01 0.51 1.00 Top-three 8380 13.26 16.91 0.11 6.10 97.60 RATIO 8380 8.07 30.24 1.00 1.70 694.14 Audit 8380 0.96 0.20 0 1 1 Age 8380 9.29 4.27 1.00 9.00 21.00
4.2 T-test
T-test has been used to test Institutional investors holding and corporate capital allocation efficiency in different situation. First, we divide the samples into two groups by whether the listed companies hold by institutional investors. Then, we divide the samples into two groups by the mean of institutional ownership. It is clear from the Panel A in Table 5 that the over-in-vestment level is relatively significant low when firms hold by institutional investors. From Panel B in Table 5, we can see that the higher of IVPER, the company over-investment and under-investment levels were significantly lower. The same to the FUND shareholders, with the shareholders of fund is higher; the over-investment and under-investment levels were signifi-cantly lower. But the trend is different among funds: with the shareholders of DFUND is higher, the level of over-investment and under-investment levels were significantly lower; TFUND and QFUND shareholding level were not significantly different in over-investment or under-invest-ment. IFUND is the same.
These T-test results illustrate whether institutional investors holdings or not and the level ownership of institutional investors could have an impact on resource allocation efficiency. And there are differences between different institutional investors, Hypotheses 1 and 2 have been initially verified, which also laid the foundation for further regression analysis.
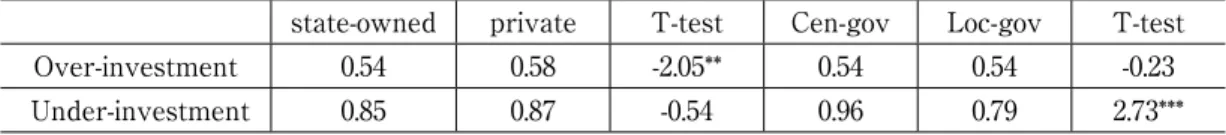
The Table 6 lists the average of over-investment (under-investment) in different ultimate controller. Compared to private enterprise, over-investment level is obviously lower in the state-owned enterprises. However, under-investment level do not exist significant differences between state-owned enterprises and private enterprises. Over-investment level is no signifi-cant difference between central-government-control firms and local-government-control firms. However, compared with local-government-control firms, average of under-investment level in central-government-control firms is significantly higher.
We can find that excessive investment in State-owned enterprises received more attention and governance; and underinvestment in local-government-control enterprises received more attention and governance.
4.3 Correlations
The lower half of Table 7 is correlation efficient between OVERIV and all major variables; the upper half of Table 7 is correlation efficient between UNDERIV and all major correlation.
Seeing from the lower half of Table 7, UNDERIV has 1% level significantly negatively cor-related with FUND and DFUND; With IVPER and TRAN has 5% level significantly negatively correlated; and has no relevant with other types of institutional investors holding. In the upper half of Table 7, OVERIV has 1% level significantly negatively correlated with IVPER,FUND and DFUND; With IFUND has 5% level significantly negatively correlated; and has no relevant with other types of institutional investors holding.
Correlation test results are according with our hypothesis 1 and hypothesis 2, institutional investors holding improves resource allocation efficiency, moreover, different institutional inves-tors’ shareholding has different impact on resource allocation efficiency.
Table 5. Test of differences between Institutional investor groups Panel A
OVERIV
T-test UNDERIV T-test
hold by IV or not Y N Y N IVPER 3.85 7.87 -4.17*** 2.46 5.25 -4.87*** FUND 3.04 8.08 -5.94*** 2.03 5.08 -6.12*** TFUND 2.41 7.07 -5.79*** 1.54 4.48 -6.24*** QFUND 1.96 5.52 -3.62*** 1.29 3.48 -3.68*** DFUND 3.01 7.64 -5.59*** 1.99 4.82 -5.84*** IFUND 3.04 8.08 -5.94*** 2.03 5.08 -6.12*** Panel B OVERIV
T-test UNDERIV T-test
Prop of IV holding High low High low
IVPER 2.56 5.41 -4.04*** 1.81 3.16 -3.19*** FUND 2.58 3.54 -2.06** 1.32 2.69 -3.74*** TFUND 2.36 2.47 -0.24 1.32 1.72 -1.61 QFUND 2.11 1.82 0.72 1.36 1.21 0.43 DFUND 2.33 3.76 -2.93*** 1.27 2.67 -3.72*** IFUND 2.82 3.33 -1.08 1.90 2.19 -0.77
Table 6. Test of investment efficiency differences among different ultimate controller
state-owned private T-test Cen-gov Loc-gov T-test
Over-investment 0.54 0.58 -2.05** 0.54 0.54 -0.23
Under-investment 0.85 0.87 -0.54 0.96 0.79 2.73***
4.4 regression analysis
4.4.1 Institutional shareholders and Capital Allocation Efficiency
From Table 8, all the regression model F value and AD-R2 view, the model is valid. Panel A Table 8 shows that institutional investors Ownership and OVERIV regression, Panel B for institutional investors holding and UNDERIV return.
From Panel A and Panel B regression (1) in Table 8, we can see that IVPER with OVERIV and UNDERIV at the 1% significantly negatively correlated in control of the company’s char-acteristics, operating conditions, ownership structure, cash flow and so on, Coefficients were respectively -0.068 and -0.038. This shows that institutional ownership is higher, it can inhibit over-investment and mitigation under-investment, optimize resource allocation efficiency. Thus, Hypothesis 1 has been verified.
From regression (2) - (6) in Panel A and Panel B Table 8 , we can see that FUND and DFUND with OVERIV and UNDERIV at the 5% significantly negatively correlated in control of the company’s characteristics, operating conditions, ownership structure, cash flow and so on; And TFUND, QFUND and IFUND with OVERIV or UNDERIV are not significant. It is say that
dif-ferent institutional investors holding the company’s impact on the resource allocation efficiency is different, FUND can improve the resource allocation efficiency DFUND mainly due to the existence, TFUND and QFUND had no effect on resource allocation efficiency, Hypothesis 2 t has been verified.
4.4.2 Ultimate controller, Institutional Investors and recourses Allocation Efficiency
To verify the hypothesis 3, Table 9 gives the regression result of institutional shareholding and resource allocation efficiency in state-owned and non-state-owned enterprises. To verify the hypothesis 4, Table 10 gives the regression result of institutional shareholding and resource allocation efficiency in the central government and local government-owned companies.
Panel A in Table 9 , regression(1) and (4) shows that IVPER has 1% level significant
neg-ative correlation with OVERIV in state-owned enterprises, IVPER has 10% level significant negative correlation with OVERIV in private enterprises; by contrast of the regression (2) and regression (5), FUND has 5% level significant negative correlation with OVERIV in state-owned enterprises, FUND has no significant negative correlation with OVERIV in private enterprises; From the regression (3) and regression (6) ,The contrast can be seen, DFUND has 1% level sig-nificant negative correlation with OVERIV in state-owned enterprises, DFUND has irrelevant correlation with OVERIV in private enterprises;
Panel B in Table 9 , regression(1) and (4) shows that IVPER has 1% level significant
neg-ative correlation with UNDERIV in state-owned enterprises, IVPER has 10% level significant negative correlation with UNDERIV in private enterprises; by contrast of the regression (2) and regression (5), FUND has 5% level significant negative correlation with UNDERIV in state-owned enterprises, FUND has no significant negative correlation with UNDERIV in private enterprises; From the regression (3) and regression (6) ,The contrast can be seen, DFUND has 10% level significant negative correlation with UNDERIV in state-owned enterprises, DFUND has irrelevant correlation with UDERIV in private enterprises;
The result in table 9 shows that IVPER, FUND and DFUNF can play a governance role, control the degree of the over-investment and under-investment in state ownership enterprise. But in private company, IVPER can control the degree of the over-investment and under-invest-ment, both FUND and DFUNF can not impact on recourses allocation efficiency.
Table 10 Panel A regression (1) and regression (4) shows that IVPER has no correlation with
OVERIV in the central government holding company, but it has 1% level significant negative correlation with OVERIV in the local government holding company; contrast the result of Table 10 Panel A regression (2) and regression (5) ,it can be seen that FUND has no correlation with OVERIV in the central government holding company, but it has 10% level significant negative correlation with OVERIV in the local government holding company; contrast the result of Table 10 Panel A regression (3) and regression (6) ,it can be seen that DFUND has no correlation with OVERIV in the central government holding company, but it has 10% level significant negative correlation with OVERIV in the local government holding company;
Table 10 Panel B regression (1) and regression (4) shows that IVPER has 10% level
signif-icant negative with UNDERIV in the central government holding company, but it has 1% level significant negative correlation with UNDERIV in the local government holding company; con-trast the result of Table 10 Panel B regression (2) and regression (5) ,it can be seen that FUND has no correlation with UNDERIV in the central government holding company, but it has 5% level significant negative correlation with UNDERIV in the local government holding company; contrast the result of Table 10 Panel B regression (3) and regression (6) ,it can be seen that DFUND has no correlation with UNDERIV in the central government holding company and the local government holding company;
To sum up. Institutional shareholding, funds and dedicated funds can play a governance role, inhibit over-investment and mitigate over-investment in local government holding company; However, in the central government holding company, Institutional shareholding only is at 10% level significance alleviate underinvestment ,dedicated and fund can not suppress corpo-rate non-efficient investment behavior . Hypothesis H4 is verified: compared with the central government listed companies, institutional investors improve resource allocation efficiency more pronounced in local government controlled companies.
Conclusion the regression result of tables 9 and table 10, can be seen that institutional in-vestors improve on corporate resource allocation t efficiency is mainly manifested in the local government control company, it only a little effect to improve resource allocation efficiency in the central government and the private enterprises.
5. Robustness Tests
5.1 Estimation of Residual Ownership by Different Types of Institutions
The results above point to a negative relation between institutional investors ownership and inefficiency of capital allocation. This finding is consistent with institutional investors can monitor and govern listed company. However, it may be the case that firms with efficient capital allocation attract investment by institution.
Prior research finds that institutional ownership is endogenously determined by firm charac-teristics such as firm size, information environment, investment opportunity sets, and firm age (Gompers and Metrick, 2001). Such endogenous can confound our tests.
To mitigate this concern, we follow prior research (eg.,Gompers and Metrick,2001; Rama-lingegowda and Yu, 2012) and perform our analyses using a measure of residual ownership in the Chinese context. Here, residual ownership is the residual from estimating an expected own-ership model that expresses ownown-ership as a function of economic determinants. Our expected institutional ownership model is as follows:
Eq. (6)
prudence, we control for firm age, dividend yield, stock price volatility, and HS300 membership. Second, while institutions prefer firms that have high liquidity and low transaction costs, we control for firm size, stock price, and share turnover. Finally, institutions prefer to invest in firms based on historical return patterns. So we control for book-to-market ratio, Market value of equity, momentum and Tobin’s Q.
We extract regression residuals for each type of the institutions’ ownership variables (to-tal institutional investors, dedicated fund, transacted fund)as our residual ownership measure. Thus, by construction, the residual ownership measure captures the component of ownership unexplained by the economic determinants included in Eq. (6).
Regression results of estimated coefficient and statistical significance level do not seem to be driving the results, indicating that the conclusion of this article is robust.
5.2 Capital Allocation Efficiency Measure
The measure of overinvestment and underinvestment will have great influence to the result. When we only use the method of Richardson (2006) to measure overinvestment and underin-vestment, the result still supports the original conclusion. Hence, we conclude that the endoge-neity issues do not affect the conclusions.
6. Discussion and Conclusions
Using institutional investor ownership data of Chinese listed firms over the period 2005-2011, we investigate whether institutional investors can optimize corporate resource allocation efficiency. And whether the degree of optimization varies with different ownership property or different behavior style of institution? We find that institution ownership really can promote corporate resource allocation efficiency. While Fund and Dedicated Fund can cut down over-in-vestment and alleviate under-inover-in-vestment, Transient Fund and Quasi-indexer Fund cannot affect corporate resource allocation efficiency. Further, we find that ultimate controlling shareholders of listed companies will affect institutional investor ownership and corporate resource allocation efficiency. And this kind of influence mainly reflect in company which controlled by local gov-ernments.
According to the empirical results, we put forward three suggestions as follows: First, im-prove the ownership structure of listing Corporation; continue to decrease the state-owned shareholding, creating a good environment for institutional investors to participate in corporate governance. Second, enhance the institutional investors’ topic right. Through the capital market development, institutional investors development and listing Corporation governances, constant-ly improve the regulatory role of institutional investors in corporate governance, to adapt to capital market demand.
References
[1] Agnes Cheng,C.S., He Huang,Henry, Li Yinghua, Lobo,Gerald,2010,Institutional monitoring through shareholder litigation, Journal of Financial Economics, 95:356-383
[2] Agrawal, Anup and Knoeber, Charles R., 2012,Corporate Governance and Firm Performance, Oxford handbook in managerial economics, March 15
[3] Andrei Shleifer and Robert W. Vishny,1986,Large Shareholders and Corporate Control, Journal of Political Economy, 94:461-488
[4] Brian J. Bushee,2012,Discussion of Financial reporting opacity and informed trading by international institutional investors, Journal of Accounting and Economics ,54:221-228 [5] Brian J. Bushee ,1998,The Influence of Institutional Investors on Myopic R&D Investment
Behavior,The Accounting Review ,73:305-333
[6] Brian J. Bushee and Gregory S. Miller, 2012,Investor Relations, Firm Visibility, and Investor Following, The Accounting Review, 87: 867-897
[7] BRIAN J. BUSHEE,MICHAELJ. JUNG,GREGORY S. MILLER,2011,Conference Presentations and the Disclosure Milieu, Journal of Accounting Research, 49:1163-1192 [8] Brian J. Bushee;Theodore H. Goodman,2007,Which Institutional Investors Trade Based on
Private Information About Earnings and Returns? Journal of Accounting Research, .45: 289-321
[9] Bushee, Brian J.,2001,Do Institutional Investors Prefer Near-Term Earnings over Long-Run Value? Contemporary Accounting Research, 18:207-207
[10] Bushee,BrianJ.,Noe,Christopher F.,2000,Corporate Disclosure Practices, Institutional Investors, and Stock Return Volatility, Journal of Accounting Research, 38: 171-202
[11] Cella, Cristina, 2012,Institutional Investors and Corporate Investment (2012). Stockholm School of Economics , August 22,
[12] Chowdhury,Shamsud D.,Wang,EricZengxiang ,2009, InstitutionalActivismTypes and CEOCompensation: A Time-SeriesAnalysis of LargeCanadianCorporations. Journal of Management, 35:5-36
[13] Chris Mallin,2012,Institutionalinvestors: the vote as a tool of governance,Journal of Management and Governance,16:177-196
[14] Chung, KeeH.;Zhang, Hao,2011,CorporateGovernance and Institutional Ownership,Journal of Financial and Quantitative Analysis ,46:247-273
[15] Effiezal Aswadi Abdul Wahab,2008, Corporate Governance and Institutional Investors: Evidence from Malaysia, Asian Academy of Management,Journal of Accounting and Finance,4:67-90
[16] Eitan Goldman,Günter Strobl,2013,Largeshareholdertrading and the complexity of corporate investments, Journal of Financial Intermediation, 22:106-122
[17] Elyasiani,Elyas;2010,Distribution of institutional ownership and corporate firm performance, Journal of Banking and Finance, 34: 606-620
[18] Gillan, Stuart L.;Starks, Laura T., 2003,Corporate Governance, Corporate Ownership, and the Role of Institutional Investors: A Global Perspective, Journal of Applied Finance, 13: 4-22
[19] Graham,J.R.,Harvey, C.R, and Rajgopal, S., 2005, The Economic Implications of Corporate Financial Reporting, Journal of Accounting & Economics, 40, 3–73.
[20] Hotchkiss, E.S.,and Strickland, D.,2003,Does shareholder composition matter?Evidence from the market reaction to corporate earnings announcements, Journal of Finance, 58:1469–1498.
Institutionalinvestors’impact on CEO turnover, Journal of Corporate Finance, 18:22-37 [22] Jensen, M.C., 1986, Agency Costs of Free Cash Flow, Corporate Finance, and
Takeovers, The American Economic Review, 76: 323-329.
[23] John R. Graham;Campbell R. Harvey;ShivaRajgopal,2005, The economic implications of corporate financial reporting ,Journal of Accounting and Economics, 40:3-73
[24] JK Kang, J Luo, HS Na, 2012,Are Institutional Investors with Multiple Blockholdings Effective Monitors? August,
[25] Kam C Chan;Feida Zhang;Weining Zhang, 2013,AnalystCoverage and Types of InstitutionalInvestors, Review of Accounting and Finance, 1:1475-7702
[26] Kam C. Chan, Feida Zhang, Weining Zhang, 2013, Analyst coverage and types of institutional investors, Review of Accounting and Finance, 12: 60-80
[27] Liu, Y and Y Peng ,2006,Institutional ownership composition and accruals quality.Working paper, Fordham University.
[28] Mallin, Chris,2008,Institutionalshareholders: their role in the shaping of corporate governance,International Journal of Corporate Governance,1:1754-3037
[29] Michael C. Jensen and William H. Meckling, 1976,Theory of the firm: Managerial behavior, agency costs and ownership structure, Journal of Financial Economics, 3305-360
[30] Najah Attig;SeanCleary;Sadok El Ghoul;Omrane Guedhami,Institutional investment horizon and investment–cashflowsensitivity, Journal of Banking & Finance, 36:1164-1180 [31] Ping-Sheng Koh, 2007,Institutionalinvestortype, earnings management and benchmark
beaters, Journal of Accounting and Public Policy,26:267-299
[32] Reena Aggarwal,2011,Does governance travel around the world? Evidence from institutional investors, Journal of Financial Economic,100:154-181
[33] Santhosh Ramalingegowda,Yong Yu, 2012 ,Institutional ownership and conservatism, Journal of Accounting and Economics, 53:98-114
[34] Scott Richardson, 2006,Over-investment of freecashflow,Review of Accounting Studies ,11: 159-189 ISSN:1380-6653
[35] Shin, Jae Yong, 2011, InstitionalInvestmentHorizons and CEO Compensation, Seoul Journal of Business,17:93-135
[36] Sunil Wahal and John J. McConnell,2000,Do institutional investors exacerbate managerial myopia? Journal of Corporate Finance, 6:307-329
[37] W Haddaji, J Yang,2012,Firm Performance and Changes in Institutional Ownership: A Corporate Governance Perspective - Available at SSRN 2022378, 2012 - papers.ssrn.com [38] William Cheung,ScottFung,Shih-Chuan Tsai, 2009,The Impacts on Managerial and
Insttitutional Ownership on Firm Performance: The Role of Stock Price Informativeness and Corporate Governance, Corporate Ownership and Control, 6:115-127
[39] X Chen, J Harford, K Li,2007,Monitoring: Whichinstitutionsmatter? Journal of Financial Economics, 86:279-305
[40] Xia Chena;JarradHarfordb and Kai Lia,2007,Monitoring: Whichinstitutions matter? Journal of Financial Economics,86:279-305
[41] Yan, X. S. and Z. Zhang, 2009, Institutional Investors and Equity Returns: Are Short-Term Institutions Better Informed, Review of Financial Studies 22:893-924.
Governance ,American Journal of Industrial and Business Management, 3:64-68 [43] 杜晓晗,2012,产权性质,债券融资与过度投资——基于中国A股上市公司的经验证据[J],经济 与管理,26:23-28. [44] 黄晶,陈工孟,包文卿,陈峥嵘,2011, 股权分置改革能抑制控股股东过度投资行为吗?[J],财经研究, 37:26-36. [45] 黎来芳,程雨,张伟华,2012,投资者保护能否抑制企业过度投资?——基于融投资关系的研究[J]. 中国软科学, 25301:144-152. [46] 李善民,王媛媛,王彩萍,2011,机构投资者持股对上市公司盈余管理影响的实证研究[J]. 管理评论, 2307:17-24. [47] 李云鹤,李湛,唐松莲,2011,企业生命周期,公司治理与公司资本配置效率[J].南开管理评论,3: 110-121 [47] 潘立生,张清政, 2010,股权结构,机构投资者与企业过度投资行为研究[J].中国市场,31:101-103. [48] 唐松莲,袁春生,2010 ,监督或攫取:机构投资者治理角色的识别研究——来自中国资本市场的 经验证据[J],管理评论,2208:19-29. [49] 唐松莲,胡奕明,2011,机构投资者关注上市公司的信息透明度吗?——基于不同类型机构投资 者选股能力视角[J],管理评论,2306:31-40+48. [50] 唐松莲,袁春生,2012,机构投资者角色发凡:2004 ~ 2007年部分上市公司样本[J],改革, 21501:131-140. [51] 王彦,俞雪华,2010,终极控制权,负债融资与公司投资行为[J]. 北京市经济管理干部学院学报 25:33-38. [52] 熊远,机构投资者对非效率投资的影响研究[D]. 2009,湖南大学 [53] 辛清泉,林斌, ,2006,债务杠杆与企业投资:双重预算软约束视角[J]. 财经研究, 7:73-83. [54] 杨清香,俞麟,胡向丽,2010, 不同产权性质下股权结构对投资行为的影响——来自中国上市公 司的经验证据[J],中国软科学,23507:142-150. [55] 张纯,吕伟,2007,机构投资者,终极产权与融资约束[J],管理世界,17011:119-126. [56] 张敏,姜付秀,2010,机构投资者,企业产权与薪酬契约[J], 世界经济, 33:43-58. (本稿は中国国家自然科学基金 [ 課題番号:NSFC-71002052] 及び「中央高校基本科研業務費専 項資金」の支援を受けた研究成果の一部である)