How People Rate Their Standard of Living in
Japan--What the Data Tell Us
著者
門間 麻紀
雑誌名
経済論集
巻
30
号
1
ページ
77-91
発行年
2004-10
URL
http://id.nii.ac.jp/1060/00005353/
Creative Commons : 表示 - 非営利 - 改変禁止1.Introduction
It has long been said that Japan is a country where 90% of its people consider themselves to be in the middle class. Recently, however, there have been disputes as to whether this middle
class perception is still prevalent, and some researchers argue that Japan is now moving
to-ward a more hierarchically-oriented society, whereby the“upper, white-collar”class is be-coming increasingly inaccessible to a majority of people. What do the data tell us about this
subject? Do they support the claim of a dwindling middle class perception amongst people in Japan? And what factors, if any, have impacts on people’s perceptions? These are the
ques-tions addressed in this paper.
The first step of the analysis is to define precisely the concept of a class, or as some sociolo-gists prefer, of social strata, so that we are on common ground when discussing, for example,
How People Rate Their Standard of
Living in Japan
― What the Data Tell Us ―
Maki Momma
Abstract
This article investigates how people rate their standard of living in Japan. While there have been disputes as to whether or not Japan is moving toward a hierarchically-oriented society, no empirical evidence of a declining middle class perception is found. Relationships between people’s standard-of-living perceptions and income, age, as well as type of dwelling are also ana-lyzed. The results indicate a possible relation between home or residential land ownership and people’s perceptions. The high cost of housing in Japan, as well as people’s general mistrust of the social welfare system may have contributed to this result.
middle class. But this is, by no means, an easy task. Although there is a consensus that, in general, social strata represent groups of people with similar economic and social
back-grounds, the actual grouping and evaluation of these groups can prove to be a formidable ex-ercise, mainly due to the myriad social aspects. There is little room for argument when
classifying people according to their economic backgrounds, the key factor being income level
and/or the amount of financial assets they possess. When assessing social backgrounds, how-ever, things are not so straightforward. Although many would agree that the most important
factor shaping a social background is a person’s occupation, we cannot discount other factors
such as family background, educational background, gender, residential district, etc. Society is a multi-faceted concept, and to combine its various aspects to form strata and to further
ar-range them in some order, entails, at least to some extent, resorting to one’s own value
sys-tem. In other words, we cannot escape subjectivity when defining a social class.
In order to circumvent this difficulty, this article will focus solely on economic aspects. It is
my understanding that nowadays, people in Japan are far more aware of their economic situa-tion than their social status per se. Furthermore, the data, most often cited as the basis for
why a middle class perception is so prevalent in Japan, are results of how people rate their
standard of living, not of how they rate themselves socially.
This paper is organized as follows: section 2 gives a description of the data; section 3
dis-cusses sampling and non-sampling errors as they pertain to survey data; section 4 describes
empirical findings from time series data; an empirical analysis on the latest survey data is con-tained in section 5, and finally, concluding remarks are given in section 6.
2.Data
The primary source of data is from a continuing survey on people’s lifestyles in Japan, as
conducted by the Cabinet Office since 1958. The survey has been done annually except for the years 1997-2001, when it was done bi-annually, and for the years 1974-1976 when it was
done twice a year. The question of particular interest for this paper is the one where people’s perception of their standard of living is asked. More precisely, survey participants were asked
to rate their standard of living in comparison to the“general public”, and to determine their
living standard with a selection from the following five categories: low, lower-middle, middle, upper-middle, and high. Although the survey did take place for the years 1962 and 1963, the
above question on people’s standard-of-living was not asked and therefore the data on these years are missing. The data are available from the website of the Cabinet Office,
http://www.cao.go.jp.
Secondary sources of data include family income and expenditure survey done by the
Statistics Bureau, the Cabinet Office’s system of national accounts, and the Japan Real Estate
Institute.
3.Sampling and Non-Sampling Errors
Before examining the data in detail, it must first be noted that most survey data, such as
this one, invariably contain errors. Unless the study is a census, every survey contains
possi-ble sampling errors, by which the sample chosen may not be an accurate representation of the entire population. For example, the percentage of people with an annual income over
10,000,000 yen may be higher in the sample than in the entire population, and vice versa. This type of error, however, is not the main concern here, since the magnitude of a sampling error
can be assessed statistically, and consequently, its level can be controlled through the use of
an appropriate sample size. In other words, sampling errors can be suppressed to a desirable level by choosing enough number of people to take part in the survey. The main difficulty,
rather, is in the non-sampling errors.
What, then, is implied by a non-sampling error? In a survey study, not all people, selected as a sample of the population, choose to cooperate in responding to the survey. According to the
Cabinet Office, the latest survey on people’s lifestyles in Japan was conducted with 10,000
peo-ple chosen randomly from the population, out of which data collectors were able to interview only 7,030 persons, approximately a 70% recovery rate. Of the 2,970 persons that did not
par-ticipate in the study, 1,288 refused to take part in the interview on their own accord. Other
reasons for not being included in the study were: temporary and long-term absence, change of address, unknown address, illness, etc.
People who consciously refuse to take part in the study taint what would otherwise be a representative cross-sampling of the general population, and this is problematic. These
non-re-spondents tend to share certain common traits, which may cause the data to be biased.
Typically, it is known that people with high income, as well as low income, have a higher probability of refusing to participate. This suggests that the data will likely be biased towards
the middle rather than being truly representative of all income groups. Unfortunately, there is no way to evaluate the extent of this bias.
To obtain a further understanding of the problem of non-sampling errors, recovery rates of the latest survey conducted in June of 2003, sorted by gender and age, are presented in Table
1. Clearly, there are gender and age differences in recovery rates that cannot be ignored.
Looking at age groups, it is at once noticeable that 80% of men, age 70 or older, participated in the study, whereas only 50% of men in their 20s participated, with a similar but less extreme
tendency to do so among women. In general, recovery rates rise along with age, so that the
viewpoints of older generations may be emphasized to a disproportionate level in the overall results. The recovery rate of women was 74% in all, while only 66.5% of men chosen agreed to
contribute. As a result, the ratio of men in the study was 46%, whereas the ratio of men in the
entire population studied was approximately 49%.
Table 2 shows how women and men rated their standard of living in the latest survey. As
explained before, participants were asked to choose their standard of living from five classes: low, lower-middle, middle, upper-middle, and high. We see from this table that women tend to
avoid placing themselves in extreme classes, both the low and the high. Using a χ2 test, the
hypothesis that gender and perception of living standard are independent is rejected at a 1%
Table2 How People Rate Their Standard of Living
Source: Survey on People's Lifestyle in Japan, Cabinet Office
male female 1.2 0.7 9.7 10.3 52.7 56.1 27.7 23.9 6.7 6.0 2.0 3.0 high upper-middle middle lower-middle low not applicable
(%)
Table1 Recovery Rates of the Latest Survey on People's Lifestyles in Japan
Source: Survey on People's Lifestyle in Japan, Cabinet Office
20-29 30-39 40-49 50-59 60-69 70 or over total 20-29 30-39 40-49 50-59 60-69 70 or over total 654 820 832 1032 870 667 4875 327 477 539 687 663 547 3240 50.0 58.2 64.8 66.6 76.2 82.0 66.5 718 929 870 999 903 706 5125 399 640 681 767 744 559 3790 55.6 68.9 78.3 76.8 82.4 79.2 74.0 male female
sample size # recovered recovery rate(%)
significance level. In other words, there is enough evidence in this data to conclude that men and women differ in the way they rate their standard of living. Since women have a higher
participation rate in the study, this could also cause the data to be biased towards the“mid-dle”.
Finally, the fact that the study was performed using interviews is another possible source of
bias. Many would feel uneasy to admit, in front of a total stranger, that they belong to the low-est class(with regards to standard of living)even if they personally assess their standard of
living to be“low”. Conversely, modesty is still an unspoken virtue in Japan, and many people
are reluctant to admit that they belong to the highest class, albeit their own perception. The facts presented so far all point to the possibility of the data being biased towards the
“middle”, with an exception of the age effect, a point which will be discussed later. All things
considered, we need to proceed with caution when studying survey data, to interpret them with“a grain of salt”.
4.Findings on Time Series Data
4.1 Perceptions over the Last 40 Years
Figure 1 displays a time series graph of how people rated their standard of living during the
period of 1958 to 2003. It is a reproduction of Figure 24 in the survey report by the Cabinet
1958 1960 1962 1964 1966 1968 1970 1972 1974 1975 1976 1977 1979 1981 1983 1985 1987 1989 1991 1993 1995 1997 2001 2003 year % 60 50 40 30 20 10 0 low lower-middle middle upper-middle high
Figure1 People's Perception on Their Standard of Living
Office(http://www8.cao.go.jp/survey/h15/h15-life/images/zu24.gif). As has been pointed out already, the gap in the graph shows that data were not available for the years 1962 and 1963.
During the period of high economic growth, i.e. the period preceding the oil crisis of 1974, the most notable feature is that percentages of middle class and upper-middle class perception
increase steadily while percentages of lower-middle class and low class perception decrease
rapidly. It is safe to say that people’s perceptions of their living standard improved steadily with economic expansion. Once the economy had reached a stable level of growth, that is,
from 1975 onward, there is less fluctuation in the range of how people perceive their standard
of living. The previous claim that 90% of Japanese perceive themselves to be a part of the middle class pertains to this period, although the figure clearly indicates that the percentage
of people considering themselves to be literally in the middle class actually lies somewhere
be-tween 50% and 60%. Furthermore, the percentage of those respondents with a lower-middle class perception is much higher than the percentage of those respondents with an
upper-mid-dle class perception, and the same is true for low and high standard of living perceptions. In short, up until the present, the percentage of people rating their standard of living as lower
than middle far outweighs that of people rating their living standard to be higher than middle.
What, then, is the rationale behind the claim of a 90% middle class perception? To answer this, I have added the percentages of the middle three classes(lower-middle, middle and
up-per-middle)to create an indicator representing middle class in a wider-sense. In addition, the
percentage of people rating their standard of living to be in middle class or higher(middle, upper-middle and high)was also calculated. The middle-or-higher class represents people
who find their standard of living satisfactory, or at least acceptable in relation to their social
standing. Whether they are satisfied with the absolute level of their living standard itself is another question. The purpose of creating such a statistic is to obtain a simple indicator based
on which we can evaluate whether or not people’s overall perceptions of their standard of
liv-ing are improvliv-ing over time. Both variables are plotted against year in Figure 2.
We see from Figure 2 that a wider-sense of middle class perception reaches the 90% level in
the mid 70’s, after which there is surprisingly little digression from that level regardless of the fact that Japan’s economy has experienced some ups and downs. Furthermore, there is no
in-dication of this percentage falling in recent years, so there is no evidence to support the
argu-ment of a dwindling middle class perception amongst the Japanese from this data. We must not forget, however, that among those that perceive themselves to be in a wider-sense middle
class, the percentage of people rating themselves to be in lower-middle class is about 3 times higher than those rating themselves to be in upper-middle class, so the claim of a 90% middle
class perception is a little overrated.
Meanwhile, there is substantial movement in people’s perception of a middle-or-higher class. The plot shows a considerable drop of percentage in the 80’s, especially in the late 80’s when
Japan was experiencing an economic boom called the“bubble economy”. The percentage
thereafter increases following the bursting of Japan’s economic bubble in the early 90’s and continues to rise until the end of 90’s, during a period in which the economy was in fact in
re-cession. Recently, the percentage is falling slowly. In all, since the late 70’s, the fluctuations in
the percentage of people that are content with their relative living standard(people in mid-dle-or-higher class)do not seem to be in accordance with, or relative to, the economic
condi-tion of the country.
4.2 Perceptions and Economic Conditions
To verify whether or not people’s perception reflects current economic conditions, the val-ues of correlation coefficients between the percentage of middle-or-higher perception and
some leading economic indicators were derived.
In general, the correlation coefficient is a statistic that measures the strength of linear asso-ciation between two variables. The correlation coefficient takes a value between − 1 and 1,
Figure2 Wider-Sense Middle and Middle-or-Higher percentages
100 90 80 70 60 50 40 % 1958 1960 1962 1964 1966 1968 1970 1972 1974 1975 1976 1977 1979 1981 1983 1985 1987 1989 1991 1993 1995 1997 2001 2003 year middle-or-higher wider-sense middle
whereby a negative value indicates that as one variable increases, the other has a tendency to decrease, and a positive value indicates that as one variable increases, the other has a
tenden-cy to increase as well. The larger the absolute value of the correlation coefficient is, the closer the two variables are to being linearly related.
Table 3 presents values of correlation coefficients between the middle-or-higher perception
percentage and various economic indicators during the period 1975 to present. On the microe-conomic side, disposable income and net increase in current assets of workers’households
were selected. As a measure of macroeconomic conditions, unemployment rate, real GDP and
its growth rate, urban land price index of major 6 cities(residential)and its growth rate were chosen. Data on economic indicators were taken from the following sources:
1)Real GDP: system of national accounts, the Cabinet Office
2)Disposable income, increase in current assets, unemployment rate: family income and ex-penditure survey, the Statistics Bureau
3)Urban land price index of 6 major cities (residential): Japan Real Estate Institute We see from Table 3 that, apart from the urban land price index and its growth rate, none
of the economic variables, not even disposable income, are significantly correlated with
mid-dle-or-higher perception. The urban land price index and midmid-dle-or-higher perception, as well as the growth rate in urban land price index and middle-or-higher perception are negatively
correlated, although the correlation is moderate. This indicates that as price of land goes up,
or equivalently, as housing becomes less affordable, people’s standard-of-living perception goes down. A possible explanation is that the high cost of housing in Japan, especially in urban
ar-eas, is a dominant factor in the people’s assessment of their living standard.
Table 3 Correlation coefficients of middle-or-higher percentage and economic indicators
disposable income(worker's household)
net increase of current assets(worker's household) unemployment rate
real GDP
growth rate of real GDP
urban land price index(6major cities: residential) growth rate of urban land price index
−0.179 0.037 0.065 −0.133 −0.276 −0.373 −0.610
5.Findings on Cross-Sectional Data
In this Section, data from the most recent survey conducted in June of 2003 are analyzed. In particular, relationships between people’s standard-of-living perceptions and annual income,
age, and the type of dwelling were reviewed.
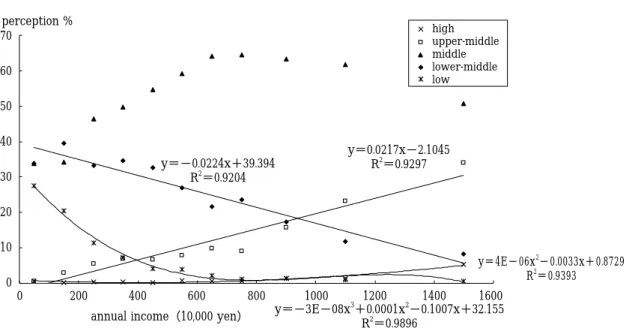
5.1 Perceptions and income
Figure 3 shows a scatterplot of people’s standard-of-living perceptions versus the annual in-come of the household. A regression line is added for illustrative purposes, except for middle class perceptions. It can be seen that lower-middle and upper-middle perceptions decrease and
increase in an approximate linear fashion with income, while other classes have a non-linear
association with income. Some of its features are as follows:
1. Middle class perceptions reach their peak at the annual income level of 7,000,000 yen to
8,000,000 yen. A family income and expenditure survey by the Statistics Bureau, conduct-ed during the same month, states that the mean income of a household is 6,540,000 yen,
and the median income, which is the value at 50%, is even lower, between 5,500,000 yen
and 6,000,000 yen. This indicates that people are being rather conservative in the assess-ment of their living standard.
Figure3 Perceptions versus Income Level
perception % 70 60 50 40 30 20 10 0 0 200 400 600 800 1000 1200 1400 1600 annual income(10,000 yen) y=−3E−08x
3 +0.0001x2−0.1007x+32.155 R2=0.9896 y=4E−06x2−0.0033x+0.8729 R2=0.9393 y=−0.0224x+39.394 R2=0.9204 y=0.0217x−2.1045 R2=0.9297 high upper-middle middle lower-middle low
2. Even at the highest annual income level of 12,000,000 yen per year or higher, 50% percent of the people still perceive their standard of living to be middle class.
3. A rough regression analysis between perception and income level shows that with an in-crease of 1,000,000 yen in annual income, there is an approximately 2% dein-crease in
lower-middle perceptions, and a 2% increase in upper-lower-middle perceptions.
4. A decrease in low-class perceptions is very steep at the lowest three income levels, with annual income under 1,000,000 yen, income between 1,000,000 yen and 2,000,000 yen, and
income between 2,000,000 yen and 3,000,000 yen. Thereafter, the rate of decrease drops
considerably. Note that 46.5% of the people with annual income between 2,000,000 and 3,000,000 yen consider their standard of living to be middle class, although according to
the family income and expenditure survey, only about 10% of all households make less
than 3,000,000 yen per year.
5. An increase in high-class perceptions is very moderate, even in the higher income classes.
In fact, only 5.4% of the people with the highest annual income claimed that their stan-dard of living was high.
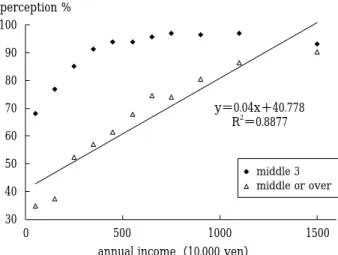
Figure 4 shows percentages of wider-sense middle class perceptions(middle 3 classes)
and of middle-or-higher perceptions(upper 3 classes)plotted against annual income levels. Even at the lowest annual income level of 1,000,000 yen per year or lower, 68% of the people
consider themselves to be in a wider-sense middle class. Furthermore, over 50% of the people
Figure4 Perceptions versus Income Level
perception % middle 3 middle or over 100 90 80 70 60 50 40 30 0 500 1000 1500 annual income(10,000 yen)
y=0.04x+40.778 R2
with annual income between 2,000,000 yen and 3,000,000 yen consider their standard of living to be middle-or-higher, although they belong to the third lowest income level. A rough
regres-sion between perception and income indicates that as annual income increases by 1,000,000 yen, middle-or-higher perceptions increase by approximately 4%. It can also be inferred from
Figure 4 that the structure of people’s perceptions in the lowest two income levels as well as
the highest income level may be different from the rest.
To summarize the empirical findings of Figures 3 and 4, people with higher incomes tend to
assess their standard of living conservatively, while a majority of people with lower incomes
still consider themselves to be middle class. Whether this is a result of a group mentality or a reflection of the relative homogeneity of the social condition in Japan is a subject for further
study.
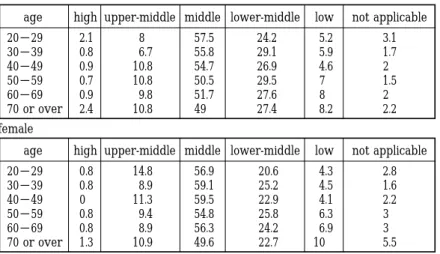
5.2 Perceptions and age
Table 4 presents people’s standard-of-living perceptions sorted by age. It shows that stan-dard-of-living perceptions of people 70 years or older are more dispersed than the other age
groups in the data, regardless of gender. A plausible explanation is that financial assets, which
are essentially an accumulation of incomes over the past years, show more disparity in this age group than income accumulation in younger age groups. At the same time, it is somewhat
puzzling that, among people in their 20’s, the percentages of high and upper-middle
percep-Table4 Perceptions versus Age
20−29 30−39 40−49 50−59 60−69 70 or over 2.1 0.8 0.9 0.7 0.9 2.4 8 6.7 10.8 10.8 9.8 10.8 57.5 55.8 54.7 50.5 51.7 49 24.2 29.1 26.9 29.5 27.6 27.4 5.2 5.9 4.6 7 8 8.2 3.1 1.7 2 1.5 2 2.2 high
age upper-middle middle lower-middle low not applicable
Source: Survey on People's Lifestyle in Japan, Cabinet Office (%)
male 20−29 30−39 40−49 50−59 60−69 70 or over 0.8 0.8 0 0.8 0.8 1.3 14.8 8.9 11.3 9.4 8.9 10.9 56.9 59.1 59.5 54.8 56.3 49.6 20.6 25.2 22.9 25.8 24.2 22.7 4.3 4.5 4.1 6.3 6.9 10 2.8 1.6 2.2 3 3 5.5 high
age upper-middle middle lower-middle low not applicable female
tions surpass those of people in their 30’s for both sexes. The existence of the so-called“para-site singles”, i.e. young adults living with their parents and enjoying their parents’economic
power, may have contributed to this phenomenon.
Japan is now the most rapidly aging society in the world, with the ratio of people 65 years
or older accelerating at an unprecedented speed. Coupled with high participation rates of
old-er age groups in the survey, it is conceivable that, in the near future, the survey data on people’s standard-of-living perceptions will show an even higher dispersion and a decrease in
middle class perceptions, even without major changes in the current social structure.
5.3 Perceptions and Type of Dwelling
I will now analyze the relation between the dwelling-type and people’s standard-of-living
perceptions. The data used are people’s perceptions as sorted according to the following six types of dwellings: home owner without mortgage, home owner with mortgage, condominium
owner, renter of private housing, renter of public housing, and renter of employer provided housing. Using this data, a coefficient of specialization was calculated for each combination of
dwelling-type and standard-of-living perception, and results are displayed in the Figure 5
spi-der-web graph.
For this case, the coefficient of specialization is the ratio of the standard-of-living perception
for each dwelling type to the overall standard-of-living perception. For example, 11.2% of the
homeowners without mortgage rated themselves as upper-middle class, whereas the percent-age of upper-middle class respondents in the whole sample was 10%. The coefficient of
special-middle
upper-middle
lower-middle low
high
home owner with mortgage home owner without mortgage condominium owner renter : private housing renter : public housing renter : employer provided housing Figure5 Perceptions versus Type of Dwelling
2.5 2.0 1.5 1.0 0.5 0.0
ization is therefore 11.2/10=1.12. When the value of the coefficient of specialization exceeds 1, the related dwelling-type(in this case, home owner without mortgage)is said to specialize in
that category(upper-middle perception). One possible source of complication is the existence of people who refuse to rate their standard-of-living(not applicable). Because the percentage
of refusal differs by dwelling-type, leaving it as is could very well cause a possible bias in the
results. To cope with this situation, the values were adjusted to indicate percentages only within the group of people who rated their standard of living.
It is clear from Figure 5 that homeowners specialize in high and upper-middle category,
whereas renters specialize in low and lower-middle category. In other words, homeowners tend to rate their standard-of-living higher than renters, with very little difference whether
they are repaying a home loan or not. This finding is in accordance with the result of Section
4.2, where it was seen that price of land for residential use was correlated with people’s per-ceptions of their living standard. The reason, as stated before, can be attributed to the high
cost of housing in Japan. It can also be a result of people’s general mistrust of the social wel-fare system, or a combination of both. For example, after retirement, renters whose only
in-come is a pension continue to be faced with the burdens of a high monthly rental payment
and the possibility of being evicted for a number of reasons. This prospect alone could cause the renters concern and eventually lead him or her to lower their self-evaluation of their
cur-rent living standard, unless they have confidence in either the pension or the general welfare
system.
Renters of employer-provided housing paint a somewhat peculiar picture. Although none of
them perceived themselves to be in the highest class, the percentage of upper-middle
percep-tions in this category is much higher than for any of the other dwelling types. This phe-nomenon is not difficult to explain. Employer-provided housing is a form of benefit given by
major corporations that can afford them. Employees of such companies are usually well paid
and confident about their living standard, the only drawback being that they are not home-owners.
Although there seems to be a strong relation between dwelling-type and standard-of-living perceptions as seen above, this might just be a consequence of the effect of income on both
factors. People with higher income have higher standard-of-living perception, and are more
ca-pable of purchasing homes. In fact, results from the family income and expenditure survey re-veals that dwelling-type and income are related. For the year 2003, mean disposable income
for homeowners was 485,436 yen per month, whereas renters of private sector housing had a monthly disposable income of 373,955 yen, renters of public sector housing 318,940 yen, and
those with employer-provided housing had a monthly disposable income of 486,123 yen. It should be noted that homeowners with a mortgage had the highest mean disposable income
of 536,293 yen.
In order to separate the impact of income from the impact of dwelling-type, and to evaluate their effects on people’s standard-of-living perceptions independently, more detailed data for
analysis are necessary. Namely, data on each individual’s income, dwelling-type, and
standard-of-living perception would be essential for such a study. Unfortunately, for this survey, only aggregated data are available and, for the purposes of privacy protection, the general public
cannot access individual data. Thus, for now, the finding that dwelling-type affects people’s
perceptions of their living standard is, I must admit, at best inconclusive.
6.Concluding Remarks
This article reviewed features of people’s perceptions of their standard-of-living in Japan. No
empirical evidence supporting the hypothesis of decreasing middle class perceptions was found. At the same time, both a possible bias in the data towards the“middle”and the fact
that far more people consider themselves as lower-middle than upper-middle are reasons to
believe that the claim that 90% of Japanese people hold a middle class perception is rather overrated. We have also seen that since Japan has entered the period of stable economic
growth, people’s standard-of-living perceptions do not necessarily move in accordance with the
economic condition of the country. Alarmingly, people’s perceptions do not seem to be improv-ing in recent years. With the arrival of a rapidly agimprov-ing society, the percentage of middle class
perceptions may decline in the near future, not necessarily due to a change in social structure
but rather due to a dramatic change in population demographics.
Both time series data and cross-sectional data indicate a possible relation between home or
residential land ownership and people’s perceptions of their living standard. The high cost of housing in Japan, as well as people’s general mistrust of the social welfare system may have
contributed to this result, although further investigation is necessary to verify this conjecture.
Much work remains to be done to fully understand how people’s standard-of-living percep-tions are formulated. A multivariate analysis of individual data, provided they are obtainable,
could prove fruitful in both identifying the factors essential to just how people formulate their standard-of-living perceptions and explicating the relationship between each factor and
people’s perceptions of their living standard. For simplicity, I have, in this article, excluded so-cial aspects from the discussion. There is no doubt, however, that factors such as occupation,
education, family background etc. also contribute in forming people’s perceptions of their
liv-ing standards. To investigate the social aspects as well as to analyze the impact of a rapidly aging society are subjects worthy of future research.
This paper, in amended form, was presented on my behalf in Strausbourg, France, at the workshop on“L’évolution du rapport salarial en France et au Japon”by professor Shinya
Morita, on March 25, 2004.
e-references
Cabinet Office: http://www.cao.go.jp/index-e.html
Statistics Bureau: http://www.stat.go.jp/english/index.htm