トップページ - 横浜国立大学学術情報リポジトリ
20
0
0
全文
(2) 76. (546). Yokohama Journal of Social Sciences, Vol. 18, No. 6. to a final good which is consumed and can be referred to as “consumption good”1). For e.g. the production of a car require tires which requires steel and rubber; steel requires iron which requires iron ore and so and on, similarly rubber requires other inputs. In this example, Car is the final product and rubber; steel; iron ore are all intermediate inputs used in its production. Intermediate inputs consist of both material goods and services. The latter can also be used as input to any sector of the economy; that is for the production of the same, or other services, as well as manufacturing goods. According to an OECD report, Intermediate inputs represent 56% of total goods trade and 73% of total services trade. Trade flows are dominated not by goods that are fully consumed but by goods that are further used in the production of other goods and services. . (OECD, 2009) The trade of intermediate inputs has grown at an average annual rate of 6.2% for goods and 7% for services (in volume terms) between 1995 and 2006 (Miroudot, S., R. Lanz and A. Ragoussis, 2009). Hence intermediate goods have become an important component of world trade. Value chain can be defined as the different stages in the production of a good which add value to the final product. Each of this stage can be called a part of the value chain. The term popularized by Michael Porter (Porter, 1985). In recent decades there has been an increase in shifting some stages of the value chain to locations abroad. This phenomenon has been addressed in various ways. ʻslicing up the value-added chain’ (Krugman 1991); ʻoffshoring’; ʻoutsourcing’; ʻfragmentation’ (Jones and Kierkowski 1990 and 2001, Deardorff 2001); ʻvertical specialization’ (Balassa 1967 and Hummels et al. 1998, 2001, Gonzalez 2012) and ʻunbundling’ (Baldwin 2006, 2012). To refer to the geographical shifting out of stages in the value chain, two words are very commonly used in the literature on this field: Global Value Chain and Regional Value Chain. Baldwin and Gonzalez (2013) argue that the supply chains of production networks are more ʻregional’ than ʻglobal’. Figure 1 shows the global matrix of imported inputs to produce. The rows show the sales to a column country and the columns show the purchases form a row country. It can be seen clearly from the figure that the sales of input across countries is a regional activity. For e.g. Germany sells the most within Europe and China sells the most within Asia. It can be seen that very few bilateral flows are significant on a global scale. Baldwin therefore argues against the idea of ʻglobal supply chain’ and supports the idea of ʻregional production networks’ as shown by the three rectangles in Figure 1. The global production network is marked by regional blocks, what can be called Factory Asia, Factory North America, and Factory Europe. The purpose of this paper is to shed light on the position of India in the production networks of intermediate goods based on three observations: First, in the BEC (Broad Economic Categories) classifications of goods (Final, Intermediate and Primary goods), India trades the most with the rest of the world in intermediate goods. Second, China has significantly increased its position in the world trade of intermediate goods between 2001 and 2011 and has become the prime export base for assembly of manufactured goods that contain imported components. Third, the global production network is more regional than global (Baldwin 2013). Based on these three observations, what can be said about India’s role in the production network of intermediate goods? What kind of intermediate good trade relation does it have with China? Is Baldwin’s Factory Asia argument valid in the case of India? To examine these questions this paper will use trade data and input-output analysis as the empirical tool of examination. To get a broader picture we begin by looking at India’s trade with few other countries (EU, US, ASEAN, and Japan) and then eventually narrow down to China. For the purpose of this paper we limit ourselves to the study of intermediate goods and leave the study of India’s integration into intermediate trade of services for future research even though services industry has become the most important industry in India in the past decade2). An analysis of trade in. . 1) This is a definition provided by Deardorff (2006) in his Glossary of International Economics. 2) Services trade is very important for India and India’s rapid growth rates have been attributed to its rapidly growing services sector. Much of this growth in exports is driven by growth in service exports. Within services, it is mainly modern services (referred.
(3) India’s Intermediate Goods Trade in the Inter-regional Value Chain(Simi Thambi) (547). 77. Baldwin and Gonzalez (2013), Figure 13, Page 19. Bilateral purchases of intermediates by row nation from column nation as. % of alland flowsGonzalez in WIOD data base;Figure flows under 0.3% set zero. Baldwin (2013), 13, Page 19.toBilateral purchases of intermediates by row. nation from column nation as % of all flows in WIOD data base; flows under 0.3% set to zero. Figure 1 Global Matrix of Imported Inputs to Produce. . to as “miscellaneous services” in data published by the Reserve Bank of India) that have been driving this export performance. Further decomposing miscellaneous services into software, communications, business and financial services reveals that exports are dominated by software services. Export destination of service exports is highly concentrated with U. S as the top destination (65% of total software and service exports). For more details refer Eichengreen, B. and P. Gupta (2010).. . 20 .
(4) 78. Yokohama Journal of Social Sciences, Vol. 18, No. 6. (548). Table 1 Geographic Distribution of World Trade in Goods According to Production Stage (World total=100%) Flow Primary Goods Export. Primary Goods. Total. Partner–World 2011 Intermediate Final Goods Goods. Total. China. 1.7. 4.4. 10.8. 6.8. 0.7. 8.1. 19.5. 11.4. ASEAN. 4.3. 7.2. 6.2. 6.5. 5.2. 9.5. 5.7. 6.8. India. 0.5. 0.8. 0.7. 0.8. 0.8. 1.9. 1.3. 1.5. Japan. 0.4. 8.2. 8. 7.3. 0.4. 17.2. 5.7. 5. EU27. 13.7. 38.3. 40.2. 36.5. 10.1. 34.1. 39. 31.6 8.1. US. Import. Partner–World 2001 Intermediate Final Goods Goods. 6.3. 14.2. 11.3. 12.2. 4.7. 9.4. 8. ROW. 73.1. 26.6. 22.8. 30. 78. 19.8. 20.8. 36. World. 100. 100. 100. 100. 100. 100. 100. 100. China. 4.7. 4.5. 2.1. 3.5. 17. 9. 5.5. 9.2. ASEAN. 5.2. 7.5. 3.5. 5.6. 4.8. 8.2. 3.9. 6.1. India. 3.4. 0.8. 0.3. 0.9. 5.9. 2.8. 1. 2.7. Japan. 10.7. 4.7. 5.6. 5.7. 8.5. 4.2. 4.4. 5. EU27. 34.6. 37.4. 39.9. 38.1. 30.1. 34.3. 38. 34.8. US. 17.4. 15.5. 22.8. 18.8. 13.6. 10.4. 16.2. 13. ROW. 24. 29.6. 25.9. 27.4. 20.2. 31.1. 31. 29.1. World. 100. 100. 100. 100. 100. 100. 100. 100. Source: Compiled based on REITI TID 2012 Database August, 2013 (Based on Author’s calculations). services sector requires data at a disaggregated level but limitations of finding such data is the reason why we exclude services from this research. For instance, the International Input-Output Tables only includes 4 classifications of service industries: Construction, Trade and transport, other services and Public administration. Such a broad aggregation of services industry constrains the meaningful analysis of India’s service industry which mainly trades with the world in software services. The structure of the paper is as follows. In Section 2, we explain the motivation for research. In section 3 we review the literature on intermediate value chain. In section 4, the data and methodology for the paper is elucidated. In Section 5 and Section 6 we examine India’s intermediate good trade using two different methodologies, i.e. RIEIT Trade (REITI TID) database and BRICS Input-Output table (IO). The final section 7 is devoted to drawing conclusions from the analysis and scope for future research 2. Motivation of the Research In Asia, the attractiveness of China and ASEAN countries as a favorable manufacturing base and increased agglomeration of industries in these countries has increased their significance in intermediate goods trade. Together these two regions are accountable for much of the intermediate goods trade in this region. Table 1 shows the geographical distribution of world trade of goods according to production stage. In 2001 the share of China’s trade as a percentage of total world trade in primary, intermediate and final goods was 1.7%, 4.4% and 10.8 % respectively. Its share of world trade was the least in primary goods which reduced to almost half.
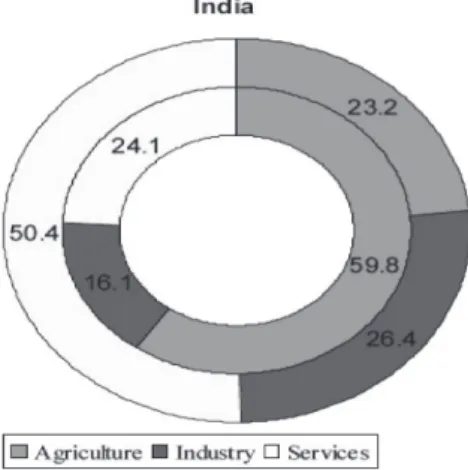
(5) India’s Intermediate Goods Trade in the Inter-regional Value Chain(Simi Thambi) (549). 79. of its value of 2001 over the ten year period till 2011. On the other hand if we look at China’s trade of intermediate goods as a share of total world trade in intermediate goods we find that it almost doubled to 8.1% in 2011. China’s trade in final goods also showed a jump during the ten year period increasing to 19.5% of total world trade in final goods in the year 2011. If we look at the import of intermediate goods, there too the share of China almost doubled. The share of China in world intermediate goods imports more than doubled from 4.4% to 9% between 2001 and 2011. An interesting point to note is that the share of China in world final good import was only 5% in 2011 which is a meager amount when compared to China’s share in world final good export that stood at 19.5% in the same year. From above figures we can understand that in the intermediate good category, over the 10 year period China doubled its share of both imports and exports in world trade. In the final good category it significantly increased its share only in the export of final goods. This indicates that China increased its position in the global production network mainly as the supplier of intermediate goods. This trade statistic result is in tandem with Baldwin (2013) result presented in Figure 2. Figure 2 presents the global sourcing strategies matrix for domestic production at the global level. Baldwin used a comparison of 1995 and 2009 to see an increase in the position of China as a supplier of intermediate inputs shown. The rows indicate the sales by row country to the column countries. The row next to China shows an increase in sourcing to most of the countries included in the matrix. Table 1 also shows the share of ASEAN. ASEAN including Indonesia, Malaysia, Philippines, Singapore, Thailand, Brunei (Darussalam), Cambodia, Vietnam increased its share of intermediate goods from 7.2 % in 2001 to 9.5% in 2011. The share of ASEAN export in world trade of primary goods increased a bit from 4.3% to 5.2% between 2001 and 2011. Its share in world trade of final goods reduced a little from 6.2% to 5.7% between 2001 and 2011. When we look at imports, we find that ASEAN’s share of intermediate goods is also high like its exports of intermediate goods. This share increased from 7.5% to 8.2% between 2001 and 2011. The share of ASEAN imports in world trade of primary goods fell from 5.2% to 4.8%. The share of ASEAN imports in world trade of final goods increased only slightly from 3.5% to 3.9%. Thus from the above figures we can see that ASEAN like China trades the most with the world through its export and import of intermediate goods. If we compare with China or ASEAN, India’s performance in intermediate goods has been lackluster. Although India’s share in global export doubled from 0.8% to 1.9% and import of intermediate goods more than doubled from 0.8% to 2.8% between 2001 and 2011, in the discussion on intermediate goods, India is often shadowed by the limelight of China and ASEAN countries. Given the importance of China and ASEAN in intermediate goods trade, a lot of research has been done to examine the nature of their intermediate goods trade. However from an Indian perspective, it is important to research on India and its integration into the regional production networks for two main reasons: First, the similar economic profile of India and China in terms of population and GDP in the past few years is notable. India’s rapid growth rates like China have attracted attention. But little research has been done on the nature of its integration into the interregional value chain of trade in intermediate goods. One possible explanation for this is that ʻIndian Growth Model’ is characterized by IT services led industrialization. This growth model is very different from the Chinese (or East Asian Style) industrialization characterized by manufacturing export led industrialization. Figure 3 shows the structure and employment GDP in India and China, the outer circle shows the distribution of employment and GDP of India and China for the year 2000. Outer circle shows share of GDP and inner circle shows the share of employment. In India services sector contributes the most to GDP (50.4%) but employment in this sector is only 24.1% of the total work force. The contribution of manufacturing sector to GDP is only 26.4% and it employs 16.1% of the total workforce. On the other hand in China, it is the manufacturing sector that contributes the most to GDP (46%) and employs 22.5% of the total workforce. The service sector contributes to 38.9% of GDP and employs 27.5 % of the workforce. The GDP to employment representation is more balanced in the case of China than India. In India concerns are now mounting over the low-employment generation of India’s IT led skill intensive growth model. It is argued.
(6) 80. (550). Yokohama Journal of Social Sciences, Vol. 18, No. 6. Source: Baldwin and Gonzalez (2013) Figure 20: I2P sourcing: Changes between 1995 and 2009 (%).. Figure 2 Global Sourcing Strategies Matrix for Domestic Production–Comparison of 1995 and 2009. that India is facing the situation of good export performance and ʻjobless growth’. Heavy reliance on relatively skillintensive service sectors has created limited prospects for employment growth in India during the past two decades. An average of 13 million people can be expected to enter into India’s labor force annually in the next four decades, most of whom will be unskilled workers. To absorb such a massive expansion of the workforce, India will need to develop more manufacturing sectors that are labor-intensive (UNESCAP, 2011). Therefore a study of India’s integration into trade networks is the need of the hour. Second, Intermediate goods are an important part of India’s trade with the world even though at the regional level India’s contribution to trade is significantly low compared to China and ASEAN countries. Table 2 shows the importance.
(7) India’s Intermediate Goods Trade in the Inter-regional Value Chain(Simi Thambi) (551). 81. Source: UNESCAP 2011. Figure 3 Distribution of Employment and GDP by Sector, China and India, 2000. Table 2 Importance of Primary, Intermediate and Final Goods in Indiaʼs Trade with the World (Total of Primary, Intermediate and Final goods= 100%) Flow India. Partner–World 2001 Primary Goods. Intermediate Goods. Partner–World 2011. Final Goods. Total. Primary Goods. Intermediate Goods. Final Goods. Total. Export. 7. 52. 41. 100. 9. 60. 31. 100. Import. 42. 44. 14. 100. 13. 49. 38. 100. Source: Compiled based on REITI TID 2012 Database August, 2013 (Based on Author’s calculations).
(8) 82. Yokohama Journal of Social Sciences, Vol. 18, No. 6. (552). of primary, intermediate and final goods in India’s trade with the world. In the three BEC classifications of goods, India trades the most with the world in intermediate goods. India’s intermediate exports accounted for 52% of India’s trade with the world in 2001 and this increased to 60% in 2011. On the other hand, the share of India’s export to world in primary goods was a meager 7% and 9% of world trade in 2001 and 2011. The share of final good exports in India’s trade with the world fell from 41% to 31%. We find a similar picture of importance of intermediate goods in India’s trade with the world when we look at India’s imports. India imported intermediate goods the most in both the years 2001 and 2011. Its share increased fairly from 44% to 49% between 2001 and 2011. The share of primary products in India’s total trade with the world fell from 42% in 2001 to 13% in 2011 while the share of final goods in India’s total trade with the world increased from 14% to 34%. Therefore India’s position in global value chain maybe weak but if we look at India’s trade in goods with the world, we find it is intermediate goods which account for most of India’s trade. Based on the above arguments in the following sections we try to examine the nature of India’s intermediate goods trade and its integration into the interregional value chain especially its interaction with China. 3. Literature Review on Intermediate Goods Trade and Value Chain The literature in the field of international production networks can be divided into two broad sets based on area of coverage: Global and Asian region. The first set deals with this topic as a whole with interconnection across regions: Asia, Europe, and America. The most notable and latest works in this area include the works of Baldwin and Gonzalez. Baldwin (2012) looks at the importance and future of supply chains which is a narrower aspect of value chains. He provides a general idea of global supply chains: past, present and future. According to him supply chains are as old as industry itself. He divided the evolution of supply chain into two parts - the first and second unbundling of globalization. While the first unbundling was initiated by transportation made possible by steam, the second was initiated by transmission made possible by ICT. He identifies that the world is now in the 2nd phase of unbundling, some production stages previously performed in close proximity were dispersed geographically. In the previous stage of unbundling, firms had to be in close proximity to perform best but ICT revolution has helped the firms to grow over the ʻcoordination glue’ as now it’s not too complex to manage operations across borders3). In his paper, he provides many schematic frameworks in which this 2nd unbundling process is being carried out. One interesting finding of his study relevant for our paper is the rise of Asia in intermediate goods trade and even within that the rise in the share of electronics and other related equipment. Gonzalez (2012) in the first essay of his thesis conducts a bilateral input-output analysis looking at both the country of import and destination of export. He does this by looking at backward and forward linkages of the input-output table. One of the interesting finding of his analysis is that global supply chain is more regional than global. Given the importance of China and ASEAN in intermediate goods trade, there is a wide range of literature that looks at Asian aspect of intermediate goods trade especially China’s intermediate goods trade. We club this under the second set which looks at specific region i.e. the Asian region. Study of China and ASEAN or China and Japan are common themes under this set. The methodologies used range from trade data analysis to input-output analysis. (Ha Thi. . 3) According to Baldwin, the ʻcoordination glue’ began to melt from the mid-1980s because of two main reasons: • The ICT revolution made it possible to coordinate complexity at distance. • The vast wage differences between developed and developing nations made separation profitable. This was globalisation’s 2nd unbundling–some production stages previously performed in close proximity were dispersed geographically (For more details see Baldwin 2012, Figure 3, and Page 4)..
(9) India’s Intermediate Goods Trade in the Inter-regional Value Chain(Simi Thambi) (553). 83. Hong Van 2011)( Makishima 2011) (Yasuhi2011) (Yamada 2004, 2006)(Wang 2004) (Wang and Uemura 2006) (Hasebe and Shrestha 2006) (Hasegawa 2012) among others. India even though in Asia is rarely mentioned or given a passing mention to. There is a scarcity of literature that examines India and its role in regional value chain. UNENSCAP (2011) and Yamashita (2012) look at India and its role in production networks using UNComtrade statistics. Athukorala (2008, 2013) evaluates India’s participation in the production networks using gravity models. Most of these studies rely on trade statistics as an empirical tool of analysis. Depending on only trade statistics as a tool of analysis, constrains an in depth understanding of trade in intermediates. Trade data is collected according to the industry of origin. Assuming the industry producing the good in one country sells it to the same industry in the other country/region. This means this database does not provide information about the inter-industry usage of intermediate goods across different countries/ regions. However intermediate goods and services are not only used within the same industry at higher stages of the production chain, but also by other industries. Using International Input-Output (IIO) table overcomes this weakness of the trade statistics.While trade statistics only show direct interconnection among sectors, IO analysis shows direct and indirect interconnection of inputs from various sectors. Thus an important advantage of using input-output tables is that it shows the interdependence across different industries of different countries. It was difficult to find a study that used input-output analysis to look at India’s production network linkages. This is where this research aims to fill the gap in literature. This paper will use the methodology of trade statistics as well as input-output analysis to examine the research topic. 4. Methodology and Data The objective of this paper is to analyze the nature of India’s intermediate goods trade in the interregional value chain. We are especially interested in India’s intermediate goods trade with China. We use two methods: Trade Data Analysis and Input-Output Analysis. 4.1 Trade Data Analysis REITI Trade Industry database or REITI TID-2012 is a very useful way of analyzing trade in intermediate goods among many counties.The export value and import value of the countries and regions are organized by partner country (including global total), industry (13), production process (five stages/ three stages), and year. In Section 5 to get a broader picture we first look at India’s intermediate goods trade with the following 3 countries and two areas – China, Japan, US, ASEAN (Including Indonesia, Malaysia, Philippines, Singapore, Thailand, Brunei (Darussalam), Cambodia, Vietnam), EU27 (United Kingdom, France, Germany, Italy, Austria, Belgium-Luxembourg, Denmark, Finland, Greece, Ireland, Netherlands, Portugal, Spain, Sweden, Bulgaria, Cyprus, Czechoslovakia, Estonia, Hungary, Latvia, Lithuania, Malta, Poland, Romania, Slovenia). REITI TID divides each production stage into 3 categories: Primary, Intermediate and Final goods. Intermediate goods can be further divided into: Processed goods; Parts and components 4). The above classification of goods is provided for 13 industries-Foods; Textile; Pulp, Paper and Wood; Chemicals; Oil and Coal; Stone, clay, glass and concrete products; Iron and steel , Nonferrous metals; General machinery, Electrical machinery; Household Electrical. . 4) Processed goods and Parts and components can further be divided into the following items-Processed goods: Food and beverages, processed, mainly for industry, Industrial supplies, n.e.s., processed, Fuels and lubricants, processed, Parts & Components: Parts and accessories of capital goods, except transport equipment; Parts and accessories of transport equipment (REITI TID database)..
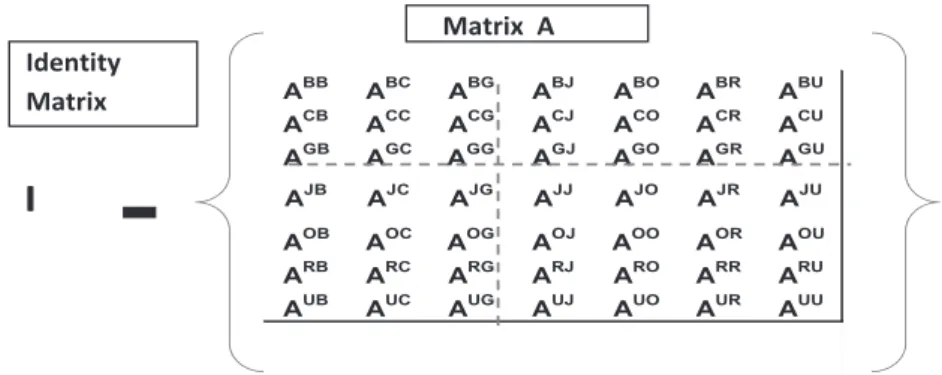
(10) Corrected Version: Page 84 84. (554) Yokohama Journal of Social Sciences, Vol. 18, No. 6 Figure 4: Schematic representation of (I- A) matrix of 2005 BRICS IO table.. Matrix A Identity Matrix . I. BB. A CC A GC A. JB. A. OB. A RC A UC A. A CB A GB A A. A RB A UB A. BC. A CG A GG A. BG. A CJ A GJ A. JC. A. OC. A RG A UG A. BJ. A CO A GO A. JG. A. OG. A RJ A UJ A. BO. A CR A GR A. JJ. A. OJ. A RO A UO A. BR. A CU A GU A. JO. A. OO. A RR A UR A. BU. JR. A. OR. A RU A UU A. JU. OU. Figure 4 Schematic Representation of (I-A) Matrix of 2005 BRICS IO Table. appliances; Transport equipment; Precision Corrected Version: Page 85 machinery, Toys and miscellaneous goods.. The advantage of trade data as compared to I-O Tables is that it helps in looking at bilateral trade patterns of intermediate goods at a disaggregated level. Furthermore it helps in looking at changes overtime as the data for several Backward Linkage: years are available.. 4.2 Input-Output Analysis There are two types of Input-Output (IO) Tables in the study of IO analysis: National IO Tables and International IO Tables (IIO). The former focuses on interactions among different sectors within an economy. The later focuses on. Miller–Blair (2009). interactions among different sectors across different countries, the countries that are not included are clubbed into the rest ofPower the world. are interested in the latter i.e. India in the international IO analysis. For this we rely on BRICS of We Dispersion: 2005 IO Table.. Institute of Developing Economies (IDE) provides the BRICs 2005 Input-Output table. This IIO table covers the following countries- Brazil, Russia, India, China, US, Japan, EU. We are interested mainly in intermediate demand and supply matrix as denoted by matrix A (Input Coefficient Matrix). A’ shows the input coefficient of each of the 25 industries for BRIC+3 countries. Input required to produce one unit of output. From the standard equations of IO analysis,. where R,S= B,R,I,C, J, U,E and i, j=1,2,3…25 Miller–Blair (2009). X = AX + F X = (I-A)-1F. where I stands for Identity Matrix, A stands for Input coefficient Matrix, F stands for Final demand. -1 are interested in the (I-A) the Leontief Inverse Matrix which gives the linkages. We External Backward Linkage. Let L= (I-A)-1. Figure 4 gives the schematic representation of (I-A) matrix of 2005 BRICS IO table. Where I is. the Identity Matrix of the same size as Matrix A with all diagonal elements =1 and all the other values = 0. The BRICS IO table is divided into four categories in matrix form based on interactions among- i, j, R, S. RS. Aij shows the input coefficient to be purchased by the j-th industrial sector in the country (or economy) S in the intermediate input produced in the i-th industrial sector in the country (or economy) R. There are 25 sectors in each country in the BRICS IO Table..
(11) India’s Intermediate Goods Trade in the Inter-regional Value Chain(Simi Thambi) (555). 85. Countries= Brazil, Russia, India, China, Japan, US, EU (B, R, I, C, J, U, E) = 7 countries AijRS= [AijRS ] where R, S= B, R, I, C, J, U, E and i, j=1, 2, 3...25. The matrix in the case of R=S is domestic intermediate demand. The matrix in the case of R ≠ S is to show the trade coefficient matrix from the economy R to the economy S. 25 sectors in 7 countries therefore n=25×7=175 (Size of Matrix) Input Coefficient Matrix [AijRS ] =175×175 (domestic intermediate input coefficient + trade coefficient) square matrix From the above, we are interested in calculating the following, Backward Linkage: BLj =. n. Lrsij. i. Miller–Blair (2009) Power of Dispersion: Uj=. Lrsij. i i. j. Lrsij n. where R, S= B, R, I, C, J, U, E and i, j=1, 2, 3...25 Miller–Blair (2009) External Backward Linkage. EBLsj=. 1 n-25. R. R. Lrsij. i. S. i. j. Lrsij. where R≠S i, j=1, 2, 3...25 [Hasegawa (2012) Toshiaki et al. (2012)] External backward linkage (EBL) determines the extent to which, the industry of one country depends on the component suppliers of another country. From Leontief Inverse [LijRS] we calculate EBL for the inverse of trade coefficient part with the other 6 regions (excluding India) to identify the linkages between the j-th sector in destination S and the i-th industry in the shipping region R, i.e., excluding the diagonal block-matrix of self region’s transaction part, within the block-matrix consisting of 7 regions and the self economic region (R=S) (Hasegawa 2012, Toshiaki et al. 2012). One problem of BRICs IO Table is that it is provided only for the year 2005, thus it is not possible to look at the changing interdependence overtime between India and these countries. Furthermore, it does not include ASEAN; hence it is difficult to see the interaction between India and ASEAN countries. Nevertheless it provides a useful way to look at the intermediate goods interdependence..
(12) 86. Yokohama Journal of Social Sciences, Vol. 18, No. 6. (556). Table 3 Share of Each Industry in Total Intermediate Goods Trade of India (According to Industry Classification) Partner–World Export 2001 1. Food 2. Textiles 3. Pulp, Paper and Wood. Partner–World Import. 2011. 2001. 2011. 3.27. 1.98. 0.29. 0.25. 15.28. 5.86. 4.23. 1.73. 5.68. 4.24. 10.12. 6.56. 4. Chemicals. 19.06. 16.69. 24.01. 19.55. 5. Oil and Coal. 16.82. 30.77. 8.62. 9.50. 6. Stone, clay, glass and concrete products. 26.59. 17.11. 2.43. 10.16. 7. Iron and steel and non ferrous metals. 10.63. 12.36. 28.92. 36.48. 8. General machinery. 5.76. 4.77. 9.53. 6.68. 9. Electrical machinery. 3.76. 3.09. 7.66. 5.60. 10. Household Electrical appliances. 0.65. 0.23. 0.40. 0.25. 11. Transport equipment. 1.78. 2.14. 1.83. 2.39. 12. Precision machinery. 0.18. 0.24. 0.85. 0.34. 13. Toys and miscellaneous goods. 0.54. 0.53. 1.11. 0.52. 1. 1. 1. 1. Industry Total (13 industries) Source: RIETI TID Database accessed August 2013 (Based on Author’s calculations). The drawback of both these databases is that it records the data in currency terms (US dollar) therefore making it susceptible to exchange rate fluctuations over the period under consideration. Nevertheless, the use of both these methods helps in getting a more holistic picture of intermediate goods trade. 5. Indiaʼs Intermediate Goods Trade using Trade Statistics In this section using the RIETI TID 2012 database we try to examine India’s intermediate goods trade based on industry classification and geographical distribution. Table 3 shows the share of each of the 13 industry classifications of REITI in India’s total intermediate good trade with the world (13 industry total). The percentage can be calculated by looking at the intermediate exports from each industry by India to the world divided by India’s total export of intermediate goods (Industry total) to the world in that year. We can see that in 2001 India exported the most intermediate goods in stone, clay, glass and concrete products which stood at 26% of the total trade in intermediate goods, followed by chemicals at 19.06% and oil and coal at 16.82%. In 2011, the same industries were the main exporters but just the order changed, oil and coal at 30.77%, the share of stone and clay fell to 17.11% and the share of chemical also fell a little to 16.69% in 2011. Between 2001 and 2011 the share of most of the other industries in India’s total intermediate exports fell. The only industries that showed a little bit of increase were: iron and steel and non ferrous metals, transport equipment and precision machinery. When we look at imports of intermediate goods from the world, we find the industry that imported the most in both 2001 and 2011 was iron and steel and non ferrous metals followed by chemicals. The import of all other industries fell except transport equipment: stone, clay glass and concrete products. Table 4 looks at the geographical distribution of India’s trade in intermediate goods. The percentage can be calculated by dividing India’s export of intermediate goods to each country with the total export of intermediate goods.
(13) India’s Intermediate Goods Trade in the Inter-regional Value Chain(Simi Thambi) (557) 87. Table 4 Geographical Distribution of Indiaʼs Trade in Intermediate goods Share of each country in India’s total trade in intermediate goods Export 2001. Import 2011. 2001. 2011. China. 3.77. 5.86. 6.29. 13.39. ASEAN. 10.34. 13.43. 12.22. 10.13. Japan. 4.05. 3.36. 5.50. 3.27. EU27. 21.49. 20.82. 18.20. 12.24. US. 18.97. 14.53. 7.46. 5.98. Source: RIETI TID Database accessed August 2013 (Based on Author’s calculations). Table 5 Indiaʼs Intermediate Good Import from China According to Industry classification Import 2001 1. Food 2. Textiles 3. Pulp, Paper and Wood. 2011 0.56. 0.22. 16.64. 6.73. 0.74. 3. 4. Chemicals. 34.39. 32.85. 5. Oil and Coal. 10.01. 2.93. 6. Stone, clay, glass and concrete products 7. Iron and steel and non ferrous metals. 2.14. 3.04. 13.70. 21.21. 8. General machinery. 8.06. 11.45. 9. Electrical machinery. 8.54. 12.72. 10. Household Electrical appliances. 3.01. 1.02. 11. Transport equipment. 0.28. 3.46. 12. Precision machinery. 0.75. 0.56. 13. Toys and miscellaneous goods. 1.18. 0.81. 14. Industry Total (13 industries). 100. 100. Source: RIETI TID Database accessed August 2013 (Based on Author’s calculations). from India to the world. It can be seen that India exports much of its intermediate goods to EU27 followed by US. The order remained the same in both 2001 and 2011. As for imports it can be seen that India imported the most of its intermediate goods from EU 27 in 2001 but this changed in 2011. China’s share in India’s intermediate goods more than doubled between 2001 and 2011 increasing from 6.29% to 13.39% of India’s total import of intermediate goods import. It is also interesting to see that in the year 2011 besides China the share of all the other countries decreased. Table 5 looks at India’s intermediate goods imports from China according to 13 industry classification. The percentage can be calculated by dividing the intermediate imports from China of each industry divided by the industry total of intermediate imports from China. The share of chemicals in intermediate imports was highest in both years amounting to at least 30%. In 2001.
(14) 88. (558). Yokohama Journal of Social Sciences, Vol. 18, No. 6. the industry that imported second most was textiles amounting to 16.64% of total intermediate imports from China. Between 2001 and 2011 the share of iron steel and non ferrous metals increased from 13.70% to 21.21% percent to become the industry that imported second most from China after chemicals. It is interesting to see that the share of stone, clay, glass and concrete products, which accounts for a large share of India’s total intermediate imports from the world based on Table 3, has a very small share in imports from China. This goes to show that much of it comes from other countries. In 2011 at the third and fourth level were electrical machinery and general machinery at 12.72% and 11.45% of India’s total imports from China respectively. The position of these industries jumped up compared to the year 2001. It is also interesting to note that the share of transport equipment increased more than 12 times, from a mere 0.28 % to 2.46 %, making it the industry which showed the most growth intensity. Thus, in this section we first looked at, the share of each industry in total intermediate goods trade of India (according to industry classification). We found that stone, clay, glass and concrete products; chemicals; oil and coal; iron and steel non ferrous metals were the front runners in India’s intermediate goods (both exports and imports) to the world in 2011. India’s exports most to EU and US but imports most from EU and China. China’s position in India’s imports overtook EU in 2011.The share of electrical/machinery items i.e. general machinery, electrical machinery and transport equipment is steadily increasing in India’s intermediate good import from China. This could be one reason for the jump in the position of China. 6. Input-Output Analysis of Indiaʼs Intermediate Goods Trade Linkage analysis provides a very useful way to look at the interdependence of supply and demand across sectors as well as countries. The standard method for such an analysis of interdependence is backward and forward linkages. International backward linkage can be defined as the extent to which, the industry of one country depends on the component suppliers of another country. International forward linkages determine the extent to which the industries of other countries depend of the output of the industry of a given country. Domestic backward linkages can be defined as the extent to which industry in one sector depends on the industry in another sector. Domestic forward linkages can be defined as the extent to which other industry’s output depends on the output of a given industry. Based on the analysis of the previous sections, generally we can expect international forward linkages to be low for India because of India’s weak position as an exporter in the region5). As for international backward linkages, we can expect them to be most with EU and China. Using BRICS 2005 IO Table in our analysis, we are interested in the following: a. We first look at interdependence between different sectors of India and all BRIC+3 countries without differentiating the country of origin. In this part the intensity of backward linkage (BL) is measured with an index known as the ʻPower of dispersion’. Similarly the intensity of forward linkage (FL) is measured with an index known as the ʻSensitivity of Dispersion’. An index value of more than one means that the industry has a power of dispersion/sensitivity of dispersion greater than the average of all industries. However this total figure for power of dispersion includes both domestic and external backward linkages. To look at just the external BL/FL we subtract from it domestic BL/FL from the total to calculate the External Backward Linkage (EBL) and External Forward Linkage (EFL).. . 5) The result shown on Table 7 confirms this point..
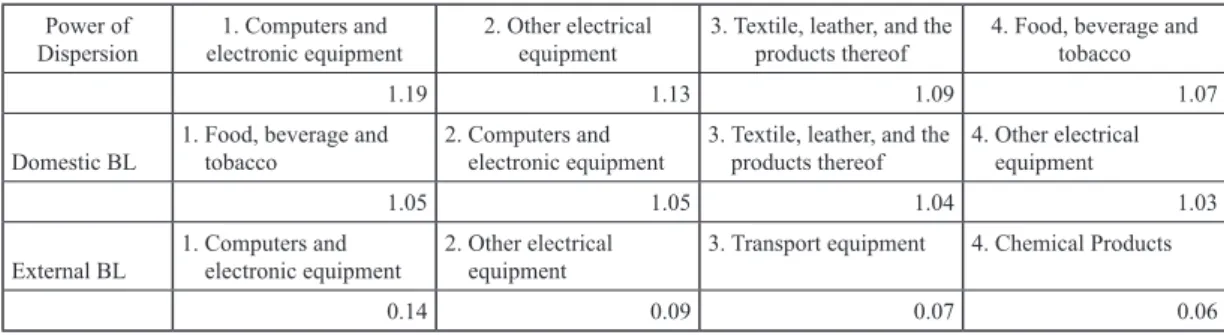
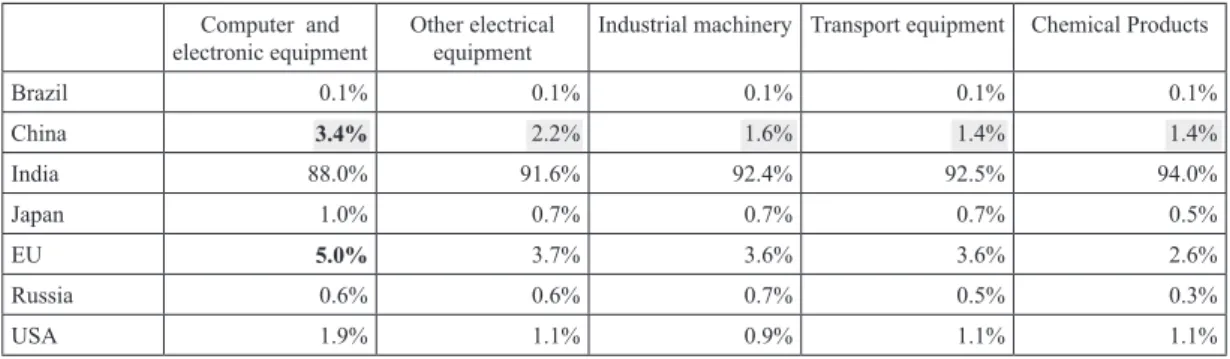
(15) India’s Intermediate Goods Trade in the Inter-regional Value Chain(Simi Thambi) (559) 89. Table 6 Power of Dispersion of Top 4 Industries: Result of IO Analysis Power of Dispersion. 1. Computers and electronic equipment. 2. Other electrical equipment. 1.19 Domestic BL. 1. Food, beverage and tobacco. 1.13 2. Computers and electronic equipment. 1.05 External BL. 1. Computers and electronic equipment. 3. Textile, leather, and the products thereof 1.09. 0.14. 1.07. 3. Textile, leather, and the 4. Other electrical products thereof equipment. 1.05 2. Other electrical equipment. 4. Food, beverage and tobacco. 1.04 3. Transport equipment. 0.09. 0.07. 1.03 4. Chemical Products 0.06. (Based on Author’s calculations). b. Next, we look at interdependence between different sectors of India and each of the BRIC+3 countries. For this we look at India’s industry wise backward and forward linkage to each country. This can be calculated as the sum of column (for backward linkage) and rows (for forward linkage) of the Leontief inverse matrix. For the first part, we tried to identify the industries within the top 4 rank in power of dispersion and sensitivity of dispersion index. Our analysis shows the following: When we look at the total figure of power of dispersion of India as can be seen in Table 6, it is highest for computer and electronic equipment, followed by, other electrical equipment, textile, leather, and the products thereof and finally food, beverage and tobacco. In other words generally these industries depend most on component suppliers when compared to other industries. As can be seen from Table 6, external backward linkages were also the most for computer and electronic equipment, other electrical equipment, followed by transport equipment and chemical products in that order. That is, relative to the other industries, these industries purchase most inputs from the industries of BRIC+3 countries. Textile, leather, and the products thereof; & food, beverage and tobacco do not figure high in external backward linkage implying that the backward linkages in these industries are more domestic than external. The ranking of domestic BL is also shown for reference. The table shows that out of all industries computer and electronic equipment clearly tops the average of all other industries in terms of both domestic and external backward linkages. Table 7 shows the sensitivity of dispersion of top 4 industries. When we look at sensitivity of dispersion, the index is highest for trade and transport followed by other services, chemical products, metal and metal products. In other words the influence of these sectors on the economy as suppliers is higher than the average of all industries. We can see that the top rankers are services industries except chemical & metal and metal Products. Just like in the case of external BL we calculate external forward linkage (FL). The ranking of the top four industries is in the following orderchemical products, trade and transport, other mining, petroleum and petro products. The contribution of these four industries to the index of sensitivity of dispersion was the most. That is, relative to the average of the other industries, these industries supply more of their output to industries of BRIC+3 countries. Under the category of manufacturing intermediate goods, it is the chemical products industry tops the list. In the second part of this section as mentioned in point b above, we look at country specific linkages between different sectors of India and each country of BRICS as shown in Table 8. At the overall level, we see that India has maximum backward linkages with EU followed by China. With both these partners, among all the industries, the backward linkages are the highest in computers and electronic equipment followed by, other electrical equipment,.
(16) 90. Yokohama Journal of Social Sciences, Vol. 18, No. 6. (560). Table 7 Sensitivity of Dispersion of Top 4 Industries: Result of IO Analysis Sensitivity of Dispersion. Trade and transport. Other services. 2.21 Domestic FL. External FL. Chemical products 1.57. Metal and Metal Products. 1.42. 1.36. Trade and transport. Other services. Chemical products. Metal and Metal Products. 2.18. 1.55. 1.38. 1.34. Chemical products. Trade and Transport. Other mining. Petroleum and petro products. .039. .038. .02. .019. (Based on Author’s calculations). Table 8 Top 4 Backward linkages of India with BRICs+3 Countries: Result of IO Analysis Computer and electronic equipment. Other electrical equipment. Industrial machinery Transport equipment. Chemical Products. Brazil. 0.1%. 0.1%. 0.1%. 0.1%. 0.1%. China. 3.4%. 2.2%. 1.6%. 1.4%. 1.4%. India. 88.0%. 91.6%. 92.4%. 92.5%. 94.0%. Japan. 1.0%. 0.7%. 0.7%. 0.7%. 0.5%. EU. 5.0%. 3.7%. 3.6%. 3.6%. 2.6%. Russia. 0.6%. 0.6%. 0.7%. 0.5%. 0.3%. USA. 1.9%. 1.1%. 0.9%. 1.1%. 1.1%. (Based on Author’s calculations). industrial machinery, transport equipment and chemical products. An analysis of the external forward linkages of each Indian industry to each BRIC+3 as expected reveals a very weak position of India in intermediate goods trade. The only industry in which India has significant forward linkages is ʻother mining’ industry which is with China and stands at a relatively high level of 3.1%, for all other countries the figure is less than 0.4%. Thus, the important findings based on tables, Table 6, 7 and 8 can be summarized as follows: EBL are highest in the following industries- computer and electronic equipment, other electrical equipment, transport equipment and chemical products. These external linkages are most with EU followed by China for all these industries. 7. Conclusion Based on the results of our trade data analysis and international input-output analysis of value chains of the Indian economy, we can draw the following conclusions: 1. Chemicals figures as a top industry in both trade statistics (Export/Import/Import from China) and IO analysis. In other words, not only is the share of this industry high in India’s trade basket but also the linkages of this industry are high both domestic and external linkages. 2. The share of iron and steel in India’s import basket was the highest but it does not figure among top industries with linkages. This implies few backward linkages with other industries; it could be because the inputs are produced and consumed in the industry of origin and industry of import respectively..
(17) India’s Intermediate Goods Trade in the Inter-regional Value Chain(Simi Thambi) (561). 91. 3. Out of all the industries, the sensitivity of dispersion (Index for backward linkage) was the highest for computer and electronic equipment, other electronic equipment, textiles and food in that order. However if we exclude the domestic inter industry linkages to look at just external power of dispersion. We find computer and electronic equipment, other electronic equipment; continue to hold their position, the third and the fourth place is taken up by transport equipment and chemicals. 4. A country wise look at India’s external backward linkages shows EU followed China take the top place. Among the industries with the linkages with these countries, on the top figure, computer and electronic equipment, other electronic equipment followed by industrial machinery, transport equipment, and chemicals. Therefore from an Indian point of view its trade in intermediate goods with both EU and China is important especially for computer and electronic related industries. 5. Overall backward linkages of the computer and electrical equipment and other machinery industries are the highest, in spite of the fact that the shares of those industries are not so high in India’s trade basket. The result of the analysis is consistent with Baldwin’s argument, “21st century trade is concentrated in relatively few sectors. Electrical machinery and electronics take the lion’s share of the level and the growth in the 1990s” (Baldwin 2012, Pg. 6). As a first step in research, this paper tried to identify India’s position in inter regional value chain of intermediate goods using the methodology of Input-Output analysis as well as trade data. We found India is lagging far behind the other Asian economies in benefitting from the new form of fragmentation based production network trade. Based on trade data analysis our results confirm the previous studies in this area that India’s participation in regional production networks is low (UNESCAP 2011, Athukorala 2013). India continues to trade with the world mostly in resource based intermediate goods like stone, clay, glass and concrete products; chemicals; oil and coal; iron and steel non ferrous metals (both export and import). This result is in synch with the UNESCAP (2011) study which compared India and China value chain activity to find India’s merchandize trade to be resource based while China is moving up the value chain ladder from low skill intensive electronic products to high skill intensive electronic products. In this context, the recent trend of rising wages in China opens up an opportunity for India to cash in on its low cost labor advantage as well as population boom and formulate trade policies for better integration into these production networks. One novel conclusion of this paper is the importance of China in India’s international value chain. The past researches in this field have only used trade statistics which fail to give a complete picture as they do not show interdependencies among different industries of different countries. As a result of using the IO analysis, in our study we were able to observe the high level of linkages between India and China in computer and electronics industry which otherwise were not visible if we look only at the trade data analysis result. This result of the paper confirms Baldwin and Gonzalez (2013) argument that the supply chain is more regional than global. Based on trade data analysis comparison of 2001 and 2011, we found that trade with China especially imports from China has increased significantly. As a share of total imports, chemicals or iron and steel, are the top industries but if we look at backward linkages, they are the most in computer and electronic equipment related industries. This conclusion of the paper has important policy implications for India’s trade engagement with China. China’s position in India’s intermediate goods imports doubled between 2001 and 2011 over shooting the position of EU and US. Because of the unavailability of BRICS IO data beyond 2005, we were not able to see this through IO table. Nevertheless, we can definitely expect the linkages in computer and electronic equipment with China to have over shot that of EU. It will be interesting to check this fact when data becomes available for future research. For future research, it will be interesting to examine the import content of China’s exports into India. Furthermore,.
(18) 92. (562). Yokohama Journal of Social Sciences, Vol. 18, No. 6. as India is a famous for its rapidly growing IT services especially software sector, it would be interesting to observe backward and forward linkages across different classifications of service industry.. References Athukorala, P. (2008). “Export Performance in the Reform Era: Has India Regained the Lost Ground?” in R. Jha (ed.), The Indian Economy Sixty Years after Independence, Palgrave MacMillan, United Kingdom and New York Athukorala, P. (2013), “How India Fits into Global Production Sharing: Experience, Prospects and Policy Options”, Working paper in Trade and Development, Australian National University Balassa, B. (1967) Trade Liberalization among Industrial Countries. McGraw–Hill Press, New York Baldwin, R. (2006) “Globalisation: the Great Unbundling(s)” Working paper for project Globalisation Challenges for Europe and Finland. 20th September, http://appli8.hec.fr/map/files/globalisationthegreatunbundling%28s%29.pdf’ Baldwin, R. (2012) “Global Supply Chains: Why They Emerged, Why They Matter, and Where They Are Going.” Centre for Trade and Economic Integration (CTEI) Papers 2012–132012 Baldwin, R. and Gonzalez, L. (2013) “Supply-Chain Trade: A Portrait of Global Patterns and Several Testable Hypotheses,” NBER Working Paper Series, Working Paper 18957 Deardorff, A. V. (2001) “Fragmentation in Simple Trade Models,” North American Journal of Economics and Finance, 12: 2, 121–137, 2001 Deardorff, A. V. (2006) Terms of Trade: Glossary of International Economics. World Scientific Publishing Eichengreen, B. and P. Gupta. (2010) “The Service Sector as India’s Road to Economic Empirical Tests.” Journal of International Business Studies, 15, 167–188, 2010 Gonzales, L. (2012) “Vertical Specialisation and New Regionalism,” Thesis PhD thesis, University of Sussex Ha Thi Hong Van. (2011) “Intermediate Goods Trade Between China and Vietnam” in Intermediate goods trade in East Asia: Economic Deepening through FTAs/ EPAs’, edited by Matsuhiro Kagami, BRC Research Report No. 5, Bangkok Research Centre, IDE- Jetro, Bangkok Thailand Hasebe and Shrestha. (2006) “Economic Integration in East Asia: A View of Interdependence based on Intermediate Inputs.” Centre for International Trade Studies (CITS Working Paper), CITSWP 2006–02. Yokohama National University Hasegawa, T. (2012) “External Backward Linkage and External Forward Linkage in Asian International Input-Output Table,” 20th INFORUM World Conference in Firenze 2012 Hummels, D., Ishii, J., and Yi K. M. (2001) “The Nature and Growth of Vertical Specialization in World Trade,” Journal of International Economics, 54: 75–96 Jones, R.W., and Kierzkowski, H. (1990) “The Role of Services in Production and International Trade: A Theoretical Framework,” in R.W. Jones and A. O. Krueger (eds.), The Political Economy of International Trade. Oxford: Blackwell Krugman, P. R. (1991) “Is Bilateralism Bad?” in Elhanan Helpman and Assaf Razineds International Trade and Trade Policy, Cambridge, MA: MIT Press Makishima M. (2011) “Production Network and Intermediate Goods Trade, Cases of Japan” in ‘Intermediate goods trade in East Asia: Economic Deepening through FTAs/ EPAs’, edited by Matsuhiro Kagami, BRC Research Report No. 5, Bangkok Research Centre, IDE– Jetro, Bangkok Thailand Miroudot, S., R. Lanz and A. Ragoussis. (2009) “Trade in Intermediate Goods and Services”, OECD Trade Policy Papers, No. 93, OECD Publishing. http://dx.doi.org/10.1787/5kmlcxtdlk8r-en Porter, M. E. (1985) Competitive Advantage, Free Press, New York, 1985 UNIDO. (2010), “Mapping Global Value Chains: Intermediate Goods Trade and Structural Change in the World Economy,” Timothy J. Sturgeon & Olga Memedovic, Development Policy and Strategic Research Branch Working Paper 05/2010 UNESCAP. (2011) India: A New Player in Asian Production Networks? Studies in Trade and Investment 75, Edited by Witada Anukoonwattaka and Mia Mikic, in Collaboration with the Asia Pacific Research and Training Network on Trade Wang, J. and Uemura. H, (2006) “Japanese FDI in China and International Production Linkages: Changes in Interdependence between 1995 and 2000,” Economica Vol. 57, No. 2, pp. 29–50, 2006 Wang, J., (2004) “The Impact of the Japanese Multinationals in China: An Input-Output Study”, Yokohama Journal of Social.
(19) India’s Intermediate Goods Trade in the Inter-regional Value Chain(Simi Thambi) (563). 93. Sciences, Vol. 9, No. 2 Yamada, M., (2006) “Input-Output Analysis on Overseas Production of Japanese Firms” in Mitsuo Yamada, and Soshichi Kinoshita eds., Macro-econometric Analysis of Economic Development in East Asia, Chapter 7, Keiso Shobou, pp. 167–188 (in Japanese) Yamada, M. (2004) “Japanese Overseas Production within the Asia International Input Output Framework: Japan, the US, and Asia”, Journal of Econometric Study of Northeast Asia, Economic Research Institute for Northeast Asia, Vol. 5, No. 1, pp. 27–42 Yasuhi U. (2011) “Intermediate Goods Trade in East Asia” in Intermediate Goods Trade in East Asia: Economic Deepening through FTAs/ EPAs, edited by Matsuhiro Kagami, BRC Research Report No. 5, Bangkok Research Centre, IDE-Jetro, Bangkok Thailand Yamashita, N. (2012). “Can India become an Export Platform for Global Operations of Japanese and American multinational corporations affiliates?” Working Papers Asia-Pacific Research and Training Network on Trade (ARTNeT), an Initiative of UNESCAP and IDRC, Canada. [タンビ シミ 横浜国立大学大学院国際社会科学研究科博士課程後期].
(20)
(21)
図


+5

関連したドキュメント
Polarity, Girard’s test from Linear Logic Hypersequent calculus from Fuzzy Logic DM completion from Substructural Logic. to establish uniform cut-elimination for extensions of
In this work we give definitions of the notions of superior limit and inferior limit of a real distribution of n variables at a point of its domain and study some properties of
As Riemann and Klein knew and as was proved rigorously by Weyl, there exist many non-constant meromorphic functions on every abstract connected Rie- mann surface and the compact
Although the Sine β and Airy β characterizations in law (in terms of a family of coupled diffusions) look very similar, the analysis of the limiting marginal statistics of the number
If we find any solution vector x ∗ , for which the optimal solution of the LP is strictly positive, we get a separating hyperplane, thus the lattice is not semi-eutactic and
Moreover, in fashioning his theory of semisimple groups, Weyl drew on a host of ideas from such historically disparate areas as Frobe- nius’ theory of finite group characters,
Section (8) characterises connected limit preserving endofunctors of presheaf categories with rank, and section (9) applies this to the description of some of the more
○事 業 名 海と日本プロジェクト Sea級グルメスタジアム in 石川 ○実施日程・場所 令和元年 7月26日(金) 能登高校(石川県能登町) ○主 催
