based on the Structural Design of
Anthraquinone for Lithium-Oxygen Battery
著者
HAN XIANGBIN
学位授与機関
Tohoku University
博士論文
Development of Oxygen Reduction Redox Mediator based on the
Structural Design of Anthraquinone for Lithium-Oxygen Battery
アントラキノンの構造設計によるリチウム酸素電池の酸素還元レ
ドックスメディエーターの開発に関する研究
Xiang-Bin HAN
Abstract
The redox-mediated mechanism to form discharge product, lithium peroxide (Li2O2), in the solution phase, will alleviate the insulated Li2O2 covering the electrode surface and thus increase the capacity of the Li-O2 battery. Here, a series of oxygen reduction redox mediators (ORRMs) based on anthraquinone (AQ) was developed by a structural design strategy to control the reduction potential and explore correlations between the mediating performance of the oxygen reduction reaction (ORR) and reduction potential of ORRM. With the positive potential shift of ORRMs, the discharge capacity of the Li-O2 battery increases with a higher discharge plateau. When two electron-withdrawing groups, nitro (NO2), were introduced to get the 1,8-Dinitroanthraquinone (1,8-DNAQ), approximately +0.3 V shift of the reduction potential was observed, which is comparable to that of oxygen. By using this molecule as an ORRM, the discharge capacity of the Li-O2 battery increased 45 times with a discharge plateau over 2.7 V. These ORRMs, working as a kind of soluble catalysts, show enhancement effect on the discharge capacity. Furthermore, a synergistic effect between ORRM and water molecule was found to increase the discharge capacity of the Li-O2 battery.
The Li-O2 battery shows different discharge product growth behavior on the graphitic carbon paper electrode and amorphous carbon paper electrode. It was found that the Li2O2 could intercalate into the interlayer of the graphite and exfoliate it to graphene, resulting in a large discharge capacity (120 mAh cm-2) by the surface area increase of the electrode in the process. This important discovery would help to design a new electrode from the graphite-type materials for the Li-O2 battery in the future.
Furthermore, the side reactions during the ORR in the DMSO-based electrolyte solution with ORRM have been quantitatively evaluated by NMR and SERS measurements. Possible reaction mechanisms have been discussed based on the observation results.
Table of Content
Abstract ... I Table of Content ... II List of Abbreviations... IV
Chapter 1. Introduction ... 1
1.1 Brief Introduction of the Li-O2 Battery ... 1
1.2 The Development History of Redox Mediators for the Li-O2 Battery ... 4
1.3 Water Effect on Li-O2 Battery ... 8
1.4 Target of this Dissertation ... 10
1.5 Dissertation Organization ... 11
Chapter 2 AQ-based ORRM Structural Design and its Catalytic Behaviors ... 12
2.1 Design Strategy for the ORRM... 12
2.2 Materials and Methods ... 13
2.2.1 Materials ... 13
2.2.2 Synthesis and Characterization of DCAQ and MCAQ... 14
2.2.3 Instrumentation and Methodology ... 17
2.3 Results and Discussion ... 21
2.3.1 CVs of AQ and its Derivatives... 21
2.3.2 Catalytic Behaviors ... 32
2.3.3 Concentration Effect of ORRM on the Discharge Capacity ... 38
2.3.4 Synergistic Effect Between ORRM and Water ... 41
2.3.5 The Reaction Mechanism of ORRMs ... 51
2.4 Conclusion of Chapter 2 ... 53
Chapter 4 Side reactions in DMSO-based Electrolyte Solution ... 68
4.1 Introduction ... 68
4.2 Materials and Methods ... 70
4.3 Results and Discussion ... 71
4.3 Conclusion of Chapter 4 ... 84
Chapter 5 General Conclusions ... 86
References ... 89
Acknowledgments... 102
List of Abbreviations
abbreviation Full name
LIB Lithium-ion battery
ORRM Oxygen Reduction Redox Mediator OERM Oxygen Evolution Redox Mediator
ECR Electrochemical Reaction CR Chemical Reaction
DN Donor Number
TEGDME Tetraethylene Glycol Dimethyl Ether DME Dimethoxyethane
DMSO Dimethyl Sulfoxide DMSO2 Dimethyl Sulfone
PC Propylene Carbonate HMPA Hexamethylphosphoramide
LiTFSI Lithium bis(trifluoromethanesulfonyl)imide PQ 6,13-Pentacenequinone NAQ 5,12-Naphthacenequinone AQ Anthraquinone MClAQ 1-Chloroanthraquinone DClAQ 1,5-Dichloroanthraquinone MCAQ 1-Cyanoanthraquinone DCAQ 1,5-Dicyanoanthraquinone MNAQ 1-Nitroanthraquinone 1,5-DNAQ 1,5-Dinitroanthraquinone 1,8-DNAQ 1,8-Dinitroanthraquinone
ip,c Reduction current
ip,a Oxidation current
SERS Surface-enhanced Raman spectroscopy SEM Scanning Electron Microscope
TEM Transmission electron microscope SEI Solid Electrolyte Interphase XRD X-ray Diffraction
IR Infrared
Chapter 1. Introduction
1.1 Brief Introduction of the Li-O
2Battery
Recently, the global climate change induced by CO2 emission has become a severe problem for the human living environment.1, 2 The electric vehicles are expected to be an efficient way to replace the petrol-driven vehicles to reduce the CO2 emission 3In contrast, with the increasing demand for the battery capacity and life used in electric vehicles, lithium-ion batteries (LIB) cannot meet the higher requirements.3-8 The metal-air batteries are promising candidates to replace the LIB due to their high energy density than the commercialized LIBs.9-11 Notably, the rechargeable Li-O
2 battery has drawn much more attention because of its high specific energy density. The Li-O2 battery works through forming lithium peroxide (Li2O2) in the discharge process and decomposing it in the continuous charging process (Figure 1.1).3, 12-22 The insulated discharge product, Li2O2, causes a series of problems for the battery. The growth of the Li2O2, covered the electrode surface, leads to quick cell death, relatively low discharge capacity, and high charge overpotential, which severely restricts the development of the battery.17, 18
In 1996, the first Li-O2 battery model was reported by Abraham et al.23 and then opened up the research field of metal-air24-26 (Na-O2, K-O2) battery. Among them, Li-O2 battery is the most attractive one because of its high specific energy, 3458 Wh kg-1 based on discharge product Li2O2 and 11429 Wh kg-1 based on lithium metal anode.27 The Li-O2 battery comprises the cathode, lithium metal anode, separator, and lithium salt and aprotic solvents. Oxygen is reduced to Li2O2 during the discharge on the cathode surface, and Li2O2 is decomposed in the charging process. It offers a theoretical operating potential of 2.96 V. The anode reaction involves the dissolution and deposition of lithium in the discharge and charge process, respectively. During the discharge, oxygen was first reduced to lithium superoxide (LiO2) via a one-electron transfer electrochemical reaction (ECR), as equation (eq) 1, followed by has two possible pathways, electrochemical reaction (eq 2) and disproportionation reaction (eq 3) to form Li2O2.
O2 + Li+ + e- → LiO2 (1, ECR) Li+ + LiO2 + e- → Li2O2 (2, ECR) 2LiO2 → Li2O2 + O2 (3, CR)
The discharge product Li2O2, which is an insulator and also is insoluble in the aprotic electrolyte solution, results in the thin film covering the electrode surface or large toroidal shape particles. When the thickness of the Li2O2 film up to 7 nm, this non-conductive layer would block the electron transfer from the electrode to oxygen, leading to low discharge capacity.28, 29 At the same time, the deposition of Li2O2 causes high charge overpotential.
Usually, it has three methods to improve the discharge capacity. The first and straightforward method is to increase the surface area of the electrode.30 Therefore, porous carbon, carbon nanotube, graphene are used as the cathode material in the Li-O2 battery. The cost of graphene and carbon nanotube prevents the scalable application on the battery. The second method is employing the high donor number solvent to achieve the solution phase Li2O2 growth.31 The third method is using catalysts in the
The solvents commonly used in Li-O2 battery were divided into two categories according to their donor number (DN), which is a measure of the ability of a solvent to solvate cations and Lewis acids. DN is defined as the negative enthalpy value for the 1:1 adduct formation between a Lewis base and the standard Lewis acid SbCl5 (antimony pentachloride), in dilute solution in the noncoordinating solvent 1,2-dichloroethane with a zero DN.
The oxygen reduction reaction shows different features in low and high DN solvents (Figure 1.2), namely, the solvent effect.31, 32 The low DN solvent like TEGDME, the Li+ is not strongly solvated by the solvent molecules. When O
2 was reduced to O2-, LiO2 forms on the electrode surface and quickly reduce to Li2O2 on the electrode surface. However, in the high donor number solvent like DMSO, the Li+ is well solvated, and LiO2 exist as Li+ cation and O2- anion in the solution phase instead of the electrode surface, results in Li2O2 grows in solution phase via a disproportionation reaction. The surface growth of Li2O2 in low DN solvent causes the discharge capacity below the 7 nm limit, namely, 1.9 μAh cm-2. While the solution-phase growth of Li2O2 in high DN solvent results in large discharge capacity and toroidal particle morphology for Li2O2, and break the 7 nm limit.
used low DN solvent in the present stage. The high DN solvent like DMSO was reported unstable to the active oxygen species. DMSO reacts with superoxide (O2) to DMSO2,33, 34 and DMSO also reacts with Li2O2.35 The poor stability makes it impossible to use in the Li-O2 battery, even in some fundamental research DMSO is still used as the solvent. Besides, many other solvent candidates like propylene carbonate (PC), dimethylformamide (DMF),36 are also proven to be unstable in the Li-O2 battery. A strong polar solvent, Hexamethylphosphoramide (HMPA), was reported to show good solubility to Li2O2 results in large discharge capacity and low charge overpotential.37 Regretfully, HMPA strongly reacts with lithium metal. Therefore, it needs a protective layer on the lithium metal surface and also needs last for a long time. Developing new solvents with excellent stability is an urgent research topic.38
1.2 The Development History of Redox Mediators for the Li-O
2Battery
Except for the solvent with high DN, which promotes the solution growth of Li2O2, soluble catalysts also can achieve this goal by changing the oxygen reduction pathway from the electrode surface to the electrolyte solution. A kind of soluble catalyst named as redox mediators were developed by the researchers to promote the discharge capacity and decrease the charge overpotential.39-42 Redox mediators show the redox-active property, which differs from those non-redox-active solid catalysts like Ru, RuO2, MnO2, and some other metal oxide compounds. The suitable reduction or oxidation potential facilitates reducing oxygen or oxidizing Li2O2. Here, the oxygen reduction redox mediator (ORRM) and oxygen evolution redox mediator (OERM) are noted in this thesis to distinguish these mediators for the charge and discharge processes.
In 2013, Owen et al. reported ethyl viologen redox couple, EtV2+/EtV•+, as a redox shuttle to reduce oxygen in the solution phase.43 Besides, they also found this redox shuttle could prevent the degradation of Li-O2 battery by reducing superoxide.44 The EtV2+ firstly reduces to EtV+ on the electrode. Then, EtV+ reduces oxygen to superoxide and further reduces superoxide to peroxide. Ethyl viologen cation is the prototype of
process for the Li-O2 battery.45
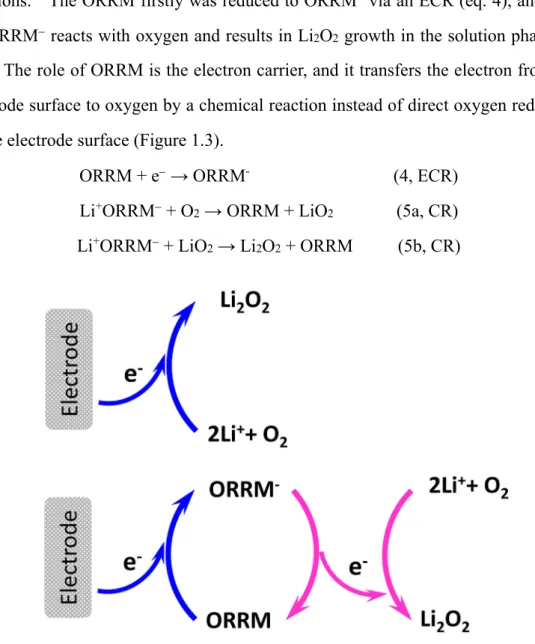
The general working mechanism of the ORRM is given as the following equations.46 The ORRM firstly was reduced to ORRM via an ECR (eq. 4), and then the ORRM reacts with oxygen and results in Li2O2 growth in the solution phase via eq. 5. The role of ORRM is the electron carrier, and it transfers the electron from the electrode surface to oxygen by a chemical reaction instead of direct oxygen reduction on the electrode surface (Figure 1.3).
ORRM + e → ORRM- (4, ECR) Li+ORRM + O2 → ORRM + LiO2 (5a, CR) Li+ORRM + LiO2 → Li2O2 + ORRM (5b, CR)
Figure 1.3 The scheme of mechanism for ORRM.
I concluded four general rules for the development of ORRM. Firstly, the ORRM should have proper redox potential. Secondly, the ORRM should be stable to the reactive oxygen species, like superoxide, oxygen singlet, and triplet. Thirdly, as a kind of soluble catalyst, the ORRM compounds must have good solubility in the electrolyte
The proper redox potential is the first and also the essential rule for the ORRM. The ORRM should have a positive reduction potential than oxygen in the actual battery system. Even the theoretical redox potential for Li-O2 battery is 2.96 V (O2/Li2O2), which is higher than the ORRM. However, the real oxygen reduction potential in the battery is much lower than this value because of the discharge overpotential. Therefore, the reduction potential of ORRM is positive than oxygen in the CV test; the reduction peak potential (Ep,c) for ORRM usually is higher than that of oxygen. This positive reduction keeps the reduction of ORRM before oxygen, which avoids the competition reaction between ORRM reduction and oxygen reduction. If electrochemical oxygen reduction and ORRM reduction occur as the same potential, the oxygen reduction on the electrode surface causes surface growth of Li2O2, which leads to low capacity also affects the ORRM reduction, leading to low efficiency for ORRM. In order to weaken direct oxygen reduction on the electrode surface, the positive reduction potential is required for ORRM design.
The active oxygen species decompose organic components in the electrolyte; therefore, ORRM should be stable to these species. In the first ten years, the carbonate-based electrolyte used in LIB was used in Li-O2 battery. The O2 is produced in the discharge process,47, 48 and it reacts with the solvent propylene carbonate via nucleophilic reactions yielding byproducts such as Li2CO3, LiOH, and HCO2Li rather than Li2O2.49-53 In addition, oxygen is released during the charge process, among them, the oxygen singlet (1O2) is the most active specie comparing with triplet oxygen.54 Stefan A. Freunberger et al. used operando detection to monitor the singlet oxygen in the Li-O2 battery cathode, and they found 1O2 would be responsible even for a small amount of side reactions.53 However, in the actual experiment, it is difficult to analyze the stability for ORRM to the 1O2 because of the high instrument requirement for most groups focusing on Li-O2 battery research.
As a soluble catalyst, solubility is the basic requirement for ORRM. Positive reduction for ORRM guarantees the priority of the reduction sequence on the electrode
the solution phase instead of on the electrode surface. This process results in the chemical oxygen reduction reaction occurs in the solution phase. Besides, the high solubility of ORRM offers a large exchange current via the eq. 4, which is the apparent discharge current density for the ORRM containing Li-O2 battery. Because the oxygen solubility in the aprotic electrolyte usually is very low (0.6 mM in 1M LiTFSI-TEGDME solution), it is challenging to offer large discharge current density.55 The highly soluble ORRM could give high concentration (tens of time than 0.6 mM) to maintain a large apparent discharge current.
As mentioned in the last rule of solubility for ORRM, the fast reaction kinetics between ORRM with oxygen is another crucial rule for ORRM to keep large discharge current. When the ORRM was introduced into Li-O2 battery, chemical oxygen reduction replaces the electrochemical oxygen reduction. The reduced specie ORRM must quickly react with oxygen and goes back to ORRM state to evolve the next mediate cycle. At the present stage, the reaction kinetics of ORRM and oxygen hasn't been systematically demonstrated, and the relationship between ORRM concentration and the discharge current density also has not been discussed. Even in my research, some qualitative conclusions can be given based on experimental results, but an understanding of the quantitative relationship still needs further study.
According to these general rules of ORRM, I summarized the reported ORRM and some compounds with a similar function, not a similar mechanism but as a soluble catalyst.
Tris(2,4,6-trichlorophenyl)methyl (TTM) radical was the reported ORRM, the reduced TTM anions facilitate the formation of Li2O2 away from the electrode surface with a certain distance.56 Ethyl viologen (EtV2+) was indicated as ORRM in a redox flow lithium-oxygen battery.43, 44 DBBQ was thought to mediate the oxygen reduction path via an intermediate LiDBBQO2, to form Li2O2 by chemical reaction or
type polyoxometalate α-SiW12O404- was first reduced to α-SiW12O405- which is reducing enough to complete the mediating oxygen reduction via a chemical reaction.63 Another inorganic polyoxometalate compound, cobalt-based polyoxometalates (Co-POMs), was reported as a bifunctional redox mediator for both oxygen reduction and evolution process.64
Phenol,65 a protic compound, worked as a phase-transfer catalyst to dissolve the Li2O2 on the electrode surface and recrystallized Li2O2 in the solution phase, enhancing the discharge capacity. The operation mechanism of phenol is different from ORRMs; strictly, it is a phase-transfer catalyst rather than an ORRM because it does not undergo redox during the working process. Another phenolic antioxidant of 2, 6-di-tert-butyl-hydroxytoluene (BHT), also contributes to improving the oxygen reduction via the mediating process.66
Oxygen evolution redox mediators (OERMs) were developed to reduce the charge overpotential. In the presence of OERM, it was oxidized on the electrode surface, and then the oxidation reacts with Li2O2 from the solution phase via the chemical reaction instead of the electrochemical reaction. These reported OERMs contain two categories, organic molecules, and inorganic molecules. TTF,45 TDPA,67 TEMPO,68 DMPZ;69 MPT,70 some other nitroxyl and amines organic molecular OERMs71, 72 are organic molecules. The inorganic OERMs include lithium halide, LiBr,73-75 LiI,5, 76, 77 LiNO
3, 78-80 metal coordination compounds, FePc (Pc: phthalocyanine),81 Ferrocene,71, 82 Co(Terp)2 (Terp: bi(terpyridine)).83 Besides, some metal oxide catalysts, such as MnO2, RuO2,84 also display catalytic effect, but they are not OERM in a standard sense.
Even many OERMs are developed, these compounds also have their problems, such as stability and decomposition as high voltage and side reactions with electrolyte solvent. There is still a need to develop new and more efficient catalysts.
1.3 Water Effect on Li-O
2Battery
be involved in the different electrode reactions for the Li-O2 battery. Therefore, it needs to consider the parasitic reactions caused by these components.
Gasteiger et al. reported the effect of water on the discharge capacity for the Li-O2 battery with a non-catalyzed carbon cathode in the DME electrolyte for the first time.85 They found that the discharge capacity was improved after the introduction of water into Li-O2 cells and that the discharge plateau also became higher at the same time. They attributed the higher discharge plateau to the reaction between lithium metal with oxygen and water to form LiOH (4Li+2H2O+O2→4LiOH), which has a higher theoretical potential about 3.35 V comparing with the O2/Li2O2 (2.96 V).
In the following time, more and more papers focusing on the water effect for the Li-O2 battery are published with a much-advanced understanding of the role of water. K. Zaghib et al. used the impedance method to analyze the water effect. Except for increasing the discharge capacity and improving discharge voltage, they found that impedance and weight increase after 1st discharge in the presence of water.86 They concluded that the weight increase comes from the reaction product between Li and water, LiOH.
In many cases, LiOH was detected by the XRD measurement after discharge. As for the LiOH comes from the chemical reaction between Li and water or the electrochemical reaction 4Li+2H2O+O2→4LiOH. Alan C. Luntz and co-workers used differential electrochemical mass spectrometry (DEMS) to check the ratio between the electron and the number of oxygen molecules.87 If the LiOH comes from the electrochemical reaction, the ratio of e/O2 should be around 4. They got the value around 2, which means the Li2O2 still is the dominant discharge product. And the LiOH may come from the reaction between Li and water or the reaction between Li2O2 and water.
an opposite conclusion that the LiOH formation increases the charge overpotential in the presence of water. Besides, Zhou et al. reported that in the presence of water, HO2 -is the new intermediate instead of O2, which suppresses the O2 induced side reactions.91 Studies undertaken so far have corroborated that water additives in electrolyte promote Li2O2 formation via a solution mechanism, resulting in increased capacity through toroid formation. Even some advanced understanding of the water effect has been revealed,92 it still needs further investigation into the mechanisms for the role of water on discharge on the charging process.
1.4 Target of this Dissertation
Li-O2 battery attracted a lot of attention in the past two decades as the growing demand for clean energy. Even it possesses a large specific energy density up to 3458 Wh kg-1, the insulated discharge product Li2O2 makes it challenging to achieve its theoretical value. Therefore, to improve the discharge capacity becomes an urgent research topic in this field. My research focuses on a kind of soluble catalyst, ORRM, design and synthesis to improve the discharge capacity. The objective is to improve the discharge capacity by employing the ORRM and explore the structure-property relationship. The main research objectives of this thesis are listed as follows.
Chapter 2
1. Understand the general rules to develop a new ORRM.
2. To improve the catalytic performance via the further structural design to control the reduction potential shift of ORRM.
3. To show the effect of water content in the oxygen to the discharge process and the synergistic effect between ORRM and water.
Chapter 3
4. To verify the discharge behavior on graphitic carbon material and non-graphitic carbon material.
1.5 Dissertation Organization
This dissertation contains five chapters written with the following arrangements. Among them, chapter 2 is the primary part of this thesis. Chapters 3 and 4 also are essential parts of my research, but the content of these two chapters doesn't show in the title of the dissertation because of the fixed dissertation title.
Chapter 1 introduces the general background of Li-O2 battery. In this section, the working mechanism of ORRM, the selection rule of ORRM, and the development history of ORRM are briefly reviewed. Also, the water effect on the Li-O2 battery is introduced. In the last, the purpose of my research and the thesis organization are also stated.
Chapter 2 is the first and main topic of the dissertation. Firstly, the AQ-based ORRM structure design strategy is explained, and the substitute effect on the reduction potential is clearly shown. The correlation between the reduction of ORRM and its catalytic performance is studied. Besides, I also explore the synergistic effect of ORRM and water, which can further improve the discharge capacity than the presence of both alone.
Chapter 3 shows the different discharge product growth behavior on graphitic carbon material and non-graphitic carbon material. The discharge product could intercalate into the interlayer of graphite, results in the graphene exfoliation.
Chapter 4 summarizes the side reactions in the DMSO based electrolyte, and the electrolyte volume induced the Raman test results differences. Decreasing the quantity of electrolyte could get clear information than a similar condition with massive
Chapter 2 AQ-based ORRM Structural Design and its Catalytic
Behaviors
2.1 Design Strategy for the ORRM
No matter for the ORRM or OERM, which plays the role of the electron carrier and deliver the electron between the electrode and oxygen/Li2O2 in their working process. Therefore, both of them need a proper redox potential range to finish their task. When this first pre-requisite is met, then stability, solubility, and reaction kinetics would be considered in the following selection. In general, an excellent ORRM should have positive reduction potential than that of oxygen in the actual battery system, superior stability to nucleophilic oxygen species, high reaction rates between ORRM and oxygen, and good solubility in the electrolyte solution. Hence, the structural design strategy is one of the reliable approaches to obtain a suitable ORRM. The substituent modification meets all the requirements to design an excellent organic ORRM.
Anthraquinone (AQ), a side reaction product from reduced anthrone with oxygen species, was found as a good candidate as ORRM, because its one-electron reduction potential is close to oxygen reduction potential, and it is stable to oxygen species. However, a distinct disadvantage of AQ is that its redox potential is slightly negative than that where oxygen is reduced.
The reduction potential of AQ restricts its promotion capability as an ORRM because of the competition reaction between the AQ reduction and oxygen reduction on the electrode surface in the same potential range. To overcome this problem, I designed a series of AQ-based derivatives with a reduction potential positive than that of AQ. Based on this idea, I introduced various function groups, including phenyl, halogen (Cl, F), nitrile (CN), and nitro (NO2), onto the AQ with varying numbers of substituents or at different positions. The introduction of electron-withdrawing groups (EWG) onto the AQ molecule moves the reduction potential to the more positive region. In contrast, adding electron-donating groups (EDG) onto the AQ inversely move its
derivatives were employed to systematically evaluate their electrochemical reduction potentials as well as their capabilities and stabilities as an efficient ORRM. I can get a continuous change in the reduction potential of the AQ derivatives in the study.
Therefore, a series of AQ derivatives (Figure 2.1), 6,13-Pentacenequinone (PQ), 5,12-Naphthacenequinone (NAQ), 1-Chloroanthraquinone (MClAQ), 1,5-Dichloroanthraquinone (DClAQ), (MCAQ)Nitroanthraquinone (MNAQ), 1-Cyanoanthraquinone (MCAQ), 1,5-Dicyanoanthraquinone (DCAQ), 1,5-Dinitroanthraquinone (1,5-DNAQ), 1,8-1,5-Dinitroanthraquinone (1,8-DNAQ) were designed and synthesized some of them to achieve the desired potential.
Figure 2.1 Structures of AQ and its derivatives.
2.2 Materials and Methods
2.2.1 Materials
Tetraethylene glycol dimethyl ether (TEGDME, Wako pure chemical industries, LTD.) was distilled under vacuum by sodium and benzophenone, and detailed procedures were shown in the next part. Lithium bis(trifluoromethanesulfonyl)imide (LiTFSI, Wako pure chemical industries, LTD.) was dried under 150 °C under vacuum
dried at 150 °C under vacuum for 24 hours before use.
Oxygen and Argon gas were used directly from the gas company without special treatment with a dew point temperature of -75°C (water: 1.2 ppm) according to the factory test result. Two oxygen gloveboxes (UNICO) were used, and one of them equipped with a water removal system that can keep water content at 0.2 ppm, another just filling oxygen gas without any water removal system (RH: 5-6%). Water and oxygen in Ar glovebox are <1ppm and <10 ppm, respectively.
6,13-Pentacenequinone (PQ), 5,12-Naphthacenequinone (NAQ), anthraquinone (AQ), 1-Nitroanthraquinone (MNAQ), 1-chloroanthraquinone (MClAQ) and 1,5-Dichloroanthraquinone (DClAQ) were obtained from TCI (Tokyo Chemical Industry CO., LTD). And, 1,5-Dinitroanthraquinone (1,5-DNAQ), 1,8-Dinitroanthraquinone (1,8-DNAQ) from Aldrich. 1-Cyanoanthraquinone (MCAQ) and 1,5-Dicyanoanthraquinone (DCAQ) were synthesized and characterized by ourselves, and the detailed process was shown in the following section. All the reagents were stored in the Ar atmosphere glovebox (Lab Star).
2.2.2 Synthesis and Characterization of DCAQ and MCAQ
DCAQ: 1,5-dichloroanthraquinone (1.0 g, 3.6 mmol) and Cu(I)CN (1 g, 11 mmol) were
dispersed in n-methyl pyrrolidinone (NMP) (50 ml) and heated to 180 °C under argon for 6 hours. The hot dark brown solution was poured onto ice (300 g), and the brown precipitate was filtered, washed with water and dried under vacuum. The precipitate was decomposed with 4 M nitric acid (100 mL) at 60 °C for 4 hours. The resulting brown solid was filtered, washed with water and dried, and then recrystallized with phenylacetonitrile, obtaining brown needle crystals of 1,5-dicyanoanthraquinone (DCAQ) (0.64 g, 67 %). Mass spectroscopy was used to confirm the molecular weight (Fig. S4). MS (EI) m/z: 281 (DCAQ+Na 100%). Elemental analysis (EA) : calc.: C: 74.42%, H: 2.34%, N: 10.85; exp.: 74.390%, H: 2.362%, N: 10.689%.
Figure 2.2 Synthesis procedures of DCAQ.
MCAQ: 1-chloroanthraquinone (1.0 g, 4.1 mmol) and Cu(I)CN (0.51 g, 5.7 mmol)
were dispersed in n-methyl pyrrolidinone (NMP) (50 mL) and heated to 180 °C under argon for 6 hours. The hot dark brown solution was poured onto ice (300 g), and the brown precipitate was filtered, washed with water and dried under vacuum. The precipitate was decomposed with 4 M nitric acid (100 mL) at 60 °C for 4 hours. The resulting brown solid was filtered, washed with water and dried, and then recrystallized with phenylacetonitrile, obtaining light brown needle crystals of 1-cyanoanthraquinone (MCAQ) (0.54 g, 56 %). Mass spectroscopy was used to confirm the molecular weight (Fig. S5). MS (EI) m/z: 256 (MCAQ+Na 100%). EA : calc.: C: 77.25%, H: 3.03%, N: 6.01%; exp.: 77.322%, H: 3.022%, N: 5.999%.
2.2.3 Instrumentation and Methodology
TEGDME distillation procedures: TEGDME solvent was purified via
distillation by the Schlenk tube technique (Figure. 2.6) because the solvent purity will affect battery performance.51 Remove the kerosene on the sodium metal surface with paper and cut it into small pieces for use. Sodium (1.5 g) and 9 g of benzophenone were put in a 1000 mL flask containing 500 mL TEGDME. All of this process was finished in the Ar glove box to avoid sodium exposure to water and oxygen. Then take the flask out of the glovebox and connect to the distillation system, vacuum the system, and increase the temperature of the oil bath. Please note, the temperature setting is increased by 10°C during the initial heating process, and the increment is adjusted to 2°C when it approaches the boiling point. The final boiling temperature depends on the vacuum degree of the distillation system. Adjust the stirring speed to control the collection rate of the distillate to one to two drops per second. After the distillation fills in dried Ar into the schlenk flask contains TEGDME and disassembles it from the distillation system under continuous Ar gas flow and seal it by glass stopper. Then transfer the flask to the Ar glove box. Please note that more moderate water scavenger calcium hydride can also be used in this step.
three to four days. The final water content is below 10 ppm.
The water content measured by Kari Fischer Moisture Titrator (MKC-710). All the results were the average value of three times of measurement values.
Molecular sieves activation procedure: Molecular sieves firstly were washed by
acetone and dried to remove the solvent, then put them in the oven and dried at 500 °C for 12 h, then transfer to a Schlenk flask further dried under vacuum at 180 °C for 12 h. After drying, filling Ar in the flask to balance the pressure and transferring it to the Ar glove box.
Battery test: A three-electrode system is used in an H type glass tube with a glassy
carbon (d = 6 mm) as the working electrode and metallic lithium wrapped on the nickel wire as counter and the reference electrode. Cyclic voltammetry (CV) was performed by POTENTIOSTAT/GALVANOSTAT 2020 (TOHO TECHNICAL RESEARCH). 4 mL 0.5 M LiTFSI-TEGDME solution in an H type glass tube cell with or without ORRM was used in the CVs experiments. Discharge curves were measured by the Neware battery (5V-50mA) test system using coin cells (Neware Technology Limited Shenzhen, China). For the coin cell test, 0.1 mL 0.5 M LiTFSI-TEGDME solution with or without ORRM was used as the electrolyte solution. CR-2032 coin cell with air holes on the cathode cap was employed to evaluate the discharge (Figure 2.7) performance for the Li-O2 battery in the O2-filled glove box with two different water content environments (0.2 ppm or RH 5-6%: 1200-1500ppm). Three pieces of carbon paper (Freudenberg H23) with a diameter of 8 mm were stacked together as the cathode and dried at 150 °C under vacuum for 24h before use. A piece of lithium foil (15mm, 0.45 mm) was used as the anode. The separator was a Whatman glass microfiber filter (GF/A). A piece of nickel foam was placed on top of the cathode as the current collector. The coin cell component was dried at 80 for 24h and transferred to Ar glovebox. A pressure of 1000 psi was applied to the coin cell by a sealing machine (Tianjin BOJUN Science and Technology Co., Ltd., China).
Figure. 2.7 Coin cell structure.
SEM characterization: The Hitachi SU-70 Analytical Field Emission Scanning
Electron Microscope (SEM) was used to observe the surface morphologies of carbon paper and discharge product lithium peroxide. After discharge, the cell was disassembled in the Ar glove box. Firstly, remove the electrolyte solution in the cathode (carbon paper) by kimwiper, and then wash with a little DME and remove solvent with kimwiper, repeat this procedure for three times. All the washed cathode was then transferred into the Schlenk flask and dried under vacuum. After drying, the Schlenk flask was filled in dry Ar and then moved them to the Ar glove box before the SEM test. During the SEM measurement, prepare the sample as soon as possible to avoid the carbon paper contact with air for a long time.
Raman and IR characterization: HORIBA XPLORA PLUS RAMAN
MICROSCOPE measured Raman Spectroscopy of discharge electrodes with LabSpec6 workstation under 10 mW laser power at 532 nm. IR spectroscopy was carried out by spectrum two (PerkinElmer) with ATR mode in Ar glovebox.
solution after discharge.
Firstly, disassemble the coin cells and pick up the separator, then put them in a small glass vial. Usually, at least 4 pieces or more of separators were used because each piece soaks a little electrolyte solution (60-80 mg). Secondly, add some fresh TEGDME solvent (m2) contains a certain water content (A1). Thirdly, keep the mixture solution in the glovebox for 10 h. Last, measure the water content of the mixed solution (A2) by Karl Fischer titrator. The water content in the final electrolyte was set as 𝑥 ppm, and the following equation was used to calculate the water content in the electrolyte after discharge.
𝑚 10 𝑚 10 𝑚 10 𝑚 10 𝑥 ? ppm
Setting: unit of m is g, and for A and 𝑥 is ppm
m1: the weight of electrolyte soaked in separators, 𝑥: water content in them;
m2: the weight of added fresh TEGDME, A1: water content in it; please note that A1 should be larger than 10 ppm because small A1 always causes a significant deviation. Therefore, 33.4 ppm pure TEGDME was used to dilute the electrolyte solution in the separators.
Table 2.1 Water content after discharge showed in the following table, and time means the time of battery stays in the corresponding atmosphere, including discharge time and shelving time on purpose.
H2O in O2 RH 5-6% RH 5-6% RH 5-6% RH 5-6% 0.2ppm separators+ electrolyte 0.4748 0.6275 0.3014 0.5607 0.321 separators 0.0642 0.0856 0.0428 0.0855 0.0428 electrolyte: m1 0.4106 0.5419 0.2586 0.4752 0.2782 TEGDME: m2 4.1873 4.0684 4.075 4.0526 4.028 H2O in TEGDME:A1/ppm 33.40675 33.40675 33.40675 33.40675 33.40675 H2O in mixture: A2/ppm 65.1224 80.028 73.7193 185.8748 33.7891 𝑥/ppm 388.5 430.0 708.9 1486.1 39.3 time/h 17 25 48 79 148 average speed: ppm/h 22.3 16.8 14.6 18.7 0.2
The rate of water increase varies from 14.6 to 22.3 ppm/h in high water content oxygen because of the humidity change day by day within a range (RH: 5-6%, 1200-1500 ppm). While for the controlled ones after discharge and keep in the glove box for a long time, the water content just has a slight increase but still less than 40 ppm.
2.3 Results and Discussion
2.3.1 CVs of AQ and its Derivatives.
To check the reduction potential of the ORRM, the electrochemical redox behaviors of these AQ-based compounds were evaluated by cyclic voltammetry (CV). CV of AQ under Ar exhibits a reduction peak around 2.27 V due to one-electron AQ reduction (Figure 2.8c, blue line). The reduction peak of AQ is overlapping with the oxygen reduction peak (2.17 V, Figure 2.8c, black line). The overlapping of the reduction potential between AQ and oxygen causes an electrochemical competition reaction on the electrode surface in the overlapped range.
In the TEGDME (low DN solvent) based electrolyte solution, oxygen reduction inclines to surface mechanism, which results in surface growth of Li2O2. Electrochemical oxygen reduction product Li2O2 covering on the electrode surface will further block oxygen and AQ reduction. Only the reduced AQ, AQ, promotes to reduce oxygen and leads to solution-phase growth of Li2O2. Therefore, direct oxygen reduction via the electrochemical process should be avoided as much as possible. Thus, electrochemically reduce AQ before oxygen reduction is an essential issue to improve the efficiency of ORRM.
Figure. 2.8 (a, b) Cyclic voltammograms of AQ and its derivatives in 0.5 M LiTFSI inTEGDME under Ar (blue), O2 (red) and pure O2 (black) reduction without additives on glassy carbon electrode; (a) PQ (s); (b) NAQ (s). Notably, s means the saturated solution (less 5 mM) was used for these compounds.
Figure. 2.8 (c, d) Cyclic voltammograms of AQ and its derivatives in 0.5 M LiTFSI inTEGDME under Ar (blue), O2 (red) and pure O2 (black) reduction without additives on glassy carbon electrode; (c) AQ (10 mM); (d) MClAQ (10mM). Notably, s means the saturated solution (less 5 mM) was used for these compounds.
Figure. 2.8 (e, f) Cyclic voltammograms of AQ and its derivatives in 0.5 M LiTFSI inTEGDME under Ar (blue), O2 (red) and pure O2 (black) reduction without additives on glassy carbon electrode; (e) DClAQ (s); (f) MNAQ (10 mM). Notably, s means the saturated solution (less 5 mM) was used for these compounds.
Figure. 2.8 (g, h) Cyclic voltammograms of AQ and its derivatives in 0.5 M LiTFSI inTEGDME under Ar (blue), O2 (red) and pure O2 (black) reduction without additives on glassy carbon electrode; (g) MCAQ (10 mM); (h) DCAQ (s). Notably, s means the saturated solution (less 5 mM) was used for these compounds.
Figure. 2.8 (i, j) Cyclic voltammograms of AQ and its derivatives in 0.5 M LiTFSI inTEGDME under Ar (blue), O2 (red) and pure O2 (black) reduction without additives on glassy carbon electrode; (a) PQ (s); (b) NAQ (s); (c) AQ (10 mM); (d) MClAQ (10mM); (e) DClAQ (s); (f) MNAQ (10 mM); (g) MCAQ (10 mM); (h) DCAQ (s); (i) 1,5-DNAQ (s); (j) 1,8-DNAQ (10 mM). Notably, s means the saturated solution (less 5 mM) was used for these compounds.
Substitute group modification strategy succeeded in moving the AQ one-electron reduction peak to a negative potential by adding the weak electron-donating group (EDG). Phenyl substituted compounds NAQ and PQ show negative reductional than
(EWG), chloride, cyano, and nitro groups were introduced to AQ, all the reduction potential of these derivatives move to a positive position to some extent. Setting AQ as a reference, one and two phenyl groups contribute to -0.07 V and -0.16V negative shift, respectively. Mono- and di-chloride substituted AQ have 0.05 V and 0.06 V positive effects on the reduction potential. While strong EWG, CN, contributes to a more positive shift, 0.17 V and 0.29 V related one and two groups. Another triangle-shape strong EWG, nitro has 0.1 V positive influence for one group and about 0.3 V positive shift for two nitros.
When two NO2 groups are added to AQ, 1,8-DNAQ (Figure 2.8j) and 1,5-DNAQ (Figure 2.8i) show the reduction potential at 2.59 V in the Ar-saturated solution. The reduction potentials move to the more positive potential region in comparison to that of O2 in the TEGDME electrolyte. The positive shift of the reduction potential is 0.32 V comparing with AQ. With the increase of the reduction potential of AQ derivatives, the overlapping area between the black curve and the blue curve becomes less and less in the CV curves. This means electrochemical oxygen reduction is weakened during the ORRM reduction, avoiding the surface growth of Li2O2 as much as possible. The DNAQ included Li-O2 batteries show a typical CV curve features with ORRM. Take 1,8-DNAQ as an example, the black curve represents electrochemical oxygen reduction on the electrode surface. The blue curve and red curve mean electrochemically reduction of 1,8-DNAQ under Ar and O2, respectively. However, the reduction peak current under oxygen (red curve) is about three times compared with that under Ar (blue curve). This mainly due to the chemical oxygen reduction reaction between 1,8-DNAQ and O2, allowing the 1,8-DNAQ back to the oxidation state 1,8-DNAQ and further involving another cycle of 1,8-DNAQ reduction.
Expect for the reduction potential changes, the effect of the substituent on the solubility also was traced by comparing their position, numbers, and type. The
Figure 2.9 (a) The scheme of Ep,c, Ep,a, of ORRM, and Eeq of O2/Li2O2. (b) The overpotential of Li-O2 battery on the discharge. (c) The potential difference (ΔE) between the equilibrium potential of Li-O2 battery and the Ep,a of ORRM. (d) ΔEp,c between AQ and its derivatives, the reduction potential of AQ sets as zero point.
Figure 2.9 (a) The scheme of Ep,c, Ep,a, of ORRM, and Eeq of O2/Li2O2. (b) The overpotential of Li-O2 battery on the discharge. (c) The potential difference (ΔE) between the equilibrium potential of Li-O2 battery and the Ep,a of ORRM. (d) ΔEp,c between AQ and its derivatives, the potential of AQ sets as zero point.
The correlation between the reduction potential of ORRM and discharge overpotential is summarized and analyzed in Figure 2.9. A typical CV of
reduction-scan towards the upper value until it reaches the upper limit. The reverse reduction-scan provides the oxidation peak potential (Ep,a) and oxidation current (ip,a). Formally, the average value (E1/2) of Ep,c and Ep,a is the redox potential.
The points in the curve are the Ep,c value of ORRMs, and oxygen (Figure 2.9b). When the ORRM is employed, the discharge plateau of ORRM replaces the electrochemical oxygen reduction potential plateau. The Ep,c of ORRM, is higher than the actual Ep,c of oxygen in the battery system. Therefore, the battery discharge plateau is close to the theoretical value 2.96 and decrease the discharge overpotential for Li-O2 battery containing ORRM with positive Ep,c value. That's why this paper design the AQ structure and move the Ep,c close to 2.96 V.
The reaction between ORRM and O2 is the essential step for ORRM in the whole catalytic process. Generally, the ΔE determines the reaction rate of the chemical reaction of 2ORRM− + O2 + 2Li+→ Li2O2 + 2ORRM. Therefore, the PQ has the biggest
ΔE, which means the PQ would react O2 fast than that of DNAQ. However, the DNAQ has better performance than PQ as ORRM, and even the ΔE is smaller than PQ. Because DNAQ has higher than Ep,c than PQ, therefore, competition reaction between electrochemical DNAQ reduction and electrochemical O2 reduction is reduced. Electrochemical O2 reduction, the key reason for the small discharge capacity of Li-O2 battery, is avoided/reduced in the presence of DNAQ, and large discharge capacity is obtained. In conclusion, it needs a balance between the Ep,c (high discharge plateau), and Ep,a (reaction rate between ORRM and O2 ) in the selection of ORRMs. Therefore, it was found that 1,5-DNAQ is the best ORRM in this AQ derivatives series, even its solubility is not as well as 1,8-DNAQ.
ΔEp,c between AQ and its derivatives is shown in Figure 2.9d. The Ep,c of AQ, was set as the zero. It shows the contribution of the amount of substitute group, type, and position to the Ep,c shift of AQ derivatives. The detailed data is shown in Table 2.2.
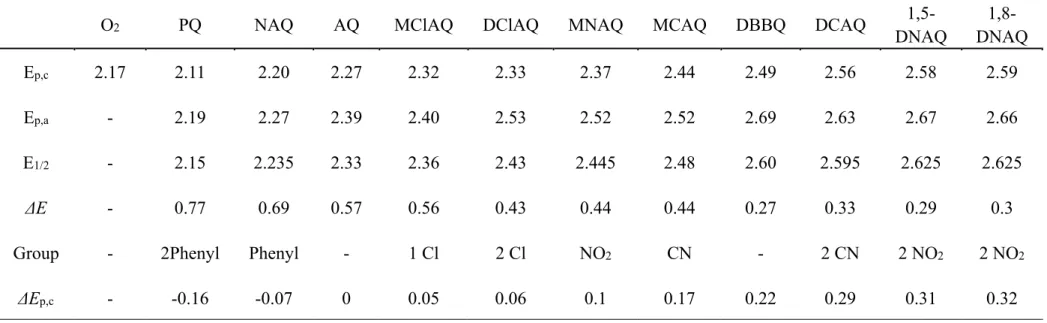
Table 2.2 The reduction (Ep,c) and oxidation peak potential (Ep,a) of ORRMs under Ar collected from CV curves were summarized in the first two
rows. E1/2 is the average value of Ep,c, and Ep.a. ΔE is the potential difference between the equilibrium potential of Li-O2 battery and the Ep,a of
ORRM. ΔEp,c is Ep,c difference between AQ and its derivatives.
O2 PQ NAQ AQ MClAQ DClAQ MNAQ MCAQ DBBQ DCAQ
1,5-DNAQ 1,8-DNAQ Ep,c 2.17 2.11 2.20 2.27 2.32 2.33 2.37 2.44 2.49 2.56 2.58 2.59 Ep,a - 2.19 2.27 2.39 2.40 2.53 2.52 2.52 2.69 2.63 2.67 2.66 E1/2 - 2.15 2.235 2.33 2.36 2.43 2.445 2.48 2.60 2.595 2.625 2.625 ΔE - 0.77 0.69 0.57 0.56 0.43 0.44 0.44 0.27 0.33 0.29 0.3
Group - 2Phenyl Phenyl - 1 Cl 2 Cl NO2 CN - 2 CN 2 NO2 2 NO2
2.3.2 Catalytic Behaviors
CR 2032 type coin cells with air holes on the cathode cover were used to test the enhancement of Li-O2 batteries discharged with ORRMs. Water content both in the electrolyte solution and oxygen gas were critically controlled at a low level. Water content in the electrolyte solution was controlled below 10 ppm by multi-methods. All the batteries were discharged in an oxygen glovebox (under 1 atom of O2) equipped with cycling equipment to remove the water in the oxygen, keeping the water in oxygen gas at 0.2 ppm. The water content in the electrolyte after discharge below 40 ppm and the average increment is 0.2 ppm/h (Table 2.1).
Figure. 2.10 Discharge curves of Li-O2 batteries with and without ORRMs at a current density of 0.1 mA cm-2 on the H23 carbon paper (three pieces stacking together) electrode, only one profile approach to the average value shown in table 2.3 was selected. One-electron reduction potential was chosen as the cutoff voltage, and 2.2 V was used to adapt to all ORRMs.
Table 2.3 Batteries capacity discharged at low water content oxygen glovebox (0.2 ppm). The reduction peak potential of ORRMs under Ar (Ep,c)
and O2 (Ep,c) collected from CV curves were summarized in the first two rows. The concentration was given in the third row. Discharge current
density was 0.1 mA cm-2, and an averaged value was used to present the discharge capacity (C. mAh cm-2). The yields of the discharge product
were obtained through the UV titration method. T is the enhancement of the discharge capacity comparing with the pure Li-O2 battery.
O2 PQ NAQ AQ MClAQ DClAQ MNAQ MCAQ DBBQ DCAQ
1,5-DNAQ 1,8-DNAQ Ep,c ,Ar 2.17 2.11 2.20 2.27 2.32 2.33 2.37 2.44 2.5 2.56 2.58 2.59 Ep,c ,O2 - 2.25 2.28 2.38 2.36 2.35 2.50 2.49 2.40 2.56 2.58 2.60 C. / mM S 5 (s) 5 (s) 20 20 20 (s) 20 20 (s) 20 5 (s) 5 (s) 20 C./mAh cm-2 0.05 0.01 0.08 0.01 0.10 0.01 0.19 0.01 0.41 0.02 0.45 0.02 0.76 0.02 1.11 0.04 2.19 0.04 0.15 0.01 1.16 0.05 2.23 0.01 Y /% - - - 64.7 54.7 58.6 44.5 - 40.1 52.5
The reduction potential of ORRM dominates the discharge capacity and discharge voltage. In the presence of ORRMs, Li-O2 batteries all exhibit larger capacity than that without ORRM due to the solution mechanism oxygen reduction promoted by ORRMs (Figure 2.10, Table 2.3). Batteries discharge with AQ, the capacity shows about 4 times increase, while for 1,8-DNAQ, the capacity has around 45 times growth, which is comparable with DBBQ. Some battery capacities have a limit increase because those ORRMs have a broad overlapping reduction range with oxygen, resulting in competition reactions between ORRM reduction and oxygen reduction. With the rise of the reduction potential of ORRMs, the discharge capacity increases because direct oxygen reduction on the electrode surface is reduced. Besides, the efficiency of ORRMs was restricted by their solubility. 1,5-DNAQ and 1,8-DNAQ have similar reduction potential, while the meditating performance of the latter is better than the former mainly attribute to the solubility of 1,5-DNAQ.
The discharge plateau also becomes higher and higher due to the rise of the reduction potential of each ORRM (Figure. 2.10). 1,8-DNAQ has a positive reduction potential than any other ORRMs in the table even for DBBQ; therefore, its discharge plateau (2.75 V) is higher than the all. When an ORRM was employed in the Li-O2 battery, the oxygen reduction mechanism was changed. Oxygen was indirectly reduced by a chemical route via the reaction between ORRM and oxygen. And, the battery discharge plateau changed to ORRM's reduction plateau rather than the oxygen reduction plateau. Therefore, the high reduction potential of ORRM leads to a high discharge plateau in the Li-O2 battery. Due to the reaction between ORRM and oxygen, the ORRM reduction capacity was significantly increased than its self-discharge (0.054 mAh) under Ar.
Figure. 2.11 SEM images of the pristine carbon electrode and discharged cathode with and without ORRMs in a low water content oxygen atmosphere (0.2 ppm) for all the tested ORRMs. Scale bar (2 μm), magnification, and voltage are showed at the bottom of each figure with the name of the corresponding ORRM.
The surface morphologies of discharged cathodes were observed by scanning electron microscope (SEM). The pristine carbon fibers' surface is clean and has a clear trench structure (Figure 2.11). Discharge without ORRMs, the discharge product Li2O2 exhibits a thin-film structure covered on the carbon fiber surface. For the ORRMs containing batteries, the morphology of Li2O2 shows different features with the battery discharged without ORRMs. For the ORRM, like PQ and NAQ, the cathode surface shows the small difference with the ORRM free cathode, while for the ORRM with a high reduction potential, the surface image of the carbon fibers has changed. Take AQ
reduction mechanism changes from surface path to the solution path.
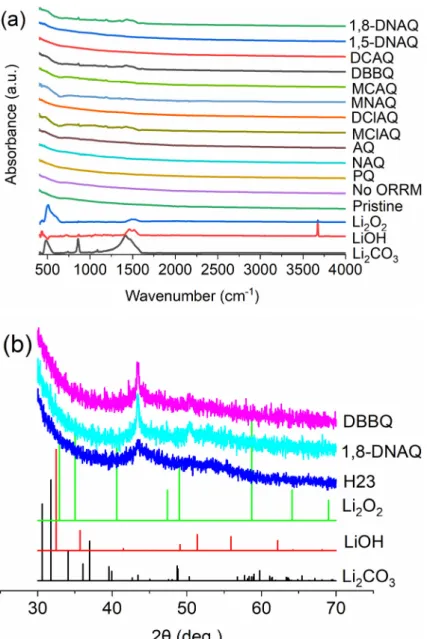
Figure 2.12 (a) IR spectroscopy of discharge cathode under low water content. (b) The XRD results of the cathode discharged with 1,8-DNAQ and DBBQ under low water content oxygen (0.2 ppm). Except for the signal from the carbon (H23), there doesn't have any signal for discharge product or sider reaction product.
The low discharge capacity restricts the characterization of the batteries discharged in the low water content environment, only a little information obtained from IR (Figure 2.12a), almost no signal was detected from the XRD measurements (Figure 2.12b). The IR did not observe LiOH. The yield of Li2O2 also was found to be lower than those discharged in the high water content oxygen.
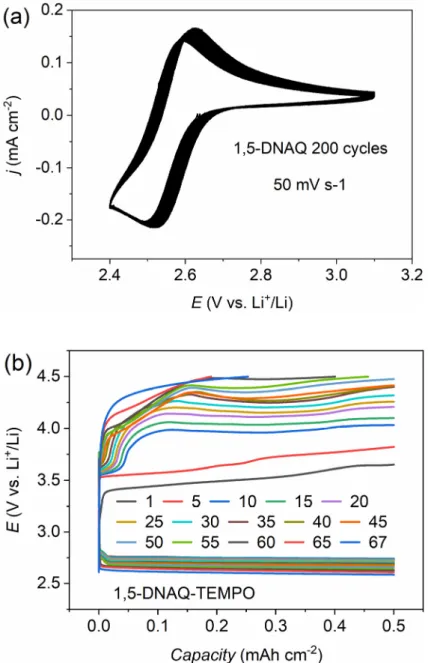
Figure 2.13 (a) The 200 cycles CV curves of 10 mM (suspension solution) 1,5-DNAQ in 0.5 M LiTFSI-TEGDME electrolyte on a glassy carbon electrode with a scan rate of 50 mV s-1, the volume of electrolyte in each CV test is 5 mL. (b) Cycle performance of Li-O2 battery with ORRM (1,5-DNAQ, 10 mM suspension solution) and OERM (TEMPO, 30 mM) with a current density of 0.1 mAh cm-2, lithium metal is used as the anode. Batteries discharged in the pure oxygen with the water content of 0.2 ppm.
of 1,5-DNAQ has a little negative shift due to the reference potential shift caused by the reaction between 1,5-DNAQ and lithium metal because the passive layer on the lithium metal was destroyed when it was wrapped on the nickel wire as counter and reference.
The charging process with OERM also is checked, even it is not the primary research purpose here. Take 1,5-DNAQ-TEMPO as an example, it achieves over 60 cycles of discharge and charge process (Figure. 2.13b). Only in this dual RMs case, the cell works due to low solubility of 1,5-DNAQ; however, in the cases of 1,8-DNAQ-TEMPO or DBBQ-1,8-DNAQ-TEMPO system, the cycle test failed due to the side reactions induced by lithium metal. Therefore, many reported DBBQ-TEMPO dual RM systems; the LiFePO4 was used as the counter electrode. The cycled for around 67 cycles with a limited capacity of 0.5 mAh cm-2, and about 50 cycles show a hundred percent Coulombic efficiency. The high charge voltage causes structure damage for the organic molecular ORRM and OERM results in the charge voltage improved with cycles.
2.3.3 Concentration Effect of ORRM on the Discharge Capacity
In the series AQ-based ORRMs, 1,5-DNAQ and 1,8-DNAQ have similar redox potential, while the mediating performance has a noticeable difference. The capacity discharged with 1,5-DNAQ is half to that with 1,8-DNAQ due to the concentration difference.
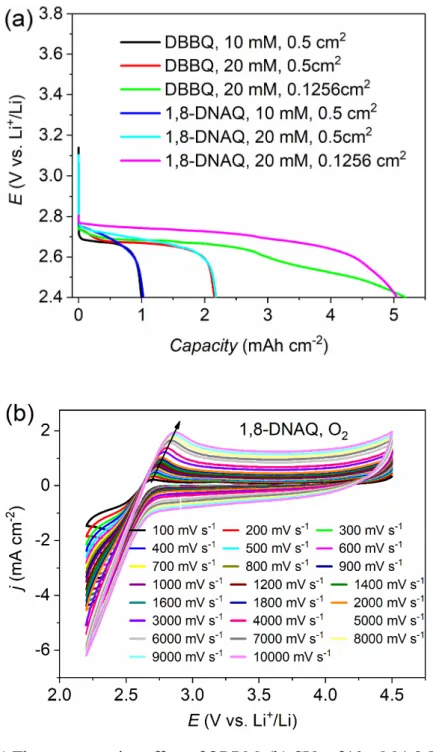
This phenomenon should be attributed to the concentration effect of ORRMs on battery discharge capacity.93 Take DBBQ and 1,8-DNAQ as an example; the battery capacity rises with the concentration increase (Table 2.4, Figure 2.14 ). When the concentration increase from 10 mM to 20 mM, the battery capacity also increases about two times. Due to the limit of solubility of these organic molecules in tetraglyme based electrolyte solution, the smaller electrode was used to improve the quantity of ORRM molecules gathered at the electrode. It indirectly increases the concentration of ORRM molecules in the electrode, and the normalized capacity further increases.
Figure 2.14 (a) The concentration effect of ORRM. (b) CVs of 10 mM 1,8-DNAQ under O2 with various scan rates.
The discharge capacity shows a significant concentration effect in the Li-O2 batteries discharged with DBBQ and 1,8-DNAQ under different concentrations and electrode areas. In this part, the diameter of the electrode is 8 mm (0.5 cm2) and 4 mm
oxygen reduction. Therefore, there has surface Li2O2 growth, the concentration effect would be affected by the surface oxygen reduction, and the discharge capacity of 1,8-DNAQ was used to investigate the concentration effect of ORRMs.
Table 2.4 Discharge capacity of Li-O2 batteries with DBBQ and 1,8-DNAQ under different electrode areas. The cutoff voltage is 2.4 V.
S (cm2) c (mM) DBBQ (mAh cm-2) 1,8-DNAQ (mAh cm-2)
0.5 10 1.020.01 0.960.04
0.5 20 2.110.04 2.170.01
0.1256 20 4.780.27 4.510.47
In the presence of ORRM, the oxygen reduction path changed from direct electrochemical reduction to indirect chemical reduction by reduced ORRM. The discharge current is an exchange current via ORRM reduction instead of oxygen reduction. It contains two steps to accomplish the oxygen reduction, the first step is the ORRM electrochemical reduction (eq. 4), and the second step is chemical oxygen reduction (eq. 5). The later step is thought to be the rate-determining step in the oxygen reduction mediated by ORRMs. In the discharge process, ORRM generated and accumulates with time due to the limitation of the reaction rate of eq. 5. In a unit area, if there have more ORRM molecules, it increases the tolerance of accumulation of ORRM which hasn't been oxidized to ORRM by oxygen and helps maintain the discharge voltage. Therefore, a high concentration of ORRM facilitates larger capacity. Another critical factor is the concentration of the reactants, for the ORRM, it can up to 20mM, and the reduced ORRM, ORRM-, may even much higher than ORRM in the electrode due to the enrichment effect on the electrode surface. While for the oxygen, its concentration is much lower, about 0.447 mM.55 Improve oxygen mass transport would enhance the discharge rate.
the electrochemical reaction, described as eq. 4, depends on the potential employed on the electrode, namely if a large overpotential is applied, a faster reaction rate could achieve. However, the reaction rate of the chemical reaction between ORRM and O2 can't be controlled; usually, the energy barrier determines the reaction rate. As discussed in Figure 2.9c, the potential difference (ΔE) between the equilibrium potential of Li-O2 battery and the Ep,a of ORRM, determines the reaction rate. At present, I don't have the experimental conditions to quantitively analyze the reaction rate of reactions in eq. 4 and eq. 5. It is a little regretful, but I think the answer will be got in the future by other researchers. I use a simple method to analyze the reaction rate difference of reactions in eq.4 and eq. 5 qualitatively from the CV results.
With the scan rate increase, the anodic peak also increases under the oxygen saturated state (Figure 2.14b). The chemical reaction of eq. 5 is fast enough; all the ORRM would be oxidized via the eq. 5, however, in the CV, there is a clear anodic peak belongs to electrochemical oxidation of 1,8-DNAQ. It means the 1,8-DNAQ is oxidized to 1,8-DNAQ, which supports the conclusion that the chemical reaction rate between ORRM and oxygen is slow than the electrochemical reaction of ORRM to ORRM. As for the slow reaction kinetics between ORRM and oxygen, a high concentration of ORRM was used in the coin cell discharge process.
2.3.4 Synergistic Effect Between ORRM and Water
For the Li-O2 battery, water has severe damage to the lithium anode. However, it has a positive effect on battery capacity. At the same time, however, less attention has been paid to the influence of water molecules, possibly introduced from the discharge environment.Here, I design a particular atmosphere that water gradually leaks to the electrolyte to avoid lithium fast reacts with water that directly added to the electrolyte. It allowed exploring the synergistic effect between ORRM and water in the presence of
that this is different from the case that water molecules are directly added to the electrolyte solution in the sample preparation stage, where a fast chemical reaction will occur with the Li anode. Usually, a protected anode or an alternative anode are needed by adding water to electrolyte solution directly.94-102 The water content in the electrolyte was evaluated by a diluted method and re-calculated by a specially designed equation (Chapter 2.2.3, Table 2.1). In this situation, the rate of water increase under a speed of 15-22 ppm/h.
Figure 2.15 Discharge curves of Li-O2 batteries with and without ORRMs at a current density of 0.1 mA cm-2 under high water containing oxygen and 2.2 V was used as cutoff voltage to adapt to all ORRMs.
Table 2.5 Batteries discharged at high water content (RH: 5-6%) oxygen glovebox. The reduction peak potential of AQs under Ar (Ep,c, Ar) and
O2 (Ep,c, O2) collected from CV curves was summarized in the first two rows. Discharge current density was 0.1 mA cm-2, and an averaged value
was used to present the discharge capacity (C. mAh cm-2). The yields of the discharge product were obtained through the UV titration method. T
is the enhancement of the discharge capacity comparing with the pure Li-O2 battery.
O2 PQ NAQ AQ MClAQ DClAQ MNAQ MCAQ DBBQ DCAQ
1,5-DNAQ 1,8-DNAQ Ep,c ,Ar 2.17 2.11 2.20 2.27 2.32 2.33 2.37 2.44 2.5 2.56 2.58 2.59 Ep,c ,O2 - 2.25 2.28 2.38 2.36 2.35 2.50 2.49 2.40 2.56 2.58 2.60 C. / mM S 5 (s) 5 (s) 20 20 20 (s) 20 20 (s) 20 5 (s) 5 (s) 20 C. /mAh cm-2 1.05 0.06 3.53 0.24 4.32 0.33 1.65 0.38 5.69 0.08 2.81 0.36 12.18 0.35 2.66 0.14 11.89 0.04 1.77 0.12 11.84 0.22 9.53 0.62 Y/% - 87.2 88.9 83.2 89.4 83.5 87.6 78.4 80.7 75.8 93.1 70.0
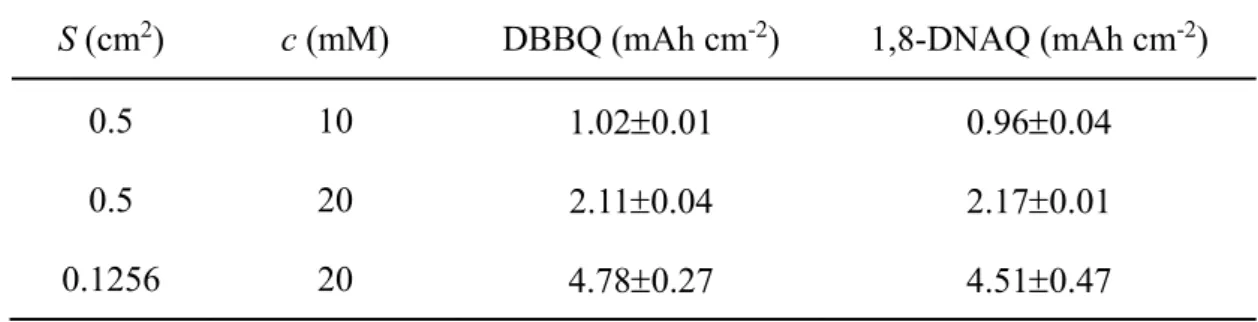
The enhancement of Li-O2 batteries with water and ORRMs measured under the current density of 0.1 mA cm-2 (Figure 2.15, Table 2.5). In the absence of ORRMs, the potential drops to the cutoff voltage 2.2 V quickly, displaying a capacity of around 1.05 mAh cm-2. All ORRM containing batteries exhibit dramatic capacity increase varies each ORRM, while the trend that ORRM reduction potential dominated discharge capacity not as significant as batteries discharged in low water content oxygen. The batteries discharged with MNAQ have the largest capacity, even its reduction potential, not as positive as MCAQ, DBBQ, DCAQ, 1,5-DNAQ, and 1,8-DNAQ. However, the discharge plateau still strictly depends on the reduction potential of ORRM as previous results, 1,8-DNAQ still has the highest discharge plateau (above 2.7 V) among all the tested ORRMs due to its highest reduction potential. Similarly, the solubility still is a crucial factor in the discharge capacity, such as DClAQ, MCAQ, and DCAQ, show limited improvement than the others. Another interesting phenomenon is the nitro (NO2) substituted AQ benefits more in the discharge capacity than the other group modified AQ, and it boosts to around 12 mAh cm-2 for MNAQ and 1,5-DNAQ, which is comparable to that of DBBQ, the capacity increase to 10 mAh cm-2 for 1,8-DNAQ.
Table 2.6 The synergistic effect between ORRM and water. Capacity (mAh cm-2) O
2 1,8-DNAQ
No H2O 0.05 2.23
H2O 1.05 9.53
In the presence of ORRM and water, they show a synergistic effect on the discharge capacity. The discharge capacity without water and 1,8-DNAQ is 0.05 mAh cm-2, while with each of them alone is 1.05 mAh cm-2 and 2.23 mAh cm-2, respectively. The discharge capacity with both of them is 9.53 mAh cm-2. When water and ORRM are present at the same time, the discharge capacity is greater than the sum when both are present alone. The role of water is to strengthen the solution mechanism of Li2O2
following section.
Figure 2.16 SEM images of the pristine carbon electrode and discharged cathode with and without ORRMs in a high water content oxygen atmosphere (RH 5%). Scale bar (2 μm) under each image, magnification, and voltage is showed at the bottom of each figure with the name of the corresponding ORRM.
Discharge with ORRM and water, the capacity has a noticeable increase, and the morphology of the Li2O2 also has different features. A recent in situ TEM research shows the Li2O2 grows into toroidal shape via two steps: the dominant lateral direction growth to disc shape in the initial discharge stage followed by the growth along the vertical direction to a toroidal shape.103 Li2O2 exhibits two growth stages, lateral growth,
existence in the discharge process due to the overlapping in the reduction potential. Excessive crystalline centers that formed by direct oxygen reduction on carbon fiber surface cause the growth of all Li2O2 stoped at the disc state. Numerous crystalline centers grow at the same time, resulting in all crystal nuclei that cannot become large.
With the reduction potential of ORRMs shift to the positive direction, double-layer disc, and triple-layer disc appeared on the electrode discharge with DClAQ. It means Li2O2 starts to grow in the vertical direction because of the overlapping of reduction potential between ORRM and oxygen becomes less and less. In the high reduction potential ORRM containing cells except for DCAQ (low solubility), toroidal shape Li2O2 with a relatively large size were observed, and these toroids still include the multi-layer disc, which is an evidence for the vertical growth of Li2O2. Water further promotes the solution oxygen reduction mechanism.
Figure. 2.17 XRD (a) Raman spectroscopy (b) and IR (c raw data, d after baseline correction) of the discharged electrode under high water content oxygen, peaks in the shadow area correspond to Li2O2.
Figure. 2.17 XRD (a) Raman spectroscopy (b) and IR (c raw data, d after baseline correction) of the discharged electrode under high water content oxygen, peaks in the shadow area correspond to Li2O2.
Figure. 2.17 XRD (a) Raman spectroscopy (b) and IR (c raw data, d after baseline correction) of the discharged electrode under high water content oxygen, peaks in the shadow area correspond to Li2O2.
Multi methods were used to confirm the discharge product. XRD, Raman, and IR were employed to verify the formation of Li2O2 qualitatively. TiO(IV)SO4 UV titration was used to analyze the yield quantitatively. From the peak position of XRD and Raman spectroscopy (Figure 2.17a-b), titration yield (Table 2.5), the main discharge product can be assigned to Li2O2 for the batteries discharged in the high water content. XRD measurements show three sharp diffraction peaks at around 32.9, 35.0, and 58.7° shadowed with a gray strip corresponding to the (100), (101), (110) crystal facets of Li2O2 and a broad peak around 40.6° can be observed in some spectra belongs to (102) facet of Li2O2.
Similarly, the Raman measures further confirm that the primary discharge is Li2O2 via the feather peaks compared to the standard sample. Even in IR measurements (Figure. 2.17d), a little LiOH was detected, which may come from the reaction between Li2O2 and H2O because of the high water content in the electrolyte solution. For the batteries discharged in low water content oxygen, only information obtained from IR. There is no evidence of LiOH, and the yield from the titration method also is smaller