厚生労働科学研究費補助金(新型インフルエンザ等新興・再興感染症研究事業)
分担研究報告書
乳幼児に対するムンプスワクチン接種の経済評価
−
1歳児を対象として−
研究分担者:星 淑玲 (筑波大学医学医療系保健医療政策学研究員)
研究協力者:大久保 一郎 (筑波大学医学医療系保健医療政策学教授)
研究要旨
1歳児に対するムンプスワクチン接種の臨床経済学分析を行い、接種の定期化をめぐる議論に寄与 することを目的とする。ムンプスウィルスの感染によって発生する主な疾患の罹患率およびその後 遺症の発現率、ワクチン効果および各種費用データを用いて、余命延長マルコフ・モデルと経済モ デルを作成した。費用効果分析の手法を用いて社会全体と支払者の二つの視点から1回接種プログラ ム(以下1-dose programとする)と10の2回接種のプログラム(以下2-dose programとする)の経 済評価を行った。定期接種化しない場合と比較した結果では、1-dose programは分析視点(支払者 の視点または社会全体の視点)にかかわらず gained more, cost less の結果であった。一方、2-dose programについては、(1)支払者の視点からの分析では、10のプログラムは全て gained more cost more であり、1QALY獲得当たりの費用は620万円以下であった。(2)社会全体の視点からの分 析では、2歳〜7歳に2回目接種を行う6つのプログラムが gain more, cost less に転じたが、一方、
8歳〜11歳に2回目接種を受ける4つのプログラムは依然として gain more, cost more であり、
1QALY獲得当たりの費用は550万円以下であった。本研究の分析結果から下記の結論が導かれた。1 回接種の場合は支払者の立場や社会全体の立場にかかわらずQALYを獲得しながら費用を節約でき る。一方、2回目の接種を2歳〜11歳のいずれかの時期に受ける2回接種プログラムは費用節約には ならないが、1QALY獲得あたりの費用が社会的に受け入れられる範囲内にあり、その中でも3歳〜
5歳までに2回目接種を受けることがより費用対効果に優れることが示された。
A.研究目的
ムンプスウィルスは唾液腺の腫脹・圧痛、嚥 下痛、発熱を主症状として発症し、髄膜炎、脳 炎、難聴、膵炎、思春期以降の睾丸炎と卵巣炎 などを合併する場合がある。頻度は少ないが永 続的な障害となることもある。流行性耳下腺炎 には特異的治療法がなく、その合併症の治療は 対症療法となる。効果的に予防するにはワクチ ンが唯一の方法である[1]。多くの国ではその予 防にMMR(麻疹・風疹・ムンプス)混合ワクチ ンを定期接種に導入し、これらの国でムンプス の発生件数は激減した[1、 2]。定期接種を行っ ている国は2009年で約120か国、うち107か国は 2回接種を実施している[1]。一方、我が国では 1981年からムンプスワクチンの任意接種がで
きるようになり、MMR接種の行われた1988年 から1993年迄の期間を除き、ムンプスワクチン の単独か任意接種が行われてきた[3]。ムンプス ワクチンとしてUrabe-AM9株の無菌性髄膜炎 によるMMRワクチンが使用中止された以来、再 び任意接種となり、接種率は約30%と報告され ている[4]。そのため、ムンプスの流行が毎年見
られ、2001年〜2007年の年間患者数は43万人〜
226万人と推定されている[3、 4、 5]。それと ともに、ムンプス難聴症例の増加が報告されて いる[6]。その対策を講じるために、日本小児科 学会は2012年に「おたふく風邪ワクチン早期定 期接種化についての要望書」を、厚生労働省に 提出した。ムンプスワクチン接種の定期化が期
待されていること[7]を踏まえ、本研究は1歳児 に対するムンプスワクチン接種の臨床経済学分 析を行い、接種の定期化をめぐる議論に寄与す ることを目的とする。
B.研究方法
費用効果分析の手法を用いて社会全体と支払 者の二つの視点から1回接種プログラム(以下 1-dose programとする)と10の2回接種のプ ログラム(以下2-dose programとする)の経 済評価を行った。接種は生後12〜18か月で1 回目を、2回目を2歳、3歳、4歳、5歳、6歳、
7歳、8歳、9歳、10歳、11歳のいずれの年に 行うと仮定した。計11のプログラムはすべて現 状(以下status quoとする)、すなわち定期接 種化しない場合と比較した。各プログラムの接 種率は、Status quoが30%[4]、1-dose program と2-dose programがそれぞれ76% [8]と仮定し た。
効果の指標は「質調整生存年
(Quality-adjusted life year、以下「QALY」
とする)」を用いた。効率性の評価は(図1)の 式を用いて求めた。
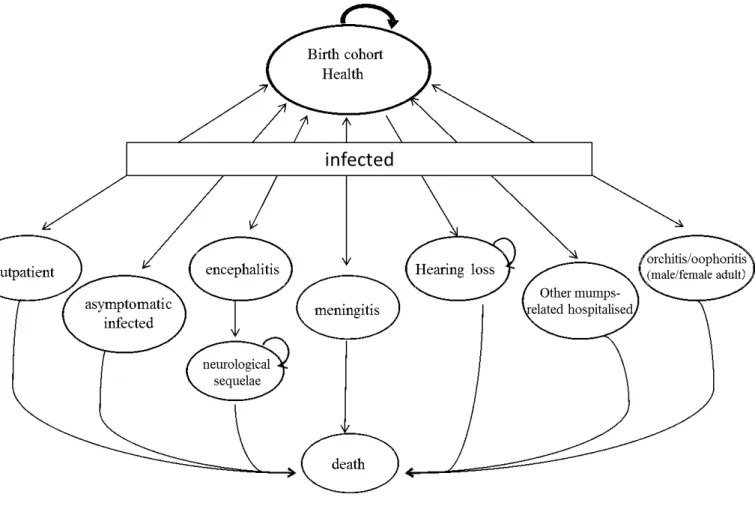
ムンプス関連疾患の予後マルコフ・モデルは 図1に示す。モデルには不顕性感染、外来受診、
髄膜炎、脳炎・脳症、難聴、その他の症状(膵 臓炎、心筋炎、合併症なくムンプスの重症化を 含む)による入院、脳炎・脳症による後遺症、
睾丸炎・卵巣炎による入院(思春期以降に感染 した場合)、死亡等のヘルスステータスを設定 した。1マルコフ・サイクルは1年とした。モデ ルの時間枠は40年とし、40年目の時点で生存し ている者はその時点の年齢に応じた平均余命ま で生存できると仮定した[9]。後遺症が残る場合 の平均余命は13。9年とした[10]。自然感染によ り終身免疫が獲得できると仮定した[1]。接種し なかった者に対する集団免疫効果は、高い接種 率(88%〜92%)が必要と報告されているため 本モデルでは考慮しなかった[11]。
年齢階級別流行性耳下腺炎の発病割合は、永 井ら[5]が推定した2000年〜2007年の流行性耳 下腺炎全国罹患数、国立感染所研究所が公表し
た同期間の流行性耳下腺炎の年齢群別割合[12]、
および年齢階級別人口[13]、の三3つのデータを 用いて求めた(表1)。感染しても症状が現れ ない不顕性感染が全感染者の15〜40%を占め、
かつ年齢と共に不顕性感染の割合が低下すると 報告されているため[1、 14]、本研究は2歳以下 児と20歳以上の者の不顕性感染者が全感染に占 める割合をそれぞれ40%と15%にし、年齢階級 の上昇とともにその割合が直線的に低下するよ うに仮定し、推定した年齢階級別流行性耳下腺 炎の発病割合とともに用いて年齢階級別不顕性 感染の割合を求めた。顕性感染者の難聴発生割 合(1000ケースに1人)は国内40施設で行われ た前向き研究から引用した[15]。その他のムン プス関連疾患の割合は保坂らの3年間の全国調 査で得られたそれぞれの患者数から求めた[16]。
遷移確率、およびQALYを求めるための効用値 (utility weight)等は表2に示す。
ワクチンの疾病罹患予防効果は海外の文献か ら引用した[11、 17、 18-21]。1回接種を69。
9%、2回接種を80%とした。また、多くの研究
は二次性ワクチン不全(接種経過年数に伴う免 疫力の減少)を報告しているため、本研究は Konitoら[22]の研究結果、すなわち、20年でワ クチン効果が75%を低下すると仮定し、モデル に組み入れた。
1 回あたりの接種費用(技術料を含む)は
6,951円とした[23]。モデルに定義された疾患に
罹患した場合または後遺症になった場合、の医 療費は菅原ら[24]、岩田ら[25]、山中ら[26]、
Okubo ら[27]、および医療給付実態調査[28]か ら引用した(表3)。
Care-giverの生産性損失は、接種や疾病罹患 時の受診・看護や後遺症の介護のための休業時 間に単位時間あたりの賃金を乗じて求めた。接 種に伴う1回あたりのcare-giverの休業時間は、
1 回目(単独接種)は4 時間、2 回目(他の定 期接種ワクチン同時接種)は0時間と仮定した。
外 来 受 診/入 院 に 伴 う 1 回/1 日 あ た り の care-giverの休業時間は4時間/8時間とした。
後遺症が残る場合のcare-giverの生産性損失は 1日あたり8時間とし、期間は子供が6歳まで
続くと仮定した(6 歳以降は就学または施設な どを利用すると仮定する)。1 時間の賃金は 5 歳以下乳幼児を持つ女性の多くを占めると思わ れる25〜39歳女性の平均賃金1,328円[29]とし た。外来受診の回数および入院日数などの費用 関連データは表2に示す。費用と効果の両方の 割引率は3%を用いた[30]
モデルに組み入れた各種変数の不確実性を検 証するために一元感度分析を行った。分析に用 いた各変数の下限値と上限値は表2に示す。
本調査法は二次データを用いた研究であり、
特定個人を対象としたものではないため倫理規 定上特別な審査は必要ではない。
C.結果
表3に結果を示す。Status quoと比較した11 の接種プログラム(1-dose program と 10 の 2-dose program の平 均増分効果 は 0.00054 QALY(1-dose program)〜0.00095 QALY (2 回目接種年齢が3歳の2-dose program)であっ た。いずれの接種プログラムも追加的にQALY を獲得するとともに疾病治療のための医療費を 減少させるが、1-dose programを除いて減少さ れた医療費は接種費用を相殺できないため増分 費用を要する。すなわち、支払者の視点では 1-dose programはstatus quoに比べ、より少 ない費用でより多くの QALY を獲得できる
“gain more, cost less”の優位なプログラムであ った。一方、2-dose programは全て“gain more, cost more”であり、ICER(1QALY獲得するた めの費用)は 2,406,232 円〜6,133,399 円であ った。2-dose programのICERは2回目接種の 年齢によって異なり、4 歳、3歳、2歳、5歳、
6-11歳の順で値が大きくなった。
社会的視点からの分析(すなわち、Care-giver の生産性費用を考慮した場合)では、1-dose program と2歳〜7歳に2回目接種を行う6つ の 2-dose program で計 7 つのプログラムで
“gain more, cost less”の結果が見られた。一方、
8歳〜11歳に2回目接種を受ける4つの2-dose
programは支払者の立場からの分析結果と同様、
依然として“gain more, cost more”の結果であ
ったが、1QALY あたり獲得するための費用は それぞれ対応する支払者の視点から得られた結 果より小さかった(表3)。
図 2は支払者の視点から分析した 11 の接種 プログラムの一元感度分析の結果を示す。ICER に最も大きいインパクトを与える5の変数はプ ログラムによって異なるが、以下の7つの変数 のうちの5つからなっている。すなわち、接種 費用、髄膜炎治療にかかる医療費、後髄膜炎に 発展する割合、流行性耳下腺炎の発病率、1回 目接種のワクチン効果、2回目接種のワクチン 効果、一側性難聴の効用値である。そのうち、
接種費用は全てのプログラムで共通して最も大 きな影響を与える変数であった。接種費用をベ ース・ケースの6,972円の50%になると全ての プログラムのICERが負の値になる。これはす なわち、いずれの接種プログラムにおいても status quoに比べ、“gain more, cost less”とな ることを示す。分析によって得られた計726の ICER(66変数×11プログラム)のうち、1,000 万円/QALYを上回ったのは、2-dose program(2 回目接種時期>=7歳)における流行性耳下腺炎 の発症率の下限値、2-dose program(2回目接 種時期>=9歳)における1回目接種のワクチン 効果の下限値、2-dose program(2回目接種時 期>=7 歳)における接種費用の上限値、及び 2-dose program(2回目接種時期>= 8歳)にお ける一側性難聴の効用値の上限値の 17 の変数 であった。
D.考察
本研究は、1歳児を対象としたに計11のムン プスワクチン定期予防接種プログラム(1-dose programと2回目の接種時期が異なる10の 2-dose program)の医療経済的分析を行った。
Status quo、すなわち定期接種化しない場合と
比較した結果では、1-dose programは分析視点
(支払者の視点または社会全体の視点)にかか わらず”gained more, cost less”の結果であった。
一方、2-dose programについては、(1)支払 者の視点からの分析では、10のプログラムは全 て“gained more cost more”であり、1QALY獲得
当たりの費用は620万円以下であった。(2)
社会全体の視点からの分析では、2歳〜7歳に2 回目接種を行う6つのプログラムが“gain more, cost less”に転じたが、一方、8歳〜11歳に2回目 接種を受ける4つのプログラムは依然として
“gain more, cost more”であり、1QALY獲得当 たりの費用は550万円以下であった。
我が国ではShiroiwaらは医療介入の Willingness to pay (WTP) は1QALY当たり 500万円と報告しているが[31]、公衆衛生プログ ラムの経済評価におけるICERの解釈に関する 判断基準、すなわちWTPについての報告はない。
米国のワクチン開発プライオリティ委員会
(Committee to Study Priority for Vaccine Development)は社会的立場からワクチンの開 発および使用に対する経済評価を行い、またラ ンク付けを行う際にはICERを用いて費用対効 果分析を4つのレベルでおこなうことを提案し ている。1QALYあたり10,000〜100,000ドル(約 100万円〜1,000万円)は“favourable”とされて いる[32]。これとは別に、WHOはGDP per capitaの3倍という公衆衛生プログラムの閾値
(おおよそ¥1,100万/QALY)を示している[33]。
これらの基準を用いれば、ムンプスワクチンは 医療経済の見地から見て社会的に受容できると 考えられるのみならず、支払者の視点では 1-dose programが、社会的な視点ではそれに加 え3-4歳に2回目接種を受ける2-dose programが 費用節約的となることが示された。また、2013 年に新たに定期接種となった 7価肺炎球菌ワク チンの経済評価(1QALY獲得あたりの費用は約
740万円)[10]に比べ、ムンプスワクチンの費用
対効果ははるかに優れるである。
一元感度分析の結果では、計726のICERのう ち、1,000万円/QALYを上回ったのは、2-dose programにおける、接種費用の上限値(2回目接 種時期:7~11歳)、流行性耳下腺炎の発症率の下 限値(2回目接種時期:7~11歳)、1回目接種の ワクチン効果の下限値(2回目接種時期:9~11歳)、
及び一側性難聴の効用値の上限値(2回目接種時 期:8~11歳)の17の変数であった。そのうちの5 つは接種費用の上限値によるものであった。定
期接種化されたワクチンの接種費用率が自由接 種時のそれより高くなり、ワクチンの流通が拡 大されるため、接種費用の上昇は考えられにく いであろう。その他の12のICERはいずれも 12,500,000円/QALY以下であるため本研究の 結果の安定性は憂慮されるものではないと考え られる。
E.結論
1歳児に対するムンプスワクチン接種の臨床 経済的分析では、1回接種の場合は支払者の立 場や社会全体の立場にかかわらずQALYを獲得 しながら費用を節約できる。一方、2回目接種を 2歳〜11歳のいずれの時期に接種を受ける2回 接種プログラムは費用節約にはならないが、
1QALY獲得あたりの費用が社会的に受け入れ られる範囲内にあり、その中でも3歳〜5歳まで に2回目接種を受けることがより費用対効果に 優れることが示された。
参考文献
1) WHO position paper on mumps virus vaccines. Weekly Epidemiological Record . No 7, 16 February 2007.
2) Peltola H,Davidkin I,Paunio M,Valle M,Leinikki P,Heinonen OP. Mumps and rubella eliminated from Finland. JAMA 2000;284(20):2643-7.
3) Nakayama T. Vaccine chronicle in Japan.
J Infect Chemother 2013;19:787-98.
4) Infectious Agents Surveillance Report (IASR). Mumps 1993〜2002. IASR 2003;24:103-4.
5) 永井正規、他.感染症発生動向調査に基づ く流行の警報・注意報及び全国年間患者数 野推計.厚生労働科学研究費補助金(新興・
再興感染症研究事業)効果的感染症サーベ ラスの評価並びに改良に関する研究.東 京:厚生労働省、2008;129-134.
6) Kawashima Y,Ihara K,Nakamura M,Nakashima T,Fukuda S, Kitamura K.
Epidemiological study of mumps deafness
in Japan. Auris Nasus Larynx 2005;32(2):125-8.
7) Sasaki T,Tsunoda K. Time to revisit mumps vaccination in Japan? Lancet 2009; 374(9702): 1722.
8) 牟田広実、鴛海亨介、松田有紀.ワクチン 接種費用と保護者の接種意思−ヒブとムン プスワクチンの比較‐.外来小児科、
2012;15(1):2-12.
9) 厚生労働省.第21回生命.東京:大臣官房 統計情報部人口動態・保健社会統計課;2012.
10) Hoshi SL, Kondo M, Okubo I. Economic evaluation of vaccination programme of 7-valent pneumococcal conjugate vaccine to the birth cohort in Japan. Vaccine 2012 ;30(22):3320-8.
11) Deeks SL, Lim GH, Simpson MA, Gagné L, Gubbay J, Kristjanson E, et al. An assessment of mumps vaccine
effectiveness by dose during an outbreak in Canada. CMAJ 2011;183(9): 1014-20.
12) 感染症発生動向調査(IDWR).
2010;12(19):13-5.
13) 総務省統計局.人口推計:統計局;2011.
14) Nagai T, Okafuji T, Miyazaki C, et al.
Nakayama T. A comparative study of the incidence of aseptic meningitis in
symptomatic natural mumps patients and monovalent mumps vaccine recipients in Japan. Vaccine 2007;25(14):2742-7.
15) Hashimoto H, Fujioka M, Kinumaki H;
Kinki Ambulatory Pediatrics Study Group. An office-based prospective study of deafness in mumps. Pediatr Infect Dis J. 2009;28(3):173-5.
16) 保坂シゲリ、小森貴、保科清、他.ウイル スおよび水痘・帯状疱疹ウイルス感染によ る重症化症例と重篤な合併症を呈した症例 についての調査.日本小児科医師会会報、
2012;44:182-6.
17) Dayan GH, Rubin S. Mumps outbreaks in vaccinated populations: are available
mumps vaccines effective enough to prevent outbreaks? Clin Infect Dis 2008;47(11):1458-67.
18) Centers for Disease Control and Prevention. Prevention of measles, rubella, congenital rubella syndrome,and mumps,2013: summary recommendations of the Advisory Committee on Immunization Practices (ACIP). MMWR 2013;62(RR-04):1-34.
19) Poethko-Müller C, Mankertz A.
Seroprevalence of measles-,mumps- and rubella-specific IgG antibodies in German children and adolescents and predictors for seronegativity. PLoS One 2012;7(8):e42867.
20) Peltola H, Kulkarni PS, Kapre SV, Paunio M, Jadhav SS, Dhere RM. Mumps Outbreaks in Canada and the United States: Time for New Thinking on Mumps Vaccin. Clin Infect Dis 2007;45(4):459-66.
21) Demicheli V,Rivetti A,Debalini MG,Di Pietrantonj C. Vaccines for measles, mumps and rubella in children. Cochrane Database of Systematic Reviews 2012,Issue 2. Art. No.: CD004407. DOI:
10.1002/14651858.CD004407.pub3.
22) Kontio M, Jokinen S, Paunio M, Peltola H, Davidkin I. Waning antibody levels and avidity: implications for MMR vaccine-induced protection. J Infect Dis 2012;206(10):1542-8.
23) 予防接種部会 ワクチン評価に関する小委
員会.おたふくかぜワクチン作業チーム.
おたふくかぜワクチン作業チーム報告書、
2011.
24) 菅原 民、他.ムンプスワクチンの定期接種
化の費用対効果分析.感染症学雑誌、2007;
81(5):555-61.
25) 岩田敏、石和田稔彦、坂田宏、坂野尭、佐 藤吉壮、中野貴司、西 順一郎、春田恒和、
星野直、神谷齊.肺炎球菌による小児髄膜
炎・菌血症の疾病負担分析.小児科臨床、
2008;61(11):2206-20.
26) 山中昇、他.わが国における小児急性中耳 炎の疾病負担と 7 価肺炎球菌結合型ワク チンの医療経済効果.小児感染免疫、
2009;21(1):37-48.
27) Okubo S, Takahashi M, Kai I. How Japanese parents of deaf children arrive at decisions regarding pediatric cochlear implantation surgery: a qualitative study.
Soc Sci Med. 2008; 66(12):2436-47.
28) 厚生労働省.平成23年度医療給付実態調査.
2013年5月公表.
29) 厚生労働省.賃金構造基本統計調査.東京:
厚生労働省、2010.
30) Drummond MF, Sculpher MJ, Torrance GW, O’Brien BJ, Stoddart GL. Methods for economic evaluation of health care programmes. 3rd ed. Oxford: Oxford University Press; 2004.
31) Shiroiwa T, Sung YK, Fukuda T, Lang HC, Bae SC, Tsutani K. International survey on willingness-to-pay (WTP) for one additional QALY gained: what is the threshold of cost effectiveness? Health Econ 2010;19(4):422–37.
32) Vaccines for the 21st Century. A TOOL FOR DECISIONMAKING. Kathleen R.
Stratton, Jane S. Durch, and Robert S.
Lawrence, Editors. Committee to Study Priorities for Vaccine Development, Division of Health Promotion and Disease Prevention, Institute of Medicine,
National Academy Press. Washington, D.C.
33) World Health Organization. WHO guide for standardization of economic
evaluations of immunization programmes.
WHO Document Production Services:
Geneva,Switzerland.
F.研究発表 1.論文発表
なし 2.学会発表 なし
G.知的財産権の出願・登録状況 1.特許取得
なし
2.実用新案登録 なし
3.その他 なし
(図1)「質調整生存年(Quality-adjusted life year、以下「QALY」とする)
quo status programme
n vaccinatio
quo status programme
n vaccinatio
Effect Effect
Cost Cost
ICER
ICER: incremental cost-effectiveness ratio(増分費用効果比)
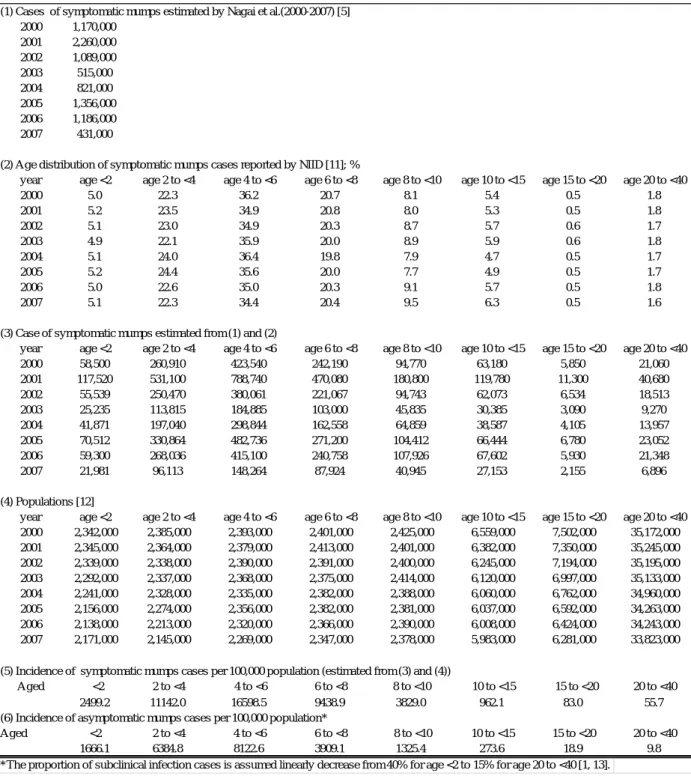
Table 1. Estimation of incidences of symptomatic and asymptomatic cases
(1) Cases of symptomatic mumps estimated by Nagai et al.(2000-2007) [5]
2000 1,170,000 2001 2,260,000 2002 1,089,000
2003 515,000
2004 821,000
2005 1,356,000 2006 1,186,000
2007 431,000
(2) Age distribution of symptomatic mumps cases reported by NIID [11]; %
year age <2 age 2 to <4 age 4 to <6 age 6 to <8 age 8 to <10 age 10 to <15 age 15 to <20 age 20 to <40
2000 5.0 22.3 36.2 20.7 8.1 5.4 0.5 1.8
2001 5.2 23.5 34.9 20.8 8.0 5.3 0.5 1.8
2002 5.1 23.0 34.9 20.3 8.7 5.7 0.6 1.7
2003 4.9 22.1 35.9 20.0 8.9 5.9 0.6 1.8
2004 5.1 24.0 36.4 19.8 7.9 4.7 0.5 1.7
2005 5.2 24.4 35.6 20.0 7.7 4.9 0.5 1.7
2006 5.0 22.6 35.0 20.3 9.1 5.7 0.5 1.8
2007 5.1 22.3 34.4 20.4 9.5 6.3 0.5 1.6
(3) Case of symptomatic mumps estimated from (1) and (2)
year age <2 age 2 to <4 age 4 to <6 age 6 to <8 age 8 to <10 age 10 to <15 age 15 to <20 age 20 to <40
2000 58,500 260,910 423,540 242,190 94,770 63,180 5,850 21,060
2001 117,520 531,100 788,740 470,080 180,800 119,780 11,300 40,680
2002 55,539 250,470 380,061 221,067 94,743 62,073 6,534 18,513
2003 25,235 113,815 184,885 103,000 45,835 30,385 3,090 9,270
2004 41,871 197,040 298,844 162,558 64,859 38,587 4,105 13,957
2005 70,512 330,864 482,736 271,200 104,412 66,444 6,780 23,052
2006 59,300 268,036 415,100 240,758 107,926 67,602 5,930 21,348
2007 21,981 96,113 148,264 87,924 40,945 27,153 2,155 6,896
(4) Populations [12]
year age <2 age 2 to <4 age 4 to <6 age 6 to <8 age 8 to <10 age 10 to <15 age 15 to <20 age 20 to <40
2000 2,342,000 2,385,000 2,393,000 2,401,000 2,425,000 6,559,000 7,502,000 35,172,000
2001 2,345,000 2,364,000 2,379,000 2,413,000 2,401,000 6,382,000 7,350,000 35,245,000
2002 2,339,000 2,338,000 2,390,000 2,391,000 2,400,000 6,245,000 7,194,000 35,195,000
2003 2,292,000 2,337,000 2,368,000 2,375,000 2,414,000 6,120,000 6,997,000 35,133,000
2004 2,241,000 2,328,000 2,335,000 2,382,000 2,388,000 6,060,000 6,762,000 34,960,000
2005 2,156,000 2,274,000 2,356,000 2,382,000 2,381,000 6,037,000 6,592,000 34,263,000
2006 2,138,000 2,213,000 2,320,000 2,366,000 2,390,000 6,008,000 6,424,000 34,243,000
2007 2,171,000 2,145,000 2,269,000 2,347,000 2,378,000 5,983,000 6,281,000 33,823,000
(5) Incidence of symptomatic mumps cases per 100,000 population (estimated from (3) and (4))
Aged <2 2 to <4 4 to <6 6 to <8 8 to <10 10 to <15 15 to <20 20 to <40
2499.2 11142.0 16598.5 9438.9 3829.0 962.1 83.0 55.7
(6) Incidence of asymptomatic mumps cases per 100,000 population*
Aged <2 2 to <4 4 to <6 6 to <8 8 to <10 10 to <15 15 to <20 20 to <40
1666.1 6384.8 8122.6 3909.1 1325.4 273.6 18.9 9.8
*The proportion of subclinical infection cases is assumed linearly decrease from 40% for age <2 to 15% for age 20 to <40 [1, 13].
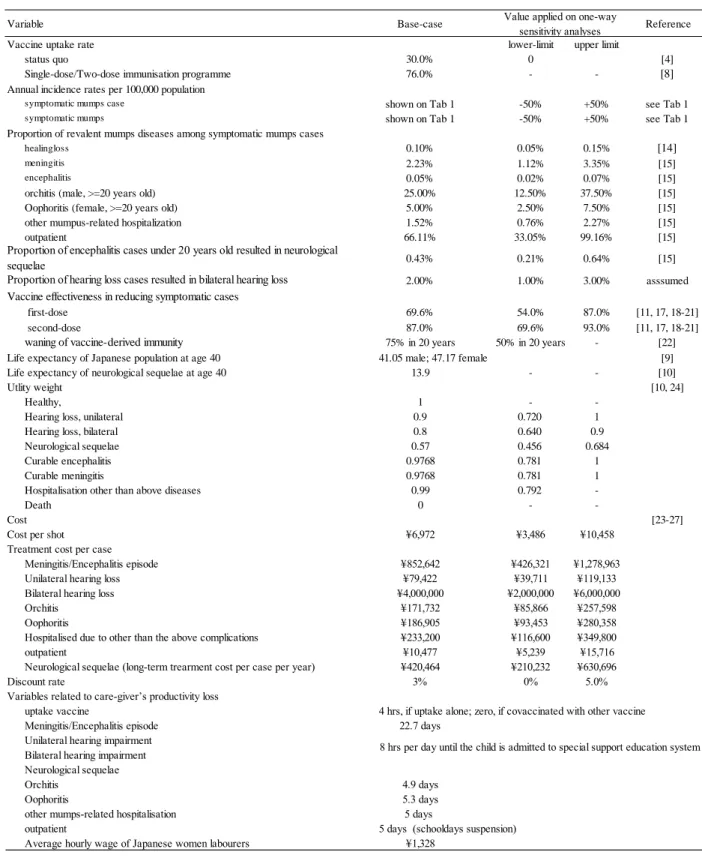
Table 2 Variables
Variable Base-case Reference
Vaccine uptake rate lower-limit upper limit
status quo 30.0% 0 [4]
Single-dose/Two-dose immunisation programme 76.0% - - [8]
Annual incidence rates per 100,000 population
symptomatic mumps case shown on Tab 1 -50% +50% see Tab 1
symptomatic mumps shown on Tab 1 -50% +50% see Tab 1
Proportion of revalent mumps diseases among symptomatic mumps cases
healingloss 0.10% 0.05% 0.15% [14]
meningitis 2.23% 1.12% 3.35% [15]
encephalitis 0.05% 0.02% 0.07% [15]
orchitis (male, >=20 years old) 25.00% 12.50% 37.50% [15]
Oophoritis (female, >=20 years old) 5.00% 2.50% 7.50% [15]
other mumpus-related hospitalization 1.52% 0.76% 2.27% [15]
outpatient 66.11% 33.05% 99.16% [15]
0.43% 0.21% 0.64% [15]
2.00% 1.00% 3.00% asssumed
Vaccine effectiveness in reducing symptomatic cases
first-dose 69.6% 54.0% 87.0% [11, 17, 18-21]
second-dose 87.0% 69.6% 93.0% [11, 17, 18-21]
waning of vaccine-derived immunity 75% in 20 years 50% in 20 years - [22]
Life expectancy of Japanese population at age 40 41.05 male; 47.17 female [9]
Life expectancy of neurological sequelae at age 40 13.9 - - [10]
Utlity weight [10, 24]
Healthy, 1 - -
Hearing loss, unilateral 0.9 0.720 1
Hearing loss, bilateral 0.8 0.640 0.9
Neurological sequelae 0.57 0.456 0.684
Curable encephalitis 0.9768 0.781 1
Curable meningitis 0.9768 0.781 1
Hospitalisation other than above diseases 0.99 0.792 -
Death 0 - -
Cost [23-27]
Cost per shot ¥6,972 ¥3,486 ¥10,458
Treatment cost per case
Meningitis/Encephalitis episode ¥852,642 ¥426,321 ¥1,278,963
Unilateral hearing loss ¥79,422 ¥39,711 ¥119,133
Bilateral hearing loss ¥4,000,000 ¥2,000,000 ¥6,000,000
Orchitis ¥171,732 ¥85,866 ¥257,598
Oophoritis ¥186,905 ¥93,453 ¥280,358
Hospitalised due to other than the above complications ¥233,200 ¥116,600 ¥349,800
outpatient ¥10,477 ¥5,239 ¥15,716
Neurological sequelae (long-term trearment cost per case per year) ¥420,464 ¥210,232 ¥630,696
Discount rate 3% 0% 5.0%
Variables related to care-giver’s productivity loss
uptake vaccine 4 hrs, if uptake alone; zero, if covaccinated with other vaccine
Meningitis/Encephalitis episode 22.7 days
Unilateral hearing impairment Bilateral hearing impairment Neurological sequelae
Orchitis 4.9 days
Oophoritis 5.3 days
other mumps-related hospitalisation 5 days
outpatient 5 days (schooldays suspension)
Average hourly wage of Japanese women labourers ¥1,328
8 hrs per day until the child is admitted to special support education system Proportion of encephalitis cases under 20 years old resulted in neurological
sequelae
Value applied on one-way sensitivity analyses
Proportion of hearing loss cases resulted in bilateral hearing loss
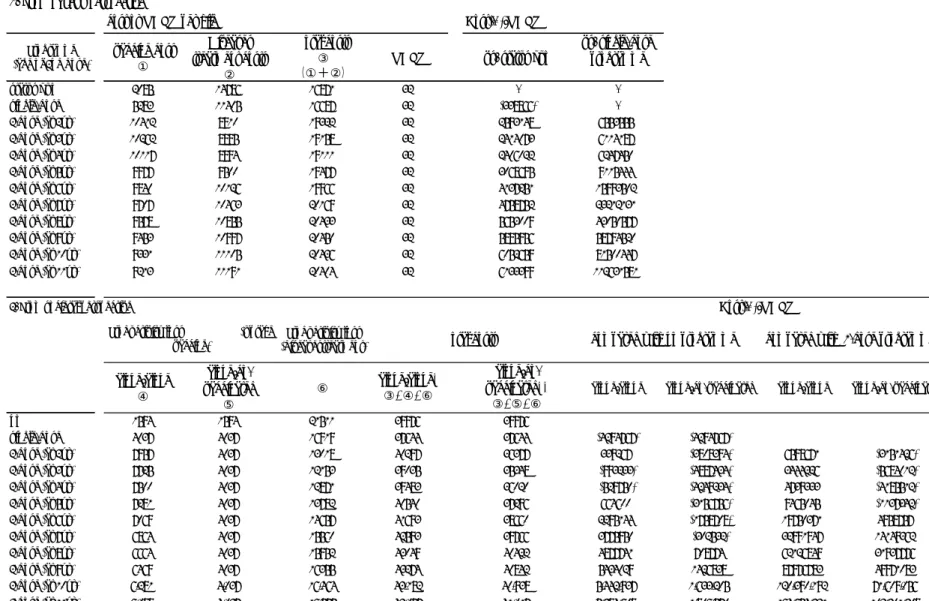
Table 3 Results of Base-case analysis
1. From payer's perspective
cost or QALY per hild Cost(¥)/QALY
Programme (age of 2nd dose)
vaccine cost
①
Diseases treatment costs
②
Total costs
③
(①+②)
QALY vs. status quo
vs. single-dose programme
status quo 2085 14786 16871 32 - -
single-dose 5283 11405 16687 32 (338866) -
2-dose (at 2yr) 10412 8910 19322 32 2593148 6553555
2-dose (at 3yr) 10262 8895 19158 32 2414073 6114187
2-dose (at 4yr) 10117 8994 19111 32 2406022 6247450
2-dose (at 5yr) 9977 9500 19477 32 3068695 9115444
2-dose (at 6yr) 9840 10126 19966 32 4137251 15993502
2-dose (at 7yr) 9707 10463 20169 32 4758752 23212131
2-dose (at 8yr) 9578 10855 20433 32 5653009 43050577
2-dose (at 9yr) 9453 10997 20450 32 5895956 58794520
2-dose (at 10yr) 9331 11105 20436 32 6052659 81500447
2-dose (at 11yr) 9213 11191 20404 32 6133399 112631581
2. From societal perspective
Productivity loss (diseasestreatment)
alone/alone
④
alone/co- vaccinated
⑤
⑥ alone/alone*
③+④+⑥
alone/co- vaccinated**
③+⑤+⑥
alone/alone alone/co-vaccinated alone/alone alone/co-vaccinated
no 1594 1594 21511 39976 39976
single-dose 4037 4037 16919 37644 37644 (4294767) (4294767)
2-dose (at 2yr) 7957 4037 13018 40297 36377 339267 (3808394) 6598671 (3151426)
2-dose (at 3yr) 7725 4037 12153 39035 35348 (993233) (4887434) 3444226 (5684012)
2-dose (at 4yr) 7500 4037 12871 39483 36020 (529750) (4249234) 4739333 (4185512)
2-dose (at 5yr) 7281 4037 13782 40540 37296 664600 (3156756) 9465045 (1137342)
2-dose (at 6yr) 7069 4037 14657 41693 38660 2295144 (1758708) 19750371 4958757
2-dose (at 7yr) 6864 4037 15560 42593 39766 3775950 (302532) 32991947 14149362
2-dose (at 8yr) 6664 4037 15952 43049 40422 4877741 708774 62126849 31937776
2-dose (at 9yr) 6469 4037 16355 43274 40842 5434029 1426838 87976783 49971083
2-dose (at 10yr) 6,281 4,037 16,464 43,182 40,938 5,442,937 1,633,205 120,390,192 71,609,056
2-dose (at 11yr) 6,098 4,037 16,575 43,077 41,017 5,384,608 1,806,570 164,654,331 102,201,308
*Alone/alone: both first and second dose were taken alone, i.e., not simultaneously taken with any other vaccines already on the routine vaccinaiton schedule.
**Alone/co-vaccinated: first dose was taken alone, while second dose was simultaneously taken with any other vaccines already on the routine vaccination schedule.
Cost(¥)/QALY Productivity loss (uptake
vaccine) Total costs compared with no programme compared with 1-dose programme
Figure 1. Markov model
Eleven mutually-exclusive health states were modeled: health、 asymptomatic infected、 symptomatic infected (outpatient)、 hospitalised due to meningitis、encephalitis、neurological sequelae due to encephalitis、hearing loss、other mumps-related hospitalisation (including pancreatitis、
myocarditis、severe mumps without complication)、hospitalised due to orchitis/oophoritis (male/female adult patient only)、 and death of or other than the related diseases.
igure 2. Results of one-way sensitivity analysis
Variables were changed one at a time when performing one-way sensitivity analysis.