Advanced Plasma and Laser Science (Kenichi ISHIKAWA) for internal use only (Univ. of Tokyo)
2014/5/27
1
Kenichi Ishikawa (
石川顕一)
http://ishiken.free.fr/english/lecture.html [email protected]
Advanced Plasma and Laser Science
プラズマ・レーザー特論E
Attosecond Science (2)
アト秒科学(2)
Advanced Plasma and Laser Science (Kenichi ISHIKAWA) for internal use only (Univ. of Tokyo)
2014/5/27
2
★ FROG-CRAB
★ 分子軌道トモグラフィー
Advanced Plasma and Laser Science (Kenichi ISHIKAWA) for internal use only (Univ. of Tokyo)
2014/5/27
How to measure (analyze) attosecond pulses
FROG-CRAB
(Frequency-Resolved Optical Gating - Complete Reconstruction of Attosecond Bursts)
3
Advanced Plasma and Laser Science (Kenichi ISHIKAWA) for internal use only (Univ. of Tokyo)
2014/5/27
How to measure (analyze) attosecond pulses アト秒パルスはどうやって測る?
4
XUV pulse duration, (ii) improved signal-to-noise (S/N) ratio due to the increased XUV photon flux, and (iii) stronger streaking before the onset of the NIR field–induced ionization in attosecond streaking (2) or enhanced S/N ratio due to a reduced number of tunneling steps in attosecond tunneling spectroscopy (14).
Figure 1 summarizes results of the modeling of the single-cycle interaction of ionizing NIR radiation with an ensemble of neon atoms (17). In Fig. 1A, the left panels plot possible NIR elec- tric waveforms,ELðtÞ ¼E0aLðtÞe−iðwLtþϕÞ þcc (whereccstands for complex conjugate) derived from our streaking measurements (as presented in the next sections) for different settings of the carrier-envelope (CE) phase, ϕ. Here, E0 is the peak electric-field strength, aL(t) is the normal- ized complex amplitude envelope, andwL is the carrier frequency. The probability of ionization outside the central cycle is more than two orders of magnitude lower than that at the field maxi- mum and hence is negligible.
The spectra of XUVemissions originating from the individual recollisions (18) are predicted to differ by tens of electron volts in cut-off energy and by up to orders of magnitude in intensity as a con- sequence of the single-cycle nature of the driving field. The strong variation of emission energies and intensities within a single wave cycle creates ideal conditions for isolated sub-100-as pulse genera- tion. Indeed, filtering radiation with the bandpass depicted by the dashed-and-dotted line is predicted to isolate XUV radiation with more than 90% of its energy delivered in a single attosecond pulse for a range of CE phases as broad as 30°≤ϕ≤90° (Fig.
1B). In contrast, with few-cycle-driven harmonic generation resulting in isolated subfemtosecond pulses over only a relatively narrow range of the CE phase nearϕ≈0° (3), single-cycle excitation appears to permit robust isolated attosecond pulses for a variety of driver waveforms, ranging from near-cosine– to sine-shaped ones, owing to the order-of-magnitude variation of the ionization probability within a single wave cycle.
We used phase-controlled sub-1.5-cycle laser pulses carried at a wavelength of lL= 2pc/wL= 720 nm (19) to generate XUV harmonics in a neon gas jet up to photon energies of ~110 eV (fig. S1). The emerging XUV pulse—following a spectral filtering through a bandpass (dashed- and-dotted line in Fig. 1A) introduced by metal foils and a Mo/Si multilayer mirror (fig. S2)—
subsequently propagates, along with its NIR driv- er wave, through a second jet of neon atoms in which the XUV pulse ionizes the atoms in the presence of the NIR field. The freed electrons with initial momenta directed along the electric- field vector of the linearly polarized NIR field are collected and analyzed with time-of-flight spec- trometry (17).
The variation of the measured photoelectron spectra versus CE phase shows good agreement with the predictions of our simulations (Fig. 2, A and B). Figure 2, C to E, shows plots of electron spectra corresponding to the CE phase
Photoelectron energy (eV)
40 50 60 70
20 40 60 80 100 120 140 160
1
ϕ = 70°
1
ϕ = 130°
30 40 50 60 70 80
0 1
ϕ = 170°
A
B
C
D
E
Carrier-envelope phase (deg)
Electron counts (arb. u.)
0 1
Photoelectron energy (eV) 0
0
40 50 60 70
Fig. 2. Control of bandpass-filtered XUV emission with the waveform of monocycle light. Measured (A) and simulated (B) (17) photoelectron spectra versus CE phase, with the delay increased in steps of
~11° (p/16 rad). (C to E) Spectra measured at the CE phase setting closest to the values selected in Fig. 1A. The zero of the CE phase scale in (A) was set to yield the best agreement with the modeled spectra in (B).
Delay (fs)
Photoelectron energy ( eV)
−4 −2 0 2 4
30 40 50 60 70 80 90
Delay (fs)
−4 −2 0 2 4
30 40 50 60 70 80 90
0.1 0.2 0.3 0.4 0.5
A B 0.6
40 50 60 70 80 90 100 110 0.2
0.4 0.6 0.8 1.0
-3 0phase (rad)
Photon energy (eV) -300 -200 -100 0 100 200 300
0.2 0.4 0.6 0.8 1.0
Time (as)
1 2 3 4
phase (rad)
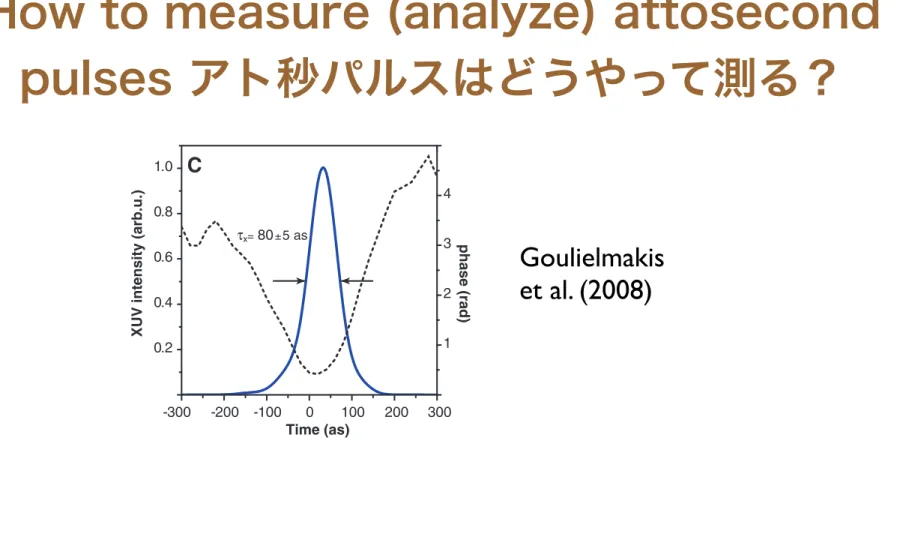
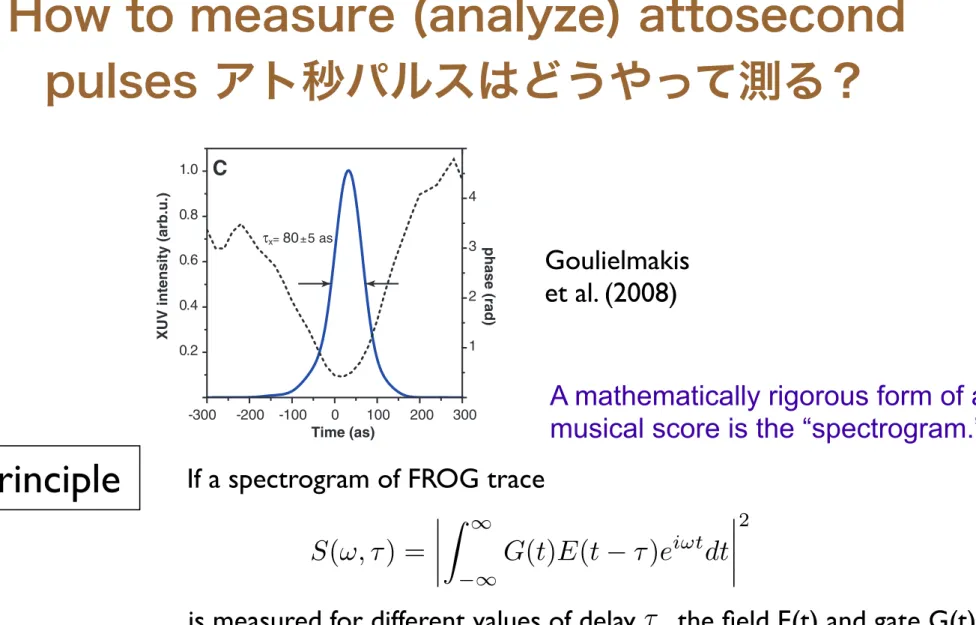
τx=80±5 as
C D
Photoelectron energy ( eV) XUV spectral intensity (arb.u.)
XUV intensity (arb.u.)
φ″=(1.5 ± 0.2)×103 as2
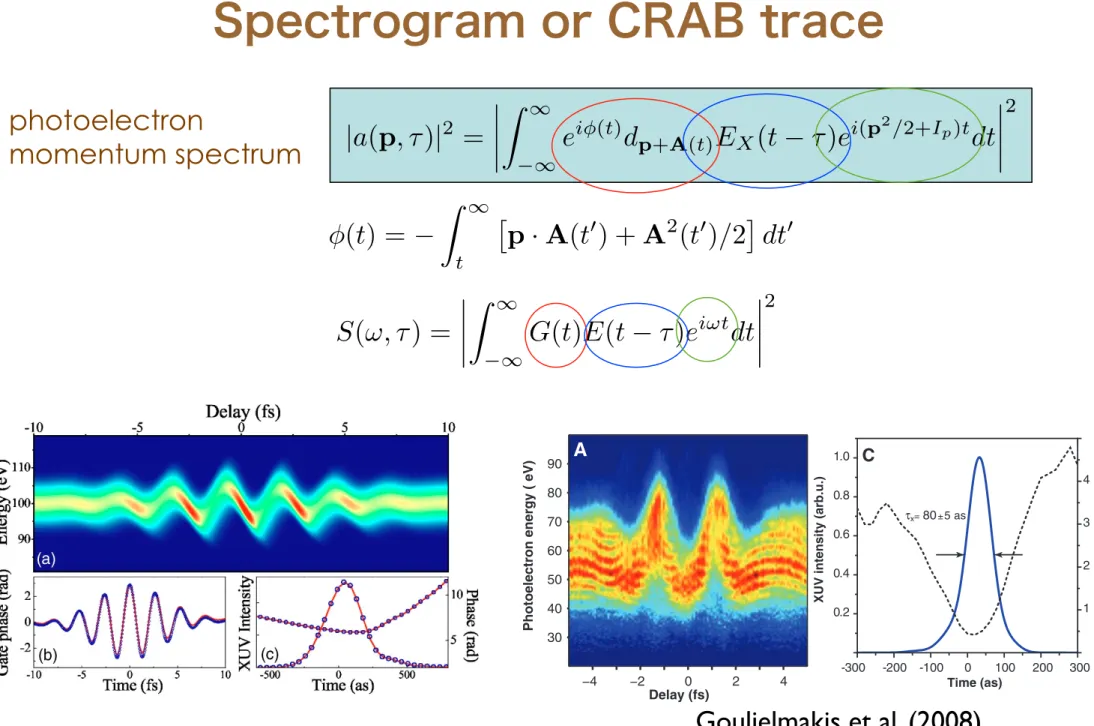
Fig. 3. Sub-100-as XUV pulse retrieval. (A) Measured ATR spectrogram compiled from 126 energy spectra of photoelectrons launched by an XUV pulse with a bandwidth of ~28 eV (FWHM) and recorded at delay settings increased in steps of 80 as. Here, a positive delay corresponds to the XUV pulse arriving before the NIR pulse. The high flux of the XUV source allows this spectrogram to be recorded within ~30 min. (B) ATR spectrogram reconstructed after ~103 iterations of the FROG algorithm (17).
(C) Retrieved temporal intensity profile and spectral phase of the XUV pulse. The intrinsic chirp of the XUV emission (Fig. 4B) is almost fully compensated by a 300-nm-thick Zr foil introduced into the XUV beam between the attosecond source and the ATR measurement. Arrows indicate the temporal FWHM of the XUV pulse. (D) XUV spectra evaluated from the measurement of the XUV-generated photoelectron spectrum in the absence of the NIR streaking field (blue dashed line) and from the ATR retrieval (blue solid line). The black dotted line indicates the retrieved spectral phase.
www.sciencemag.org SCIENCE VOL 320 20 JUNE 2008 1615
REPORTS
on August 19, 2009 www.sciencemag.orgDownloaded from
Goulielmakis
et al. (2008)
Advanced Plasma and Laser Science (Kenichi ISHIKAWA) for internal use only (Univ. of Tokyo)
2014/5/27
Typical representation of a sound wave
Plot of frequency vs. time
information on top about the intensity
5
Most people think of acoustic waves in terms of a musical score.
fre q u e n cy time
ff
pp pp
Intensity
Advanced Plasma and Laser Science (Kenichi ISHIKAWA) for internal use only (Univ. of Tokyo)
2014/5/27
How to measure (analyze) attosecond pulses アト秒パルスはどうやって測る?
6
XUV pulse duration, (ii) improved signal-to-noise (S/N) ratio due to the increased XUV photon flux, and (iii) stronger streaking before the onset of the NIR field–induced ionization in attosecond streaking (2) or enhanced S/N ratio due to a reduced number of tunneling steps in attosecond tunneling spectroscopy (14).
Figure 1 summarizes results of the modeling of the single-cycle interaction of ionizing NIR radiation with an ensemble of neon atoms (17). In Fig. 1A, the left panels plot possible NIR elec- tric waveforms,ELðtÞ ¼E0aLðtÞe−iðwLtþϕÞ þcc (whereccstands for complex conjugate) derived from our streaking measurements (as presented in the next sections) for different settings of the carrier-envelope (CE) phase, ϕ. Here, E0 is the peak electric-field strength, aL(t) is the normal- ized complex amplitude envelope, andwL is the carrier frequency. The probability of ionization outside the central cycle is more than two orders of magnitude lower than that at the field maxi- mum and hence is negligible.
The spectra of XUVemissions originating from the individual recollisions (18) are predicted to differ by tens of electron volts in cut-off energy and by up to orders of magnitude in intensity as a con- sequence of the single-cycle nature of the driving field. The strong variation of emission energies and intensities within a single wave cycle creates ideal conditions for isolated sub-100-as pulse genera- tion. Indeed, filtering radiation with the bandpass depicted by the dashed-and-dotted line is predicted to isolate XUV radiation with more than 90% of its energy delivered in a single attosecond pulse for a range of CE phases as broad as 30°≤ϕ≤90° (Fig.
1B). In contrast, with few-cycle-driven harmonic generation resulting in isolated subfemtosecond pulses over only a relatively narrow range of the CE phase nearϕ≈0° (3), single-cycle excitation appears to permit robust isolated attosecond pulses for a variety of driver waveforms, ranging from near-cosine– to sine-shaped ones, owing to the order-of-magnitude variation of the ionization probability within a single wave cycle.
We used phase-controlled sub-1.5-cycle laser pulses carried at a wavelength of lL= 2pc/wL= 720 nm (19) to generate XUV harmonics in a neon gas jet up to photon energies of ~110 eV (fig. S1). The emerging XUV pulse—following a spectral filtering through a bandpass (dashed- and-dotted line in Fig. 1A) introduced by metal foils and a Mo/Si multilayer mirror (fig. S2)—
subsequently propagates, along with its NIR driv- er wave, through a second jet of neon atoms in which the XUV pulse ionizes the atoms in the presence of the NIR field. The freed electrons with initial momenta directed along the electric- field vector of the linearly polarized NIR field are collected and analyzed with time-of-flight spec- trometry (17).
The variation of the measured photoelectron spectra versus CE phase shows good agreement with the predictions of our simulations (Fig. 2, A and B). Figure 2, C to E, shows plots of electron spectra corresponding to the CE phase
Photoelectron energy (eV)
40 50 60 70
20 40 60 80 100 120 140 160
1
ϕ = 70°
1
ϕ = 130°
30 40 50 60 70 80
0 1
ϕ = 170°
A
B
C
D
E
Carrier-envelope phase (deg)
Electron counts (arb. u.)
0 1
Photoelectron energy (eV) 0
0
40 50 60 70
Fig. 2. Control of bandpass-filtered XUV emission with the waveform of monocycle light. Measured (A) and simulated (B) (17) photoelectron spectra versus CE phase, with the delay increased in steps of
~11° (p/16 rad). (C to E) Spectra measured at the CE phase setting closest to the values selected in Fig. 1A. The zero of the CE phase scale in (A) was set to yield the best agreement with the modeled spectra in (B).
Delay (fs)
Photoelectron energy ( eV)
−4 −2 0 2 4
30 40 50 60 70 80 90
Delay (fs)
−4 −2 0 2 4
30 40 50 60 70 80 90
0.1 0.2 0.3 0.4 0.5
A B 0.6
40 50 60 70 80 90 100 110 0.2
0.4 0.6 0.8 1.0
-3 0phase (rad)
Photon energy (eV) -300 -200 -100 0 100 200 300
0.2 0.4 0.6 0.8 1.0
Time (as)
1 2 3 4
phase (rad)
τx=80±5 as
C D
Photoelectron energy ( eV) XUV spectral intensity (arb.u.)
XUV intensity (arb.u.)
φ″=(1.5 ± 0.2)×103 as2
Fig. 3. Sub-100-as XUV pulse retrieval. (A) Measured ATR spectrogram compiled from 126 energy spectra of photoelectrons launched by an XUV pulse with a bandwidth of ~28 eV (FWHM) and recorded at delay settings increased in steps of 80 as. Here, a positive delay corresponds to the XUV pulse arriving before the NIR pulse. The high flux of the XUV source allows this spectrogram to be recorded within ~30 min. (B) ATR spectrogram reconstructed after ~103 iterations of the FROG algorithm (17).
(C) Retrieved temporal intensity profile and spectral phase of the XUV pulse. The intrinsic chirp of the XUV emission (Fig. 4B) is almost fully compensated by a 300-nm-thick Zr foil introduced into the XUV beam between the attosecond source and the ATR measurement. Arrows indicate the temporal FWHM of the XUV pulse. (D) XUV spectra evaluated from the measurement of the XUV-generated photoelectron spectrum in the absence of the NIR streaking field (blue dashed line) and from the ATR retrieval (blue solid line). The black dotted line indicates the retrieved spectral phase.
www.sciencemag.org SCIENCE VOL 320 20 JUNE 2008 1615
REPORTS
on August 19, 2009 www.sciencemag.orgDownloaded from
Goulielmakis et al. (2008)
Principle If a spectrogram of FROG trace
S( , ) = G(t)E (t )e
i tdt
2
is measured for different values of delay , the field E(t) and gate G(t) can be reconstructed (principal component generalized projections algorithm).
widely used to analyze laser pulses
A mathematically rigorous form of a
musical score is the “spectrogram.”
Advanced Plasma and Laser Science (Kenichi ISHIKAWA) for internal use only (Univ. of Tokyo)
2014/5/27
7
高調波とレーザー光を遅延 時間を持たせて照射し、光 電子スペクトルを測定。
Irradiate an atom with an attosecond pulse and laser pulse with delay, a n d m e a s u r e a photoelectron spectrum
Lewenstein model photoelectron momentum spectrum a(p, )
a(p, ) = i exp[ iS (t)]E
X(t )d
p+A(t)dt = i e
i (t)d
p+A(t)E
X(t )e
i(p2/2+Ip)tdt attosecond pulse electric field
アト秒パルスの電場波形
action
作用積分(t) =
t
p · A(t ) + A
2(t )/2 dt
Advanced Plasma and Laser Science (Kenichi ISHIKAWA) for internal use only (Univ. of Tokyo)
2014/5/27
Spectrogram or CRAB trace
8 (t) =
t
p · A(t ) + A
2(t )/2 dt S( , ) = G(t)E (t )e
i tdt
2
| a(p, ) |
2= e
i (t)d
p+A(t)E
X(t )e
i(p2/2+Ip)tdt photoelectron
2momentum spectrum
tron from its parent ion to the spectrometer depends on its time of ionization within the laser field optical cycle!8": the phase it accumulates along this trajectory is thus temporally modulated by the dressing field. Because of the scalar prod- uctv·Ain Eq.#3$, the photoelectrons have to be observed in a given direction for the phase modulation to be well defined.
Different ways of using this ultrafast electron-phase modulator for the characterization of xuv fields have already been demonstrated or proposed. In the limit of a single many-laser-cycle-long xuv pulse, !#t$ corresponds to a peri- odic phase modulation on the photoelectron wave packet.
This leads to the appearance of sidebands in the photoelec- tron energy spectrum !17", which have been used to charac- terize fs to ps xuv pulses, either by cross correlation with the envelope of fs laser pulses !17", or by FROG measurements
!18,19". In the other limit of an as xuv pulse significantly shorter than the dressing field optical period, depending on the choice of the delay ", attosecond spectral shearing inter- ferometry!10"or streak-camera!2,8,9"measurements can be performed. In the latter, " is chosen in such a way that the phase modulation is quadratic in time: the electron wave packet then experiences a linear streaking in energy dW/dt
=−!2!/!t2, and the resulting distortion of the photoelectron spectrum provides direct information on the duration of the as pulses.
CRAB provides another, much more versatile, way of us- ing this electron-phase modulator. Its principle can be de- rived from the FROG technique, by comparing the expres- sion of S##,"$ given by Eq. #1$, which describes an optical FROG, and the expression of the photoelectron spectrum
%a#v,"$%2 in a given observation direction, obtained from Eqs.
#2$ and #3$. This comparison shows that, by scanning the delay ", the dressing laser field can be used as a temporal phase gate G#t$=ei!#t$ for FROG measurements on electron wave packets generated in the continuum by attosecond fields. The full characterization of these wave packets pro- vides all the information on the temporal structure of the generating as fields.
To demonstrate that this electron phase modulator is well suited for attosecond measurements, we consider the particu- lar case of a linearly polarized dressing laser field EL#t$
=E0#t$cos##Lt$, long enough for the slowly varying envelope approximation to apply. !#t$ is then given by !#t$=!1#t$
+!2#t$+!3#t$, with
!1#t$=−
&
t+$dtUp#t$,!2#t$=#
'
8WUp/#L$cos%cos#Lt, #4$!3#t$=−#Up/2#L$sin#2#Lt$.
Up#t$=E02#t$/ 4#L2 is the ponderomotive potential of the elec- tron in the laser field at timet. The observation angle% is the angle between v and the laser polarization direction. !2#t$ and !3#t$ oscillate, respectively, at the laser field frequency and its second harmonic. Due to the fast oscillations in !#t$ and to the large amplitude of the phase modulation, this electron-phase modulator has a bandwidth %!!/!t%max of
5 fs−1 #(20 eV$ for realistic parameters #W= 100 eV, %= 0,
Ilaser= 10 TW / cm2 at 800 nm$, which makes it adequate for attosecond measurements. On the other hand, as we will show, the slow variations of all terms of !#t$ associated to the envelope E0#t$ of the laser pulse, allow us to simulta- neously determine the femtosecond temporal structure of trains of as pulses.
We now use Eqs. #2$ and #3$, and the iterative PCGPA algorithm developed for the optical blind FROG, to simulate an experiment and demonstrate different schemes of CRAB for a linearly polarized laser pulse. We first show how CRAB extends existing methods for single as pulses !1,2"and trains of as bursts !3", and finally we present the case of an as field that, as far as we know, no other existing method allows to characterize.
Figure 1#a$ shows a CRAB trace calculated around the
%= 0 direction using Eqs. #2$ and #3$, for a single 315 as pulse. From a classical point of view, this trace can be un- derstood qualitatively as resulting from the oscillations of a suddenly freed electron in the dressing laser field. Figures 1#b$ and 1#c$ show the as pulse, and the gate phase !#t$, retrieved from this trace using PCGPA !20", and compares them with the exact profiles. For both signals, the agreement is excellent.
We emphasize the striking similarity of the CRAB trace of Fig. 1, with Figs. 4 of !1" and !2", which provided experi- mental evidences of the generation of a single as pulse. Our approach provides a systematic and straightforward proce- dure for the full retrieval of the laser pulse and the as burst from such measurements. This procedure has many advan- tages which are inherited from optical FROG !13". Due to the high redundancy of information in the CRAB trace, it is very robust against noise, and is unlikely to properly con- verge if experimental flaws exist, e.g., shot-to-shot variations in the as pulse temporal structure. The retrieval of the laser FIG. 1. #a$ CRAB trace of a single 315 as pulse !full width at half maximum #FWHM$ of intensity", having second- and third- order spectral phases #Fourier limit= 250 as$, gated by a Fourier- limited 6-fs 800 nm laser pulse, of 0.5 TW / cm2peak intensity. The electrons are collected around %= 0 with an acceptance angle of
±30°. #b$, #c$ A comparison of the exact as pulse and the laser- induced gate phase !#t$ #full line$ with the corresponding recon- structions#dots$ obtained from the CRAB trace after 100 iterations of the PCGPA algorithm !20". The gate modulus %G#t$% is constant and equals to 1.
Y. MAIRESSE AND F. QUÉRÉ PHYSICAL REVIEW A 71, 011401#R$ #2005$
RAPID COMMUNICATIONS
011401-2
XUV pulse duration, (ii) improved signal-to-noise (S/N) ratio due to the increased XUV photon flux, and (iii) stronger streaking before the onset of the NIR field–induced ionization in attosecond streaking (2) or enhanced S/N ratio due to a reduced number of tunneling steps in attosecond tunneling spectroscopy (14).
Figure 1 summarizes results of the modeling of the single-cycle interaction of ionizing NIR radiation with an ensemble of neon atoms (17). In Fig. 1A, the left panels plot possible NIR elec- tric waveforms,ELðtÞ ¼E0aLðtÞe−iðwLtþϕÞþcc (whereccstands for complex conjugate) derived from our streaking measurements (as presented in the next sections) for different settings of the carrier-envelope (CE) phase, ϕ. Here,E0 is the peak electric-field strength, aL(t) is the normal- ized complex amplitude envelope, andwLis the carrier frequency. The probability of ionization outside the central cycle is more than two orders of magnitude lower than that at the field maxi- mum and hence is negligible.
The spectra of XUVemissions originating from the individual recollisions (18) are predicted to differ by tens of electron volts in cut-off energy and by up to orders of magnitude in intensity as a con- sequence of the single-cycle nature of the driving field. The strong variation of emission energies and intensities within a single wave cycle creates ideal conditions for isolated sub-100-as pulse genera- tion. Indeed, filtering radiation with the bandpass depicted by the dashed-and-dotted line is predicted to isolate XUV radiation with more than 90% of its energy delivered in a single attosecond pulse for a range of CE phases as broad as 30°≤ϕ≤90° (Fig.
1B). In contrast, with few-cycle-driven harmonic generation resulting in isolated subfemtosecond pulses over only a relatively narrow range of the CE phase nearϕ≈0° (3), single-cycle excitation appears to permit robust isolated attosecond pulses for a variety of driver waveforms, ranging from near-cosine– to sine-shaped ones, owing to the order-of-magnitude variation of the ionization probability within a single wave cycle.
We used phase-controlled sub-1.5-cycle laser pulses carried at a wavelength of lL= 2pc/wL= 720 nm (19) to generate XUV harmonics in a neon gas jet up to photon energies of ~110 eV (fig. S1). The emerging XUV pulse—following a spectral filtering through a bandpass (dashed- and-dotted line in Fig. 1A) introduced by metal foils and a Mo/Si multilayer mirror (fig. S2)—
subsequently propagates, along with its NIR driv- er wave, through a second jet of neon atoms in which the XUV pulse ionizes the atoms in the presence of the NIR field. The freed electrons with initial momenta directed along the electric- field vector of the linearly polarized NIR field are collected and analyzed with time-of-flight spec- trometry (17).
The variation of the measured photoelectron spectra versus CE phase shows good agreement with the predictions of our simulations (Fig. 2, A and B). Figure 2, C to E, shows plots of electron spectra corresponding to the CE phase
Photoelectron energy (eV)
40 50 60 70
20 40 60 80 100 120 140 160
1
ϕ = 70°
1
ϕ = 130°
30 40 50 60 70 80
0 1
ϕ = 170°
A
B
C
D
E
Carrier-envelope phase (deg)
Electron counts (arb. u.)
0 1
Photoelectron energy (eV) 0
0
40 50 60 70
Fig. 2. Control of bandpass-filtered XUV emission with the waveform of monocycle light. Measured (A) and simulated (B) (17) photoelectron spectra versus CE phase, with the delay increased in steps of
~11° (p/16rad). (C to E) Spectra measured at the CE phase setting closest to the values selected in Fig. 1A. The zero of the CE phase scale in (A) was set to yield the best agreement with the modeled spectra in (B).
Delay (fs)
Photoelectron energy ( eV)
−4 −2 0 2 4
30 40 50 60 70 80 90
Delay (fs)
−4 −2 0 2 4
30 40 50 60 70 80 90
0.1 0.2 0.3 0.4 0.5
A B 0.6
40 50 60 70 80 90 100 110 0.2
0.4 0.6 0.8 1.0
-3 0 phase (rad)
Photon energy (eV) -300 -200 -100 0 100 200 300
0.2 0.4 0.6 0.8 1.0
Time (as)
1 2 3 4
phase (rad)
τx=80±5 as
C D
Photoelectron energy ( eV) XUV spectral intensity (arb.u.)
XUV intensity (arb.u.)
φ″=(1.5 ± 0.2)×103 as2
Fig. 3. Sub-100-as XUV pulse retrieval. (A) Measured ATR spectrogram compiled from 126 energy spectra of photoelectrons launched by an XUV pulse with a bandwidth of ~28 eV (FWHM) and recorded at delay settings increased in steps of 80 as. Here, a positive delay corresponds to the XUV pulse arriving before the NIR pulse. The high flux of the XUV source allows this spectrogram to be recorded within ~30 min. (B) ATR spectrogram reconstructed after ~103iterations of the FROG algorithm (17).
(C) Retrieved temporal intensity profile and spectral phase of the XUV pulse. The intrinsic chirp of the XUV emission (Fig. 4B) is almost fully compensated by a 300-nm-thick Zr foil introduced into the XUV beam between the attosecond source and the ATR measurement. Arrows indicate the temporal FWHM of the XUV pulse. (D) XUV spectra evaluated from the measurement of the XUV-generated photoelectron spectrum in the absence of the NIR streaking field (blue dashed line) and from the ATR retrieval (blue solid line). The black dotted line indicates the retrieved spectral phase.
www.sciencemag.org SCIENCE VOL 320 20 JUNE 2008 1615
REPORTS
on November 17, 2008 www.sciencemag.orgDownloaded from
XUV pulse duration, (ii) improved signal-to-noise (S/N) ratio due to the increased XUV photon flux, and (iii) stronger streaking before the onset of the NIR field–induced ionization in attosecond streaking (2) or enhanced S/N ratio due to a reduced number of tunneling steps in attosecond tunneling spectroscopy (14).
Figure 1 summarizes results of the modeling of the single-cycle interaction of ionizing NIR radiation with an ensemble of neon atoms (17). In Fig. 1A, the left panels plot possible NIR elec- tric waveforms,ELðtÞ ¼E0aLðtÞe−iðwLtþϕÞþcc (whereccstands for complex conjugate) derived from our streaking measurements (as presented in the next sections) for different settings of the carrier-envelope (CE) phase, ϕ. Here,E0is the peak electric-field strength, aL(t) is the normal- ized complex amplitude envelope, andwLis the carrier frequency. The probability of ionization outside the central cycle is more than two orders of magnitude lower than that at the field maxi- mum and hence is negligible.
The spectra of XUVemissions originating from the individual recollisions (18) are predicted to differ by tens of electron volts in cut-off energy and by up to orders of magnitude in intensity as a con- sequence of the single-cycle nature of the driving field. The strong variation of emission energies and intensities within a single wave cycle creates ideal conditions for isolated sub-100-as pulse genera- tion. Indeed, filtering radiation with the bandpass depicted by the dashed-and-dotted line is predicted to isolate XUV radiation with more than 90% of its energy delivered in a single attosecond pulse for a range of CE phases as broad as 30°≤ϕ≤90° (Fig. 1B). In contrast, with few-cycle-driven harmonic generation resulting in isolated subfemtosecond pulses over only a relatively narrow range of the CE phase nearϕ≈0° (3), single-cycle excitation appears to permit robust isolated attosecond pulses for a variety of driver waveforms, ranging from near-cosine– to sine-shaped ones, owing to the order-of-magnitude variation of the ionization probability within a single wave cycle.
We used phase-controlled sub-1.5-cycle laser pulses carried at a wavelength of lL= 2pc/wL= 720 nm (19) to generate XUV harmonics in a neon gas jet up to photon energies of ~110 eV (fig. S1). The emerging XUV pulse—following a spectral filtering through a bandpass (dashed- and-dotted line in Fig. 1A) introduced by metal foils and a Mo/Si multilayer mirror (fig. S2)— subsequently propagates, along with its NIR driv- er wave, through a second jet of neon atoms in which the XUV pulse ionizes the atoms in the presence of the NIR field. The freed electrons with initial momenta directed along the electric- field vector of the linearly polarized NIR field are collected and analyzed with time-of-flight spec- trometry (17).
The variation of the measured photoelectron spectra versus CE phase shows good agreement with the predictions of our simulations (Fig. 2, A and B). Figure 2, C to E, shows plots of electron spectra corresponding to the CE phase
Photoelectron energy (eV)
40 50 60 70
20 40 60 80 100 120 140 160
1
ϕ = 70°
1
ϕ = 130°
30 40 50 60 70 80
0 1
ϕ = 170°
A
B
C
D
E
Carrier-envelope phase (deg)
Electron counts (arb. u.)
0 1
Photoelectron energy (eV) 0
0
40 50 60 70
Fig. 2.Control of bandpass-filtered XUV emission with the waveform of monocycle light. Measured (A) and simulated (B) (17) photoelectron spectra versus CE phase, with the delay increased in steps of
~11° (p/16rad). (Cto E) Spectra measured at the CE phase setting closest to the values selected in Fig. 1A. The zero of the CE phase scale in (A) was set to yield the best agreement with the modeled spectra in (B).
Delay (fs)
Photoelectron energy ( eV)
−4 −2 0 2 4
30 40 50 60 70 80 90
Delay (fs)
−4 −2 0 2 4
30 40 50 60 70 80 90
0.1 0.2 0.3 0.4 0.5
A B 0.6
40 50 60 70 80 90 100 110 0.2
0.4 0.6 0.8 1.0
-3 0phase (rad)
Photon energy (eV) -300 -200 -100 0 100 200 300
0.2 0.4 0.6 0.8 1.0
Time (as)
1 2 3 4
phase (rad)
τx=80±5 as
C D
Photoelectron energy ( eV) XUV spectral intensity (arb.u.)
XUV intensity (arb.u.)
φ″=(1.5 ± 0.2)×103 as2
Fig. 3. Sub-100-as XUV pulse retrieval. (A) Measured ATR spectrogram compiled from 126 energy spectra of photoelectrons launched by an XUV pulse with a bandwidth of ~28 eV (FWHM) and recorded at delay settings increased in steps of 80 as. Here, a positive delay corresponds to the XUV pulse arriving before the NIR pulse. The high flux of the XUV source allows this spectrogram to be recorded within ~30 min. (B) ATR spectrogram reconstructed after ~103iterations of the FROG algorithm (17).
(C) Retrieved temporal intensity profile and spectral phase of the XUV pulse. The intrinsic chirp of the XUV emission (Fig. 4B) is almost fully compensated by a 300-nm-thick Zr foil introduced into the XUV beam between the attosecond source and the ATR measurement. Arrows indicate the temporal FWHM of the XUV pulse. (D) XUV spectra evaluated from the measurement of the XUV-generated photoelectron spectrum in the absence of the NIR streaking field (blue dashed line) and from the ATR retrieval (blue solid line). The black dotted line indicates the retrieved spectral phase.
www.sciencemag.org SCIENCE VOL 320 20 JUNE 2008 1615
REPORTS
on August 19, 2009 www.sciencemag.orgDownloaded from
Goulielmakis et al. (2008)
Approach to questions at the heart of chemistry
Matter is made up of molecules.
A molecule is made up of atoms.
But how do atoms link to each other at all?
What is chemical bond?
Hydrogen atom (H)
Carbon atom (C)
Oxygen atom (O)
Hydrogen molecules (H2)
Oxygen molecules (O2)
Water (H2O) Carbon dioxide (CO2)
Methane (CH4)
Molecular orbital theory
How the electron wave is shared by atoms is described by molecular orbital (wave function).
Theory first developed in late 1920s, Nobel prize in 1966
Now, basis for the understanding of molecular structures and chemical reaction.
But, how do the molecular orbital really looks?
Nitrogen atom (N) Nitrogen molecule (N
2)
Well, in atoms and molecules, electrons are not point particles but spread out like a cloud or wave...
Bonds in general are a mixing or sharing of the electrons from different atoms.
Now, thanks to attosecond technology, we can see molecular orbitals!
Molecular orbital tomography
Jiro Itatani et al., Nature (2004)
Experiment
Theory
Nitrogen molecule (N2)
Not just the electron density
| (r) | 2
But the wave function itself
(r)
is measured.
The wave function can be
measured!
Advanced Plasma and Laser Science (Kenichi ISHIKAWA) for internal use only (Univ. of Tokyo)
2014/5/27
高次高調波発生の3ステップモデル
3-step model of high-harmonic generation
12
E (t) = E
0cos ω t
レーザー電場電子 トンネル 電離
電場中の古典 的運動
再結合→
発光
tunneling ionization
recombination
photon emission (HHG) Laser field
Semiclassical electron motion electron
Quantum mechanical theory
Advanced Plasma and Laser Science (Kenichi ISHIKAWA) for internal use only (Univ. of Tokyo)
2014/5/27
Lewenstein model
13 M. Lewenstein et al., Phys. Rev. A 49(3), 2117
Time-dependent Schrödinger equation i (r, t)
t = 1
2 2 + V (r) + zE (t) (r, t),
Strong-field approximation (SPA)
• The contribution of all the excited bound states can be neglected.
• The effect of the atomic potential on the motion of the continuum electron can be neglected.
• The depletion of the ground state can be neglected.
Advanced Plasma and Laser Science (Kenichi ISHIKAWA) for internal use only (Univ. of Tokyo)
2014/5/27
Lewenstein model
14
Time-dependent dipole moment Within this approximation ...
x(t) (r, t) | z | (r, t)
x(t) = i
t
dt d
3p d (p + A(t)) · exp[ iS(p, t, t )] · E(t )d(p + A(t )) + c.c.
S(p, t, t ) =
tt
dt [p + A(t )]
22 + I
pSemiclassical action
作用積分
exp[ iS (p, t, t )] phase of a path (in the spirit of path integral)
経路の位相(ファインマンの経路積分に関連)transition dipole matrix element
ionization propagation
recombination
Clear physical picture corresponding to the three-step model
Advanced Plasma and Laser Science (Kenichi ISHIKAWA) for internal use only (Univ. of Tokyo)
2014/5/27
Lewenstein model
15
Time-dependent dipole moment x(t) (r, t) | z | (r, t)
x(t) = i
t
dt d
3p d (p + A(t)) · exp[ iS(p, t, t )] · E(t )d(p + A(t )) + c.c.
ionization propagation
recombination
Fourier transform
フーリエ変換ˆ
x(
h) = i dt
t
dt d
3p d (p + A(t)) · exp[i
ht iS (p, t, t )] · E(t )d(p + A(t )) + c.c..
Harmonic spectrum | x( ˆ
h) |
210-14 10-12 10-10 10-8 10-6 10-4 10-2 100 102 104
140 120 100 80 60 40 20 0
Harmonic order
Advanced Plasma and Laser Science (Kenichi ISHIKAWA) for internal use only (Univ. of Tokyo)
2014/5/27
Lewenstein model
16
x(t) = i
t
dt d
3p d (p + A(t)) · exp[ iS(p, t, t )] · E(t )d(p + A(t )) + c.c.
From another viewpoint
別の視点から= a(k, t)
=
g(r) | r | e
ik·rk = p + A(t)
electron
電子a(k, t)e
ik·rground state
基底状態amplitude of the recolliding wave packet
再結合電子波 束の振幅ˆ
x(
h) a(k)
g(r) | r | e
ik·rg
(r) | r | e
ik·r= i
kˆ
g
(k)
| x( ˆ h ) | 2 | k ˆ g (k) | 2
The harmonic spectrum contains the information of the spatial Fourier
transform of the ground-state wave function
高次高調波スペクトルは、原 子や分子の波動関数の空間フーリエ変換の情報を含んでいる。Advanced Plasma and Laser Science (Kenichi ISHIKAWA) for internal use only (Univ. of Tokyo)
2014/5/27
Molecular orbital tomography
17
| x( ˆ h ) | 2 | k ˆ g (k) | 2
Molecular axis
分子軸Laser polarization
レーザーの偏光方向k
10-14 10-12 10-10 10-8 10-6 10-4 10-2 100 102 104
140 120 100 80 60 40 20 0
Harmonic order
1. Align molecules
2. Measure harmonic spectrum
3. Repeat for different alignment angles
Reconstruction of g (r)
Advanced Plasma and Laser Science (Kenichi ISHIKAWA) for internal use only (Univ. of Tokyo)
2014/5/27
Computed tomography (CT)
18 X-ray absorption
measurement from different angles.
様々な 方向からエックス線を照 射し、吸収測定Reconstruction 再構成
3D image 三次元画像が得られる。
Advanced Plasma and Laser Science (Kenichi ISHIKAWA) for internal use only (Univ. of Tokyo)
2014/5/27
Molecular orbital tomography
19
| x( ˆ h ) | 2 | k ˆ g (k) | 2 k
harmonics are generated with a 30-fs, 2£1014W cm22, 800-nm, horizontally polarized probe pulse in a,1017cm23molecular gas jet described in the Methods section. The molecular alignment axis is rotated relative to the polarization of the probe pulse.
The probe pulse intensity was kept as low as possible to avoid saturation or depletion of the ground state. The molecular beam thickness was less than 1 mm and the laser focus was before the beam—conditions that minimize phase mismatch and select only the short electron trajectories28.
Figure 3 shows the intensities of each harmonic as the laser polarization is rotated from 0 to 908(in steps of 58) with respect to the molecular axis. The intensity contrast between 0 and 908exceeds an order of magnitude for some harmonics. We use these data to reconstruct the molecular orbital of N2. Also shown is the spectrum from the reference atom, argon, recorded under conditions identical to those for the nitrogen.
Calibrating the continuum wave packet
As discussed above, the harmonic spectrum is an experimental evaluation of the dipole,d(q). If we could evaluate the plane-wave amplitude a[k(q)] independently, then our measurement would determine R
wg(r)(er)exp[ik(q)x]dr—that is, the spatial Fourier components ofrwg(r). One way to do this is to perform the same experiment with a reference atom.
Argon is very similar to N2in its response to strong laser fields, having nearly the same ionization potential and intensity-depen- dent ionization probability6. This is confirmed by the dependence of the instantaneous ionization rates29 for atoms, and for different orientations of N2(ref. 30). That means that the first, critical, step in the three-step high harmonic generation process is the same.
Because the laser field dominates wave packet motion in the direction of the laser field, the second step, which determines the chirp of the re-colliding wave packets seen by Ar or N2, will be the same. Thus,a[k(q)] will be the same.
The continuum wave packet will also be similar for Ar and N2. The narrow saddle point through which the electron tunnels acts as a spatial filter that removes much of the structure of the orbital from the continuum wave packet. This can be seen in numerical simu- lations31. By measuring the ellipticity dependence of the high harmonic signal24produced by N2and argon, we confirmed that the lateral spread of the wave packets is similar. The ionization rate of N2is angle-dependent30,32, but is readily measured from the ion yield, and varies only by 25% for N2 (ref. 33). This variation is almost cancelled by the angular dependence of the wave-packet
spread in the lateral direction23. Thus we use the harmonic spectrum from argon to determineja[k(q)]jwithout including the angular dependence of tunnel ionization rate and wave-packet spread in the continuum.
Tomographic reconstruction of the orbital
We have shown that (1) tunnel ionization, owing to its nonlinearity, is extremely selective29,30. In N2, it ionizes only the highest electronic state—the HOMO. And (2), the harmonic spectra contain a range of spatial Fourier components of the shape of this single orbital. We have recorded the harmonic spectra at a series of angles between the molecular axis and the re-colliding electron. We now show that we can invert this information to obtain the shape of the orbital.
The Fourier slice theorem13proves that the Fourier transform of a projection Pv is equal to a cut at angle v through the two- dimensional Fourier transformFof the object. This is the basis of computed tomography based on the inverse Radon transform. Our dipole is the Fourier transform of a projection of the wavefunction, and so can be inverted.
We describe the mathematical details of the tomographic recon- struction in the Methods section. This procedure can reconstruct orbital shapes with symmetries such as jg, pg and pu, using harmonics 17–51 of an 800-nm laser field and 25 angles from 08 to 1808(fewer angles are needed for symmetric molecules).
A complete inversion of a general orbital requires knowledge of the relative phase and amplitude of each harmonic for two ortho-
Figure 3High harmonic spectra were recorded for N2molecules aligned at 19 different angles between 0 and 908relative to the polarization axis of the laser. For clarity, only some of the angles have been plotted above. The high harmonic spectrum from argon is also shown; argon is used as the reference atom. Clearly the spectra depend on both the alignment angle and shape of the molecular orbital.
Figure 4Molecular orbital wavefunction of N2.a, Reconstructed wavefunction of the HOMO of N2. The reconstruction is from a tomographic inversion of the high harmonic spectra taken at 19 projection angles. Both positive and negative values are present, so this is a wavefunction, not the square of the wavefunction, up to an arbitrary phase.b, The shape of the N22pjgorbital from anab initiocalculation. The colour scales are the same for both images.c, Cuts along the internuclear axis for the reconstructed (dashed) and ab initio(solid) wavefunctions.
articles
NATURE | VOL 432 | 16 DECEMBER 2004 | www.nature.com/nature © 2004 Nature Publishing Group 869
Jiro Itatani et al., Nature (2004)
Experiment
Theory (Hartree-Fock)
Nitrogen molecule (N2)
Reconstruction
再構成Advanced Plasma and Laser Science (Kenichi ISHIKAWA) for internal use only (Univ. of Tokyo)
2014/5/27
Wave function can be measured!
波動関数は測定できる!
20 Jiro Itatani et al., Nature (2004)
Experiment
Theory (Hartree-Fock)
Nitrogen molecule (N2)