2017〜2019年度 関西大学研究拠点形成支援経費研 究成果報告書
著者 工藤 宏人, 宮前 翼, 上田 正人, 村山 憲弘, 林
順一, 松岡 光昭, 横山 佳帆, 大倉 滉平, 内藤 牧 男, 下山 大輔, 関谷 亮, 灰野 岳晴, 池田 勝彦, 森 重雄, 土井 研児, 北垣 壽, 寺内 俊太郎, 五十 井 浩平, 白杉 文香, 丸山 徹, Tamaki
Mitsuyoshi, Nakamura Keisuke, Nakamura Gou, 齋 藤 隆太, 仲村 利樹, 柳谷 仁志, Sakai Takahiro, 中本 光二, 山口 莉嘉, 藤田 智香, 福永 真理, 塩 月 康平, 竹田 紘也, 山本 洋揮, 古澤 孝弘, 渡邊 健夫, 大隈 修, 前 一廣, 鈴木 一誓, 柿沼 綾子, 小俣 孝久, 坂本 貴則, 今坂 怜史, 石井 甫泰, 荒 木 貞夫, 山本 秀樹, 大堀 静也, 小川 大貴,
Kitagawa Kouta, 関 あずさ, Sonoc Alexandru, Jeswiet Jacob, 芝田 隼次
発行年 2020
権利 2‑1 ネットワークポリマー事務局の許諾を得て公開
しています。
2‑4 日本金属学会の許諾を得て公開しています。
2‑6 This is a post‑peer‑review, pre‑copyedit version of an article published in
International Journal of Metalcasting. The final authenticated version is available online at
http://dx.doi.org/10.1007/s40962‑019‑00310‑7.
2‑7 This is a post‑peer‑review, pre‑copyedit version of an article published in
International Journal of Metalcasting. The final authenticated version is available online at:
http://dx.doi.org/10.1007/s40962‑018‑00292‑y.
2‑13 This is the accepted version of the article, which has been published in final form at DOI 10.1016/j.micromeso.2018.07.005.
2‑14 (C)フォトポリマー学会 この資料は著者最終 ...
Creative Commons : 表示 ‑ 非営利 ‑ 改変禁止 http://creativecommons.org/licenses/by‑nc‑nd/3.0/deed.ja
URL http://hdl.handle.net/10112/00020715
Creative Commons : 表示 ‑ 非営利 ‑ 改変禁止 http://creativecommons.org/licenses/by‑nc‑nd/3.0/deed.ja
A study of the application of Donnan dialysis to the recycling of lithium ion batteries By: Alexandru Cătălin Sonoc a,1,*, Jacob Jeswietb, and Norihiro Murayamaa, Junji Shibataa
a Kansai University, Department of Chemical, Energy and Environmental Engineering, 3-3-35, Yamate, Suita, Osaka 564-8680 Japan
[email protected]; [email protected]
b Queen's University, Department of Mechanical Engineering, 130 Stuart Street, Kingston, Ontario, Canada K7L 3N6
1 Permanent address: Queen's University, Department of Mechanical Engineering, 130 Stuart Street, Kingston, Ontario, Canada K7L 3N6
* Corresponding author: Alexandru Cătălin Sonoc, [email protected] Abstract
A Donnan Dialysis based process utilizing cation exchange membranes to separate and recover lithium, nickel, cobalt, and manganese during hydrometallurgical recycling of lithium ion battery cathodes is proposed. Compared to conventional processes, the process has the potential to achieve higher lithium recoveries and to recycle lixiviant. The present work introduces the process, develops mathematical equations to describe it, presents experimentally found cation mass transfer coefficients through cation exchange membranes, and uses the experimental data and equations to predict theoretical kinetics and recoveries achievable by the process.
The simulation predicts that in two days, utilizing 5000 dm2 of CMS C-1805 Neosepta monovalent CEM and 2000 dm2 of CMX C-1586 Neosepta polyvalent CEM, the proposed process is capable of processing 1000 L of leachate containing 285 moles of lithium, 95 moles each of cobalt, nickel, and manganese.
94.1% of the lithium can be recovered as high purity lithium carbonate and 99.4% of the transition metals as mixed sulphates ready for solvent extraction. At a minimum 422.6 moles of pure sulphuric acid and 268 moles of potassium bicarbonate are needed.
1. Introduction
Lithium ion batteries (LIBs) are widely used in modern electronics and are the battery of choice for electrical vehicles now and into the foreseeable future (Fulton, 2011; Nitta et al., 2015; Vikström et al., 2013). As more of them are produced it becomes ever more important to recycle them and reuse the recovered metals to make new batteries (Deign, 2015; Sanderson, 2017; Vikström et al., 2013).
Hydrometallurgical recycling shows the greatest promise at present to recover all the metals, in particular lithium (Chen et al., 2015; Gao et al., 2017; Zhang et al., 2013).
Hydrometallurgical recycling of LIBs conventionally proceeds in four steps. The first is to deactivate the batteries, dismantle or shred them, and isolate the cathode powder (Chagnes and Pospiech, 2013; Xu et al., 2008; Zhang et al., 2013). The second is acid leaching. Both inorganic and organic acids can be used with recoveries of 100 % reported for the former (Chagnes and Pospiech, 2013) and 90 to 100%
reported for the latter (Chagnes and Pospiech, 2013; Gao et al., 2017; Li et al., 2010; Nayaka et al., 2015;
Zeng et al., 2014; Zhang et al., 2013). The rate of leaching is accelerated by adding a reducing agent, such as hydrogen peroxide, since transition metals in the cathode (such as cobalt, nickel, or manganese) need to be reduced to their +2 before they can be solubilized (Chagnes and Pospiech, 2013; Ferreira et
al., 2009; Gao et al., 2017; Li et al., 2012; Nayaka et al., 2015; Shuva and Kurny, 2013; Zhang et al., 2013;
Zheng et al., 2016). The third step is solvent extraction of transition metals. Recoveries of transition metals of 100% (Chagnes and Pospiech, 2013) and losses of lithium of 0.60% (Gao et al., 2017) have been reported during solvent extraction. The fourth step is recovery of lithium from the raffinate by concentrating it, heating it to near boiling, and adding a saturated solution of sodium carbonate, which precipitates lithium. The precipitated lithium is then purified by washing with water. Overall lithium recoveries reported have been 81% (Chagnes and Pospiech, 2013; Chen et al., 2015; Nan et al., 2005;
Nayaka et al., 2015; Zhang et al., 1998, 2013), 92.0% (Nguyen et al., 2015) and 98.22% (Gao et al., 2017).
Purities of lithium carbonate reported have been 99.18 % (Chen et al., 2015) and 99.90% (Gao et al., 2017).
The advantage inorganic acid lixiviants is that they are cheap; while their disadvantages are that they are corrosive, produce noxious gases, and the leachate residue obtained after solvent extraction is hard to remediate (Zhang et al., 2013). The advantages of organic acid lixiviants are that they can be used as reducing agents as well, are biodegradable, are less corrosive, and produce no noxious gases (Gao et al., 2017; Zhang et al., 2013). Their disadvantage is that they are more expensive (ICIS Chemical Business, 2006). This disadvantage can be obviated if they are recovered and reused in leaching. Unfortunately, after the conventional process the leachate residue is saturated in sodium and cannot be reused.
In the present paper, we introduce a new method to recover cobalt, nickel, manganese, and lithium from organic acid leachate that has the potential to enable leachate to be reused, to achieve metal recoveries and lithium carbonate purities comparable to the highest ones reported in literature, and to reduce the amount of heat used to precipitate lithium.
The method relies on two processes: Donnan dialysis with cation exchange membranes and
precipitation of lithium carbonate by depressurization of a saturated lithium carbonate solution under elevated carbon dioxide atmosphere. In the remainder of the introduction, we briefly review Donnan dialysis, which is basic, but has not been reported in hydrometallurgical literature previously. In section 2 we describe the novel process in detail and develop the equations necessary to describe it. In section 3 we describe experiments done to determine mass transfer coefficients through the membranes. In section 4 we present the mass transfer coefficients found. Lastly, in section 5 we use the mass transfer coefficients and the equations in section 2 to predict the theoretical lithium recovery achieved by the process and the membrane surface area required to achieve it.
1.1 Donnan Dialysis
Donnan dialysis is a simple, equilibrium based method for the separation and concentration of ions, in the present case cations, from aqueous solutions. A cation exchange membrane separates a feed solution containing one group of electrolytes and a stripping solution containing another group of electrolytes. Since the electrolytes are different, there exist multiple concentration gradients across the membrane. Cations from solutions on both sides of the membrane counter diffuse until the chemical potentials of both solutions are equal. Electroneutrality is maintained in the bulk of both solutions at all times. As an example, suppose there are two solutions of equal volume separated by a cation exchange membrane: one with 1 M Na+ and another with 10 M H+. At equilibrium, the concentrations will be 0.09 M Na+ and 0.91 M H+ in the first solution and 0.91 M Na+ and 9.09 M H+ in the second solution. If on the other hand the first solution contained Ca++ rather than Na+, then the equilibrium concentrations will be
0.05 M Ca++ and 1.90 M H+ in the first solution and 0.95 M Ca++ and 8.1 M H+ in the second solution.
(Davis, 2000; Donnan, 1924; Ersoz and Kara, 2000; Ring et al., 2015)
In practical applications, it is time consuming to wait for equilibrium to be achieved and therefore it is the rate of mass transfer that is of interest. Mass transfer through a CEM during Donnan dialysis is exactly described by the Nernst-Plank equation for cation fluxes, the law of electroneutrality, and mass balances (Agarwal and Goswami, 2016; Ariza et al., 2001). The Nernst-Plank equation is very difficult to solve, however, and is unnecessarily accurate for the present work. In situations where the only
significant resistance to mass transfer is the diffusion of ions from one side of the CEM to the other side, the flux may be approximated by Equation 1 (Hasson et al., 2014).
JM= PS,M∙ (∑νM∙[M]1
νC,f∙[C]1 −∑νM∙[M]2
νC,s∙[C]2) (1)
JM represents the flux of cations M through the CEM with units mol·dm-2·min. [M] is the concentration of cation M in moles·dm-3. [C] is the concentration of any cation that can pass through the membrane in moles·dm-3. νM and νC are charges of M and C respectively. “1” and “2” are arbitrary designations for solutions 1 and 2 respectively. PS is an overall mass transfer coefficient with units mol·dm-2·min. It is easy to verify that at equilibrium, with cation concentrations given by the equations of Donnan (Donnan, 1924), the flux is equal to zero.
νM ·JM = νN ·JN (2)
Equation 2 is a statement of the law of electroneutrality and relates of a cation M diffusing from solution 1 and the flux of a cation N diffusing from solution 2 (Hasson et al., 2014).
Specific forms of Equations 1 and 2 together with mass balances are given in section 2 for each of the three Donnan dialysis steps in the proposed process and serve as design equations for those steps.
Values of PS, the parameter in Equation 1, depends on cation concentrations on both sides of the
membrane, the specific cation diffusing, and on characteristics of the particular membrane used (Hasson et al., 2014). In sections 3 and 4 experiments were performed to find values of PS and the values
obtained were correlated empirically.
2. Novel Donnan Dialysis based metal recovery process
The proposed process is given in Figure 1. Steps 1, 2, and 4 are Donnan dialysis steps. In step 1, organic acid leachate is stripped of lithium and partially reprotonated. In step 2, the leachate is stripped of all other metals and is fully reprotonated and ready for reuse after more organic acid is added to make up for the amount oxidized during the leaching reaction. In step 3, stripping solution leaving step 3, which is sulphuric acid enriched with lithium, is neutralized with barium hydroxide to enable the Donnan dialysis in step 4. In step 4, the lithium sulphate solution obtained is stripped by a solution of potassium
bicarbonate solution under elevated carbon dioxide partial pressure. In step 5, the stripped lithium is precipitated from the bicarbonate solution by venting the carbon dioxide. In step 6, the bicarbonate solution is re-pressurized, replenished with potassium bicarbonate, and reused. The products of the process are a solution of Co2+, Ni2+, and Mn2+ in sulphuric acid ready for solvent extraction by typical means (see (Chagnes and Pospiech, 2013)) and precipitated lithium carbonate. The wastes are
precipitated solid barium sulphate and an aqueous stream of potassium sulphate with residual lithium sulphate. The former may be used for paint, while the latter following purification may be used as
fertilizer or reprocessed and reused. The feed chemicals required are sulphuric acid, barium hydroxide, potassium bicarbonate, and carbon dioxide gas.
Leachate: dilute solution of Co, Ni,
Mn, Li salts and organic acid
Sulphuric acid solution Dissolved Co, Ni,
Mn salts
Regenerated leaching solution for reuse
Dissolved Co, Ni, Mn salts ready for solvent extraction
Sulphuric acid solution
Li enriched, K depleted bicarbonate
solution Dissolved Li2SO4
Dissolved K2SO4 for treatment, purification,
or refurbishment
Saturated KHCO3
under CO2
atmosphere Filter
(5) CO2 venting (and heating if necessary)
Li2CO3 (s)
KHCO3 (s)
Lithium depleted solution
CO2
Li2CO3
slurry (3) Ba(OH)2
neutralization
(6) recycle stripping solution
Figure 1: Proposed process for recovery of lithium carbonate from organic acid LIB cathode powder leachate. Feed solutions are on the left of CEMs while stripping solutions are on the right. Filtration after step 3 and holding tanks are not shown.
2.1 Donnan Dialysis to recover lithium from leachate (Step 1)
In step 1 lithium cations are stripped from the leachate while the other cations are left behind. This is possible by using a monovalent CEM, which is only permeable to monovalent cations. In order to maximize lithium recovery, the feed vessel (where the leaching solution is) is operated in batch mode.
As Donnan dialysis proceeds, hydrogen ions diffusing into the feed solution from the stripping solution immediately react with conjugate base anions to remake un-dissociated organic acid. The pH in the feed vessel is therefore essentially constant. Once the desired/maximum recovery of lithium has been achieved, the feed solution is sent to a holding tank and then to step 2.
The stripping solution is sulphuric acid at the lowest possible pH the membrane can tolerate. The stripping vessel is operated semi-continuously: the pH in the vessel is maintained constant by a pH controller that adds concentrated sulphuric acid as needed. The inlet and outlet flowrate, which are equal, are continuously varied such that, as Donnan dialysis proceeds, the lithium concentration in the vessel stays constant. The former is done to maximize flux while the latter is done to minimize use of acid and ensure a consistent lithium concentration for downstream processes. The effluent stripping solution is collected in a holding tank and serves as feed for step 3. As is the case for all three membrane steps in the proposed process, both feed and stripping vessels are stirred well enough such that the only special concentration gradients present are across the membrane.
The lithium flux through the membrane is given by Equation 3. Note that Co, Ni, and Mn are not in the denominator of the first term in the bracket because they cannot enter the monovalent CEM.
JLi= PS,Li∙ ( [Li+]f
[Li+]f+[H+]f − [Li+]s
[Li+]s+[H+]s) (3) The mass balance on Li in the feed vessel is:
d[Li+]f
dt = −JLi∙VSA
feed (4)
Where SA is the surface area of the membrane in dm-2 and Vfeed is the volume of the feed vessel in dm-3. The mass balance on H+ in the stripping solution is:
[H+]s,in∙ Q − [H+]s∙ Q −νLi∙ JLi∙ SA + 2 ∙ ṅH2SO4= 0 (5)
Q is the flowrate of stripping solution through the stripping vessel. ṅH2SO4 is flow of pure sulphuric acid added by the controller to keep the pH constant and is assumed to have a negligible effect on Q. Since the controller maintains the pH at the level of the incoming pH the first two terms in Equation 5 cancel out.
The mass balance on Li in the stripping solution is:
[Li+]s,in∙ Q +νLi∙ JLi∙ SA − [Li+]s∙ Q =d[Li+]s
dt ∙ Vsr (6)
Where [Li+]s,in is the concentration of lithium flowing into the stripping vessel, assumed to be zero, and Vsr is the volume of the stripping vessel. Letting the right hand side equal zero and combining with Equation 5, the stripping flowrate required to keep the lithium concentration in the stripping vessel constant is given in Equation 7.
Q =2∙ṅ[LiH2SO4+]
s (7)
These are all the equations necessary to determine completely concentrations of mobile cations and associated anions in the first step. All that is needed is the setting of 4 controllable parameters: Vfeed, SA, [H+]s, [Li+]s, the setting of an initial condition: [Li+]f at t=0, and the value of the parameter PS,Li. It is evident from the equations that, as the feed vessel becomes depleted in lithium, the amount of concentrated sulphuric acid that needs to be added to maintain the pH of the stripping vessel decreases.
Therefore, ṅH2SO4 can be used to determine when the lithium concentration has decreased low enough that the feed can practically be considered spent and a new batch of feed is needed.
The stripping vessel is not emptied in between batches since it is desirable to maintain a constant concentration of lithium in the lithium effluent. If fresh stripping solution was used with every batch this would not be possible. For the very first batch, the stripping flowrate should be set to zero until the lithium concentration in the stripping vessel has reached the desired level.
2.2 Donnan Dialysis to recover transition metals from leachate (Step 2)
Step 2 proceeds identically to step 1 with the following differences: The feed input is leachate that has been delithiated and partially reprotonated. The membrane used is a polyvalent CEM, which allows cations of any valance to pass through it. The flowrate in the stripping vessel is continuously adjusted such that a constant sulphate concentration is maintained. As will be seen in section 4, Co, Ni, and Mn have slightly different Ps values at the same conditions and therefore it is impossible to maintain all of
them at constant concentrations; it is possible, however, to maintain the sum of their concentrations at a constant value. Effluent stripping solution is collected in a holding tank for processing by solvent extraction.
Flux of M, which is either Co, Ni, or Mn, is given by:
JM= PS,M∙ ( 2∙[M2+]f
[H+]f+2∙([Co2+]f+[Ni2+]f+[Mn2+]f) − 2∙[M2+]s
[H+]s+2∙([Co2+]s+[Ni2+]s+[Mn2+]s) ) (8) The mass balance on M in the feed vessel is:
d[M2+]f
dt = −JM∙ SA
Vfeed (9) The mass balance on H+ in the stripping solution is:
−(∑νM∙ JM) ∙ SA + 2 ∙ ṅH2SO4 = 0 (10) The mass balance on sulphate in the stripping solution is
Q ∙ [SO42−]in+ ṅH2SO4− Q ∙ [SO42−] = 0 (11)
Where [SO42-]in refers to the sulphate concentration in fresh stripping solution entering the stripping vessel and [SO42-] refers to the sulphate concentration inside and exiting the stripping vessel.
The sulphate concentration in the vessel is given by a charge balance.
[SO42−] =[H2+]s+ [Co2+]s+ [Ni2+]s+ [Mn2+]s (12)
Rearranging Equation 11, we obtain the flowrate necessary to maintain a constant sulphate concentration.
Q = ṅH2SO4
[SO42−]−[SO42−]in (13) The mass balance of M in the stripping vessel is
JM∙ SA − [M2+]s∙ Q =d[M2+]s
dt ∙ Vsr (14)
Initial values of [M2+]s may be any positive values as long as Equation 12 still holds. Just as in step 1, the stripping vessel is not emptied in between batches in order to ensure low variability in transition metal cation concentrations.
These are all the equations necessary to describe the concentrations of all mobile species in step 2.
There are five controllable parameters: Vsr, Vfeed, SA, [H+]s, [SO42-]s; three experimentally determined parameters: PS,Mn, PS,Co, PS,Ni; and five initial conditions: [Mn2+]f, [Co2+]f, [Ni2+]f and two of [Mn2+]s, [Co2+]s, [Ni2+]s with the third being determined by charge balance from [SO42-]s. As was the case in step 1, ṅH2SO4
can be used to determine when it is time to introduce a new batch in the feed chamber.
2.3 Neutralization Precipitation with barium hydroxide (Step 3)
H+ cations compete with Li+ cations in step 4. In order to prevent this the lithium sulphate solution produced in step 3 must be neutralized. To prevent contamination of the final product it is necessary to neutralize with a base whose cation is not monovalent and preferably can be precipitated by sulphate.
Barium hydroxide satisfies both the requirement and the preference. The solubility product of barium sulphate is 1.08·10-10 (Haynes, 2015). Calcium hydroxide, although a more common neutralizing agent, is not used because its solubility is only 0.0216 M (compared with 0.287 M for barium hydroxide) (Haynes, 2015) and the solubility product of calcium sulphate is much higher, 4.93·10-5 (Haynes, 2015).
2.4 Donnan Dialysis to recover lithium as dissolved lithium bicarbonate(Step 4)
In step 4, the neutralized lithium sulphate solution from step 3 is stripped of lithium by potassium ions from a potassium bicarbonate solution1. The feed chamber is operated in batch mode and the stripping chamber is operated semi-continuously; inlet and outlet concentrations are constant but flowrate through the stripping chamber changes. A monovalent CEM separates the feed and stripping chamber.
The stripping chamber is under elevated carbon dioxide partial pressure to increase the solubility of lithium (see section 2.5 for more details). The stripping vessel in not emptied in between batches to maintain the constant concentrations.
There are some differences in step 4 from steps 1 and 2. In the feed vessel, the concentration of the stripping ion increases as dialysis proceeds since there is no reaction to remove it. By law of
electroneutrality though, the total cation concentration stays constant. In the stripping vessel, there is no potassium sensor to monitor its concentration or a controller to add fresh potassium to maintain a set concentration. Instead, the lithium concentration in the feed chamber is monitored continuously, such as with a lithium ion selective electrode for example, and is used to determine the inlet stripping solution flowrate necessary to maintain constant lithium and potassium concentrations (see Equation 16).
The flux of lithium through the CEM is given by Equation 15, where [Li+]f,initial refers to initial lithium concentration in the feed and [Li+]s,in and [K+]s,in refer to lithium and potassium concentrations respectively in the stripping solution entering the stripping vessel.
JLi= PS,Li∙ ([Li+[Li] +]f
f,initial −[Li+] [Li+]s
s,in+[K+]s,in ) (15)
The mass balance of lithium in the feed vessel is given by Equation 4. The mass balance of lithium in the stripping vessel is given by Equation 6. Rearranging Equation 6 to solve for the flowrate and letting the derivative equal zero gives Equation 16 for the flowrate needed to keep the lithium and potassium concentrations in the stripping vessel, [Li+]s and [K+]s respectively, constant.
Q =[Li+]JLi∙SA
s−[Li+]s,in=PS,Li∙(
[Li+]f
[Li+]f,initial −[Li+]s,in+[K+]s,in [Li+]s )∙SA [Li+]s−[Li+]s,in (16)
These are all the equations necessary to know all concentrations and flowrates in step 4. All that is needed are four specified variables, Vfeed, SA, [Li+]s, and [K+]s,in(or equivalently Ks); one initial condition,
1 Potassium was chosen as the stripping cation rather than sodium because the molar solubility of potassium carbonate is at least 2.3 times higher at temperatures between 20 and 40 °C than the molar solubility of sodium carbonate (Haynes, 2015).
[Li+]f, initial; and one experimentally determined parameter, PS,Li. Since the stripping solution is fully recycled after step 6, [Li+]s,in is the residual lithium concentration after step 5. Potassium concentration in the feed vessel is obtained by subtracting [Li+]f from [Li+]f,initial.
As lithium concentration in the feed tank decreases to a point at which it is no longer practical to
recover it, the batch is discarded and a new batch is introduced. The discarded batch is rich in potassium sulphate. It may be of economic interest to recover it, since it is a fertilizer, or to react it chemically into fresh potassium bicarbonate to be used to make new stripping solution.
2.5 Lithium carbonate precipitation (Step 5)
Lithium bicarbonate does not exist as a stable solid. Once the activity of lithium exceeds its solubility, supersaturated lithium precipitates as lithium carbonate (Perez et al., 2014; Ryabtsev et al., 2006; Yi et al., 2010). The lithium, potassium, carbon dioxide, and water system is governed by five equilibrium equations and one charge balance.
H2O (l)+CO2 (g)⇌ H2CO3 (aq) pKH = 1.47 (Lower, 1996) H2CO3 (aq)⇌ H+(aq)+ HCO3−
(aq) pK1 = 6.35 (Haynes, 2015)
HCO3−(aq)⇌ H+(aq)+ CO3−2
(aq) pK2 = 10.33 (Haynes, 2015)
2Li+(aq)+ CO3−
(aq)⇌ Li2CO3 (s) p(Ksp-1) = -3.089 (Haynes, 2015)
H2O (l)⇌ H+(aq)+ OH−(aq) pKw = 14 (Haynes, 2015)
[K+] + [Li+] + [H+] = [HCO3−] + 0.5 ∙ [CO3−2] + [OH−]
The equilibrium equations are combined and Equation 17 is obtained. The equation was tested experimentally by dissolving lithium sulphate in one solution and potassium bicarbonate in another solution and combining the solutions. Gas bubbles and a white precipitate, later identified by XRD as lithium carbonate, were obtained.
2Li+(aq)+ 2HCO3−
(aq)⇌ Li2CO3 (s)+H2O (l)+CO2 (g) (17)
Since carbon dioxide is a product in the precipitation reaction, Le Chatelier’s Principle dictates that as the partial pressure of carbon dioxide increases the solubility of lithium increases. Using the five equilibrium equations and charge balance equation, solubilities of lithium in potassium bicarbonate solutions at elevated carbon dioxide partial pressures were calculated. It was found that at PCO2 of 3.55·10-5 atm and [K+] of 1, 2, and 3 M the solubilities of lithium were 0.041, 0.029, and 0.024 M respectively. At PCO2 of 1 atm and [K+] of 1, 2, and 3 M the solubility of lithium was 0.38, 0.23, 0.17 M respectively. Potassium, even at 3 M, does not reach its solubility limit.
The concentration of lithium in the stripping chamber of step 4 is maintained higher than the solubilities at ambient carbon dioxide partial pressure but lower than the solubility at 1 atm. The stripping vessel is pressurized with 1 atm to avoid precipitation of lithium inside it. In step 5, stripping solution exiting the
stripping vessel is vented, which supersaturates the solution with lithium and leads to precipitation of lithium carbonate. The lithium carbonate is filtered, washed, and dried and is the final desired product.
In industry, a very similar process is used in the purification of lithium carbonate. Crude lithium
carbonate from a brine operation is dissolved by pressurizing with carbon dioxide. Impurities are filtered out. The remaining solution is vented and heated to 95 °C, which precipitated lithium carbonate. To obtained solid is filtered, washed, and dried. The final purity obtained is 99.51% (Perez et al., 2014).
Kinetics of the precipitation reaction have been investigated for a system free of potassium (Yi et al., 2010) and suggest that increasing temperature increases precipitation rate. Whether or not heating should be used to accelerate the precipitation and what the final purity of lithium carbonate obtained will be topics for a future study. It is reasonable to expect however, that compared to conventional precipitation with sodium carbonate, a higher purity will be obtained since the lithium has already passed through two monovalent CEMs and it precipitates from a solution of potassium bicarbonate, which is much more soluble than sodium carbonate. It is important, of course, that the potassium bicarbonate used be as pure as possible to avoid introducing impurities.
2.6 Recycling of stripping solution (Step 6)
In step 6 the solution remaining after lithium carbonate has been precipitated and filtered is re-
pressurised with carbon dioxide, replenished with potassium bicarbonate, and re-used in its entirety as fresh stripping solution in step 6. Since it is reused in its entirety the percent of lithium that precipitates during step 5 does not affect the lithium recovery of the whole process but only affects carbon dioxide and energy requirements. The only factors that affect lithium recovery is the amount of lithium that does not make it through the CEMs in steps 1 and 4.
3. Experimental
3.1 Procedure and Apparatus
Ps values were determined experimentally at various concentrations of cations and pH values for steps 1, 2, and 4. Experiments were conducted in two stirred acrylic chambers separated by a circular
membrane (see Figure 2). The membrane was sealed in place by two circular O-rings of diameter 0.3782 dm. The membrane area was thus 0.11234 dm2.
Figure 2: Donnan dialysis experimental apparatus
Stripping vessel Feed vessel
The membranes used were CMS C-1805 Neosepta monovalent CEM and CMX C-1586 Neosepta polyvalent CEM; both from Astom Corporation of Japan. The membrane thicknesses, electrical
resistances, and burst strengths, as reported by the manufacturer, were 0.15 mm, 1.8 Ω·cm2, ≥ 0.10 MPa respectively for the CMS membrane and 0.17 mm, 3.0 Ω·cm2, and ≥ 0.40 MPa respectively for the CMX membrane. The recommended pH range and maximum operating temperature for both membranes was 0 to 10 and 40 °C respectively.
The reagents used were lithium sulphate monohydrate, min 99.0% w/w; cobalt (II) sulphate
heptahydrate, min 99.0 % w/w; nickel (II) sulphate hexahydrate, 99.0 to 102.0 % w/w; manganese (II) sulphate pentahydrate, min 99.0 % w/w; potassium hydrogen carbonate, 99.3 to 100.5 % w/w; 10 M sulphuric acid (prepared from min 95.0 % stock); and 1000 ppm ICP-OES standards of the above cations for calibration standards. Additionally, 1000 ppm lutetium ICP-OES standard and 1000 ppm iodine ICP- OES standard were used, diluted, as internal standards in experiments with sulphuric acid and potassium bicarbonate respectively. All chemicals were from Wako Pure Chemical Industries, Japan.
Three sets of experiments were conducted, all at 27°C. In the first set, Li, Co, Ni, and Mn sulphates, in a 3:1:1:1 molar ratio, were dissolved in 1L of 0.005 M H2SO4 solution (molarity chosen so as to
approximately replicate the pH of a weak acid cathode leaching solution) and placed in the feed vessel.
The total dissolved cation concentration varied between 0.030 M and 0.570 M. 1L of sulphuric acid, of molarity between 0.05 and 0.45, was placed in the stripping vessel. Both sides contained 1 ppm (mg/L) Lu as an internal standard. A monovalent CEM separated the two solutions. Samples were taken periodically from the acid chamber and analysed by a Shimadzu ICPS-7000 version 2 sequential plasma spectrometer. The standards used to calibrate the ICP were mixed standards of Li, Co, Ni, Mn of 20, 10, 5, 1, and 0 ppm in solutions of 0.250 M H2SO4 and 1 ppm Lu. The calibration was linear. The wavelengths used were 221.647 nm, 228.616 nm, 257.610 nm, 261.542 nm, and 610.364 nm for Ni, Co, Mn, Lu, and Li respectively. These were chosen so as to have well shaped peaks free of spectral interferences. The stability of the spectrometer was verified by analyzing known standards every 8 to 10 samples. No significant drift was observed.
In the second set of experiments, Co, Ni, and Mn sulphates in a 1:1:1 molar ratio were used and the total dissolved cation concentration was varied between 0.015 M and 0.285 M. Polyvalent CEM was used to separate the feed solution from the stripping solution. All other aspects were as before.
In the third set of experiments, lithium sulphate solutions of between 0.015 to 0.285 M were placed in the feed vessel. KHCO3 solutions of 200.00 g/L at 27 °C were made and placed in the stripping vessel.
Mixed standards were prepared which contained 20 and 200 ppm, 10 and 100 ppm, 5 and 50 ppm, 1 and 10 ppm, and 0 and 0 ppm Li and K respectively. All experimental solutions and standards also contained 50 ppm iodine as an internal standard. Samples were periodically taken from both vessels.
Those from the feed vessel were analyzed for K while those from the stripping vessel were analyzed for Li. Analysis was done with a Shimadzu ICPS-7510 sequential plasma spectrometer and the wavelengths used were 610.364 and 670.785 nm for Li and K respectively. Since the samples had a very high
dissolved salt concentration, they were diluted prior to analysis with deionized water free of iodine. The exceptions were samples from the feed vessel when the lithium concentration was 0.015M, which were already dilute enough to analyse. To mitigate dilution errors, the instrument’s internal standard method was used. The instrument was programed to expect a signal corresponding to 50 ppm I in each sample.
For every diluted sample, the instrument recorded a lower iodine signal and then multiplied all signals, including the analytes’, by a singular factor to achieve the iodine signal expected. It was separately verified that iodine has a linear response up to 50 ppm, potassium up to 200 ppm and lithium up to 20 ppm. Stability of the spectrometer was assured as before.
In all three phases, both sides of the membrane were well stirred to ensure that the only significant resistance to mass transfer was diffusional resistance through the membrane itself. In order to test that this was achieved the stirring power was reduced by half in the middle of one of the replicate
experiments from every phase to see what effect, if any, the change had on flux. As can be seen from the linear plots in section 4.1 no effect was observed, thus proving that the only limitation to mass transfer was diffusional resistance from the membrane.
3.2 Analysis method
A mass balance on cation M diffusing into the stripping vessel was given by Equation 18
𝑑[𝑀]𝑠
𝑑𝑡 = +𝐽𝑀∙𝑉𝑆𝐴
𝑓𝑒𝑒𝑑 (18) The flux term was replaced with Equation 1 to obtain Equation 19.
𝑑[𝑀]𝑠 𝑑𝑡 =𝑉𝑆𝐴
𝑓𝑒𝑒𝑑𝑃𝑆,𝑀∙ (∑ 𝜈𝜈𝑀∙[𝑀]𝑓
𝐶,𝑓∙[𝐶]𝑓 −∑ 𝜈𝜈𝑀∙[𝑀]𝑠
𝐶,𝑠∙[𝐶]𝑠) (19)
Since the concentrations of M in the stripping vessel remained very low during the experiments, the term to the right of the minus was zero for all practical purposes. The concentration of M in the feed was chosen high enough that it would not measurably diminish over the course of an experiment.
Therefore, flux was constant and the derivative in Equation 19 was a constant given by the slope of [M]s
vs. time. PS,M was given by Equation 20, where m is the aforementioned slope.
𝑃𝑆,𝑀 = 𝑚 ∙𝑉𝑓𝑒𝑒𝑑
𝑆𝐴 ∙∑ 𝜈𝐶,𝑓∙[𝐶]𝑓
𝜈𝑀∙[𝑀]𝑓 (20) 4. Results and discussion
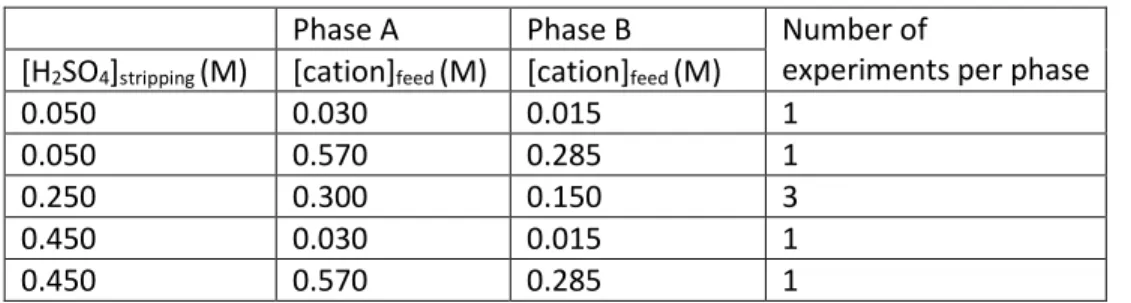
Phases A and B consisted of seven experiments each: three midpoint replicates and four corner experiments from a two factorial experimental design examining the effects of total cation
concentration in the feed chamber and acid concentration in the stripping chamber (see Table 1 for experimental conditions).
Table 1: Experimental conditions for phases A and B
Phase A Phase B Number of
experiments per phase [H2SO4]stripping(M) [cation]feed(M) [cation]feed(M)
0.050 0.030 0.015 1
0.050 0.570 0.285 1
0.250 0.300 0.150 3
0.450 0.030 0.015 1
0.450 0.570 0.285 1
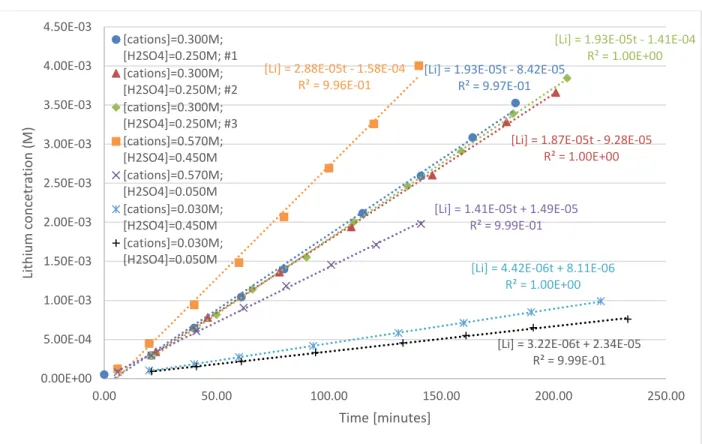
4.1 Phase A (step1)
Figure 3 shows the lithium concentrations obtained over time in the seven experiments as well as the slopes obtained.
Figure 3: Lithium concentrations in stripping vessel vs. time in phase A experiments
The flux of divalent cations through the monovalent CEM was less than 200 times that of lithium (see Figure 1 in Supplementary Material for example), which verifies that the monovalent CEM achieves excellent separation of Li from the divalent cations.
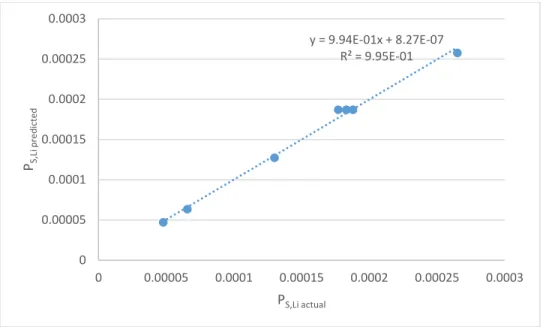
The PS,Li values obtained were fitted with several statistical models: linear, reciprocal, logarithmic, and arctan. The independent variables were lithium concentration in the feed and sulphuric acid
concentration in the stripping solution. An interaction term was also included. The only model that provided a satisfactory fit to the data was the logarithmic model given in Equation 21. PS,Li is in mol·dm-2·min-1 and the concentrations are in M.
𝑃𝑆,𝐿𝑖 = 4.05 ∙ 10−4+ 8.14 ∙ 10−5∗ 𝑙𝑛[𝐻2𝑆𝑂4]𝑠+ 7.99 ∙ 10−5∗ 𝑙𝑛[𝐿𝑖]𝑓+ 1.76 ∙ 10−5∗ 𝑙𝑛[𝐻2𝑆𝑂4]𝑠∗ 𝑙n[𝐿𝑖]𝑓 (21)
All parameters in the model were statistically significant. The predicted vs. actual plot in Figure 4 shows a very high quality fit.
[Li] = 1.93E-05t - 8.42E-05 R² = 9.97E-01
[Li] = 1.87E-05t - 9.28E-05 R² = 1.00E+00
[Li] = 1.93E-05t - 1.41E-04 R² = 1.00E+00 [Li] = 2.88E-05t - 1.58E-04
R² = 9.96E-01
[Li] = 1.41E-05t + 1.49E-05 R² = 9.99E-01
[Li] = 4.42E-06t + 8.11E-06 R² = 1.00E+00
[Li] = 3.22E-06t + 2.34E-05 R² = 9.99E-01 0.00E+00
5.00E-04 1.00E-03 1.50E-03 2.00E-03 2.50E-03 3.00E-03 3.50E-03 4.00E-03 4.50E-03
0.00 50.00 100.00 150.00 200.00 250.00
Lithium concetration (M)
Time [minutes]
[cations]=0.300M;
[H2SO4]=0.250M; #1 [cations]=0.300M;
[H2SO4]=0.250M; #2 [cations]=0.300M;
[H2SO4]=0.250M; #3 [cations]=0.570M;
[H2SO4]=0.450M [cations]=0.570M;
[H2SO4]=0.050M [cations]=0.030M;
[H2SO4]=0.450M [cations]=0.030M;
[H2SO4]=0.050M
Figure 4: predicted vs. actual PS,Li in phase A experiments
A comparison of the above empirical model was made with literature. Hasson et. al (Hasson et al., 2014) reported linear increases in PS values with increases in feed cation concentration. However, the
concentrations examined in that study were far lower, 1 to 5 mM. Since the membrane only has a limited number of sites that can accommodate cations, it is logical that, as feed and stripping cation concentrations increase, the membrane becomes saturated and the diffusion kinetic coefficient increases less than linearly.
In another study the feed contained 3.03·10-2 M Na and the stripping solution was varied from 0.05 to 1 M HCl (Cengeloglu et al., 2003). A CMX Neosepta membrane along with a similar procedure and
apparatus as in the present work were used. We calculated PS,Na values from the flux data presented and found that a logarithmic model fit the data best as well.
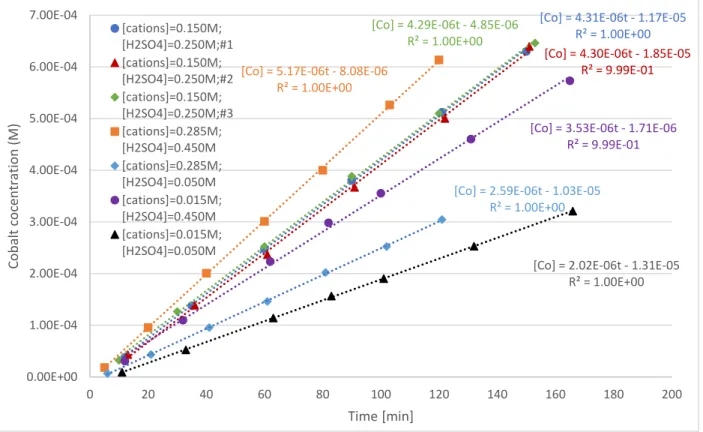
4.2 Phase B (step 2)
Figure 5 shows the cobalt concentrations obtained in the stripping vessel. The manganese and nickel plots were nearly identical and are presented in the supplementary material.
y = 9.94E-01x + 8.27E-07 R² = 9.95E-01
0 0.00005 0.0001 0.00015 0.0002 0.00025 0.0003
0 0.00005 0.0001 0.00015 0.0002 0.00025 0.0003
PS,Li predicted
PS,Li actual
Figure 5: Cobalt concentrations in stripping vessel vs. time in phase B experiments
As in section 4.1, among the four same models types tested only logarithmic models fit Ps data well. The quality of fit was equally as satisfactory as in the phase A experiments.
PS,Mn= 1.54 ∙ 10−4+ 2.26 ∙ 10−6∗ ln[Mn]f+ 3.07 ∙ 10−5∗ ln[H2SO4]s+ 1.15 ∙ 10−6∗ ln[Mn]f∗ ln[H2SO4]s (22)
PS,Co= 1.80 ∙ 10−4+ 6.51 ∙ 10−6∗ ln[Co]f+ 3.70 ∙ 10−5∗ ln[H2SO4]s+ 2.33 ∙ 10−6∗ ln[Co]f∗ ln[H2SO4]s (23)
PS,Ni = 1.83 ∙ 10−4+ 6.69 ∙ 10−6∗ ln[Ni]f+ 3.77 ∙ 10−5∗ ln[H2SO4]s+ 2.43 ∙ 10−6∗ ln[Ni]f∗ ln[H2SO4]s (24)
4.3 Phase C (step 4)
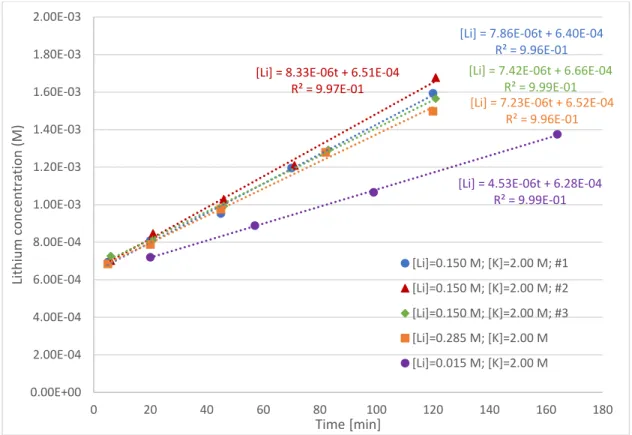
Phase C consisted of five experiments where lithium concentration in the feed was 0.015 M, 0.150 M (three replicates), and 0.285 M. Potassium concentration in the stripping vessel was 2.00 M in all experiments. Figures 6 and 7 present the lithium concentrations in the stripping vessel and the potassium concentrations in the feed vessel respectively.
[Co] = 4.31E-06t - 1.17E-05 R² = 1.00E+00 [Co] = 4.30E-06t - 1.85E-05
R² = 9.99E-01 [Co] = 4.29E-06t - 4.85E-06
R² = 1.00E+00 [Co] = 5.17E-06t - 8.08E-06
R² = 1.00E+00
[Co] = 2.59E-06t - 1.03E-05 R² = 1.00E+00
[Co] = 3.53E-06t - 1.71E-06 R² = 9.99E-01
[Co] = 2.02E-06t - 1.31E-05 R² = 1.00E+00
0.00E+00 1.00E-04 2.00E-04 3.00E-04 4.00E-04 5.00E-04 6.00E-04 7.00E-04
0 20 40 60 80 100 120 140 160 180 200
Cobalt cocentration (M)
Time [min]
[cations]=0.150M;
[H2SO4]=0.250M;#1 [cations]=0.150M;
[H2SO4]=0.250M;#2 [cations]=0.150M;
[H2SO4]=0.250M;#3 [cations]=0.285M;
[H2SO4]=0.450M [cations]=0.285M;
[H2SO4]=0.050M [cations]=0.015M;
[H2SO4]=0.450M [cations]=0.015M;
[H2SO4]=0.050M
Figure 6: Lithium concentrations in stripping vessel vs. time in phase C experiments
Figure 7: Potassium concentrations in feed vessel vs. time in phase C experiments
[Li] = 7.86E-06t + 6.40E-04 R² = 9.96E-01 [Li] = 8.33E-06t + 6.51E-04
R² = 9.97E-01
[Li] = 7.42E-06t + 6.66E-04 R² = 9.99E-01 [Li] = 7.23E-06t + 6.52E-04
R² = 9.96E-01
[Li] = 4.53E-06t + 6.28E-04 R² = 9.99E-01
0.00E+00 2.00E-04 4.00E-04 6.00E-04 8.00E-04 1.00E-03 1.20E-03 1.40E-03 1.60E-03 1.80E-03 2.00E-03
0 20 40 60 80 100 120 140 160 180
Lithium concentration (M)
Time [min]
[Li]=0.150 M; [K]=2.00 M; #1 [Li]=0.150 M; [K]=2.00 M; #2 [Li]=0.150 M; [K]=2.00 M; #3 [Li]=0.285 M; [K]=2.00 M [Li]=0.015 M; [K]=2.00 M
[K] = 1.00E-05t + 1.41E-04 R² = 9.96E-01 [K] = 1.02E-05t + 1.31E-04
R² = 1.00E+00
[K] = 9.69E-06t + 1.68E-04 R² = 9.97E-01
[K] = 9.90E-06t+ 3.80E-04 R² = 9.99E-01
[K] = 5.47E-06t + 1.14E-05 R² = 1.00E+00
0.00E+00 2.00E-04 4.00E-04 6.00E-04 8.00E-04 1.00E-03 1.20E-03 1.40E-03 1.60E-03 1.80E-03 2.00E-03
0 20 40 60 80 100 120 140 160 180
Potassium concentration [M]
Time [min]
[Li]=0.150 M; [K]=2.00 M; #1 [Li]=0.150 M; [K]=2.00 M; #2 [Li]=0.150 M; [K]=2.00 M; #3 [Li]=0.285 M; [K]=2.00 M [Li]=0.015 M; [K]=2.00 M
The intercepts obtained, unlike in the previous two phases, were not close to zero. It is most likely this was an artefact of the dilution of the samples. This hypothesis was supported by the fact that the samples with the highest dilution showed the highest intercepts: all samples in Figure 6 were diluted 30 fold; in Figure 7 [Li]=0.285 M samples were diluted 3 fold, [Li]=0.150 M samples were diluted between 0.5 and 2 fold, and [Li]=0.015 M samples were not diluted at all. In the undiluted samples the intercept obtained was not statistically significant at the 95% confidence level.
The fluxes of lithium and potassium from the [Li]feed=0.285 [K]stripping= 2M experiment were not statistically different than the fluxes from the [Li]feed=0.150 [K]stripping= 2M experiments. A logical explanation for this result is that the potassium flux obtained was the largest potassium flux the membrane could accommodate with a 2M potassium solution on the stripping side. Since lithium and potassium fluxes are coupled, any increase in lithium in the feed solution beyond the ability of the membrane to conduct potassium from the stripping side would not result in an increase in lithium flux.
Therefore, in determining a statistical model for PS,Li from the data in phase C, only data from [Li]feed = 0.150 and 0.015 M was used. It is of course possible that the maximum possible lithium flux occurred at a lithium feed concentration lower than 0.150M. As such, the statistical model below represents minimum values of PS,Li and PS,K.
PS,Li= 9.46 ∙ 10−5+ 1.29 ∙ 10−5∗ ln (Li) (25) PS,K= 1.216 ∙ 10−4+ 1.74 ∙ 10−5∗ ln (Li) (26)
An unexpected result was that the flux of potassium ions was consistently higher than the flux of lithium ions, circa 20% higher. As previously explained, the theory predicts that these should be equal in order to maintain the electroneutrality of the solutions. With the fluxes equal and the feed solutions initially pure solutions, the PS value should also be equal. The higher than expected potassium flux does not invalidate the theory developed in section 2.4, but rather it suggests that the PS values obtained in phase C are not so well known. Since PS,Li values were consistently lower than the PS,K values, the former were used in the process simulation in section 5.3 and a conservative simulation of Donnan dialysis kinetics was obtained.
5. Simulation of the Donnan dialysis steps of the process
A simulation was conducted to determine the kinetics and theoretical recoveries of Li, Mn, Ni and Co during the three Donnan dialysis steps of the proposed process. The basis of the simulation was: 1) a 1000 L solution of pH 2 leachate with 27.49 g·L-1 dissolved Li3NiCoMnO6 (M.W. 289.384 g·mol-1) (total dissolved metal cations 0.570 M), 2) stripping solutions in steps 1 and 2 with [H+]=0.90 M, and 3) a stripping solution with [K+]=2.00 M in step 4. The simulation outputs were predicted concentrations with time in the feed vessels, which were used to calculate recoveries. Varied parameters were membrane size (expressed as surface area to feed volume ratio) and stripping solution metal cation concentrations.
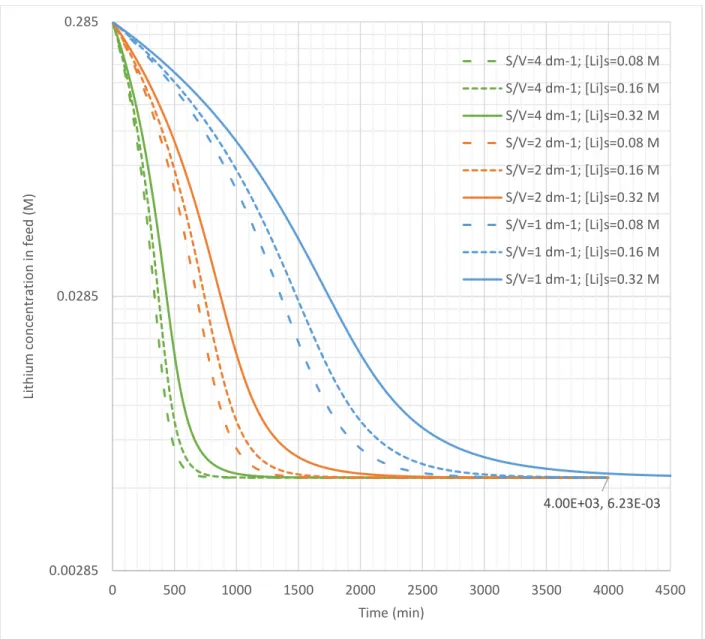
5.1 Step 1
The membrane surface area to feed volume ratios examined in the step 1 simulation were 1, 2, and 4 dm-1. These ratios correspond to diameters of 40, 20, and 10 cm respectively in a cylindrical vessel. The effluent stripping solution lithium concentrations examined were 0.08, 0.16, and 0.32 M. Figure 8 presents the results.
Figure 8: Step 1 simulation of lithium concentration in the feed tank with time
The final concentration in all cases was 6.23 mM, which corresponds to a 97.8% recovery at the studied initial lithium feed concentration. Since the final feed concentration is not affected by the lithium concentration in the stripping solution, the simulation predicts that flux ceases when PS,Li tends towards zero rather than when the gradient in Equation 3 is zero.
The kinetic trends in Figure 8 are as expected from Equation 3: ultimate recovery is achieved faster if membrane area increases or concentration of lithium in the stripping solution decreases.
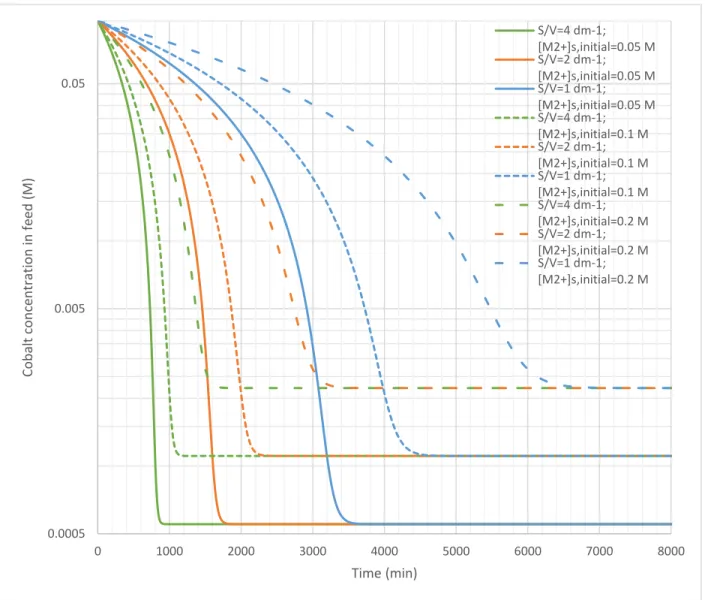
5.2 Step 2
The feed in the step 2 simulation was the same as for step 1 except that there were no lithium ions. The sulphate concentration in the stripping vessel was set to 0.6, 0.75, and 1.05 M. The initial concentrations of divalent cations were set equal to each other and the volume of the stripping vessel was set equal to
4.00E+03, 6.23E-03
0.00285 0.0285 0.285
0 500 1000 1500 2000 2500 3000 3500 4000 4500
Lithium concentration in feed (M)
Time (min)
S/V=4 dm-1; [Li]s=0.08 M S/V=4 dm-1; [Li]s=0.16 M S/V=4 dm-1; [Li]s=0.32 M S/V=2 dm-1; [Li]s=0.08 M S/V=2 dm-1; [Li]s=0.16 M S/V=2 dm-1; [Li]s=0.32 M S/V=1 dm-1; [Li]s=0.08 M S/V=1 dm-1; [Li]s=0.16 M S/V=1 dm-1; [Li]s=0.32 M
the feed vessel2. The same membrane surface area to feed volume ratios examined in section 5.1 were used. Figure 9 presents the results for cobalt; the figures for manganese and nickel are indistinguishable from it, which signifies identical kinetics and recoveries.
Figure 9: Step 2 simulation of cobalt concentration in the feed tank with time
The kinetic trends were the same as in section 5.1. Unlike those results, the final feed concentrations were affected by stripping divalent cation concentrations. This indicates that flux reaches zero when the gradient in Equation 8 reaches zero. The final feed concentration of any divalent cation simulated was 0.57 mM, 1.12 mM, and 2.23 mM when its stripping tank concentration was 0.050 M, 0.10 M, and 0.20 M respectively. These feed concentrations correspond to recoveries of 99.4 %, 98.8 %, 97.7 %
respectively. It is evident that higher recoveries are predicted when the stripping concentration is lower.
2 Various stripping vessel volumes and initial concentration of divalent cation therein were simulated. The results are not included but they show that, for stripping vessel volumes greater or equal to the feed vessel’s volume, divalent cation concentrations in the stripping vessel converge to equal each other after five batches are processed.
0.0005 0.005 0.05
0 1000 2000 3000 4000 5000 6000 7000 8000
Cobalt concentration in feed (M)
Time (min)
S/V=4 dm-1;
[M2+]s,initial=0.05 M S/V=2 dm-1;
[M2+]s,initial=0.05 M S/V=1 dm-1;
[M2+]s,initial=0.05 M S/V=4 dm-1;
[M2+]s,initial=0.1 M S/V=2 dm-1;
[M2+]s,initial=0.1 M S/V=1 dm-1;
[M2+]s,initial=0.1 M S/V=4 dm-1;
[M2+]s,initial=0.2 M S/V=2 dm-1;
[M2+]s,initial=0.2 M S/V=1 dm-1;
[M2+]s,initial=0.2 M
The choice of which concentration is desired in the stripping solution depends on the requirements of the solvent extraction processes that follow.
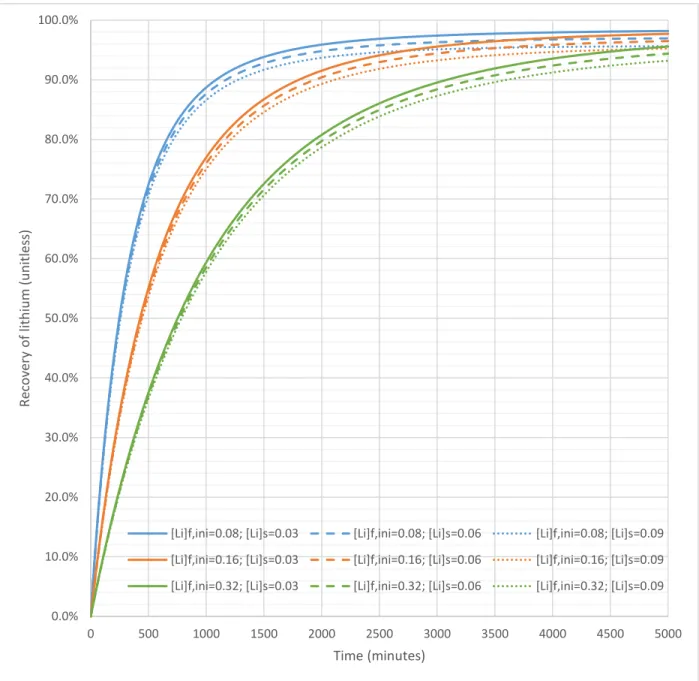
5.3 Step 4
Based on preliminary results an abridged analysis was performed for step 4. Vfeed was set to 1000 L, SA was set to 4000 dm-2, and Ks was set to 2M. Lithium feed vessel concentrations investigated were 0.080, 0.16, and 0.32 M. Lithium stripping vessel concentrations were 0.03, 0.06, 0.09 M. Figure 10 presents simulated recovery of lithium as a function of time.
Figure 10: Recovery of lithium vs. time in step 4
Higher lithium concentrations in the feed and, to a lesser degree, the stripping vessel slowed down Donnan dialysis. Ultimate lithium recovery was not affected by initial concentration of lithium in the
0.0%
10.0%
20.0%
30.0%
40.0%
50.0%
60.0%
70.0%
80.0%
90.0%
100.0%
0 500 1000 1500 2000 2500 3000 3500 4000 4500 5000
Recovery of lithium (unitless)
Time (minutes)
[Li]f,ini=0.08; [Li]s=0.03 [Li]f,ini=0.08; [Li]s=0.06 [Li]f,ini=0.08; [Li]s=0.09 [Li]f,ini=0.16; [Li]s=0.03 [Li]f,ini=0.16; [Li]s=0.06 [Li]f,ini=0.16; [Li]s=0.09 [Li]f,ini=0.32; [Li]s=0.03 [Li]f,ini=0.32; [Li]s=0.06 [Li]f,ini=0.32; [Li]s=0.09
feed vessel. The ultimate recovery was 98.52, 97.09, and 95.69% when stripping vessel lithium concentration was 0.03, 0.06, and 0.09 M respectively.
5.4 Recovery from the proposed process
The simulations showed that the slowest Donnan dialysis step in the proposed process was step 4; it is therefore the rate-determining step of the proposed process. Looking at a timeframe of 2880 minutes (2 days) the simulations predicted: a recovery of lithium in step 1 of 97.8% with S/V=1 dm-1 and [Li+]s = 0.08 M; recoveries of manganese, cobalt, and nickel in step 2 of 99.4% with S/V=2 dm-1 and [M2+]s = 0.05 M;
and a recovery of lithium in step 4 of 96.2% with S/V=4 dm-1, [Li+]f,ini = 0.08 M, and [Li+]s = 0.06 M.
The simulation predicted that in two days the proposed system is capable of processing 1000 L of leachate containing 285 moles of lithium, 95 moles each of cobalt, nickel, and manganese, with 5000 dm2 of CMS C-1805 Neosepta monovalent CEM and 2000 dm2 of CMX C-1586 Neosepta polyvalent CEM.
Assuming no losses in steps 3, 5, and 6, 94.1% of the lithium in the leachate is predicted to be recovered as lithium carbonate and 99.4% of the transition metals as mixed sulphates ready for solvent extraction.
At a minimum 422.6 moles of pure sulphuric acid and 268 moles of potassium bicarbonate are needed to achieve these recoveries.
6. Conclusions
A novel process for separating and recovering lithium from organic acid leachate has been proposed.
The process uses Donnan dialysis and precipitation by depressurization of carbon dioxide. The governing equations of the process have been developed. Overall mass transfer coefficients have been found by experiment. Using the equations and experimental results, the process has been simulated and the predictions are promising enough to warrant further investigation of the process.
Acknowledgements:
The authors gratefully acknowledge Sho Yoshida, Naoki Ninomiya, and Ryo Suzuki for their assistance with ICP-OES measurements and conducting the experiments. The authors also thank the Japanese Society for the Promotion of Science and the National Science and Engineering Research Council of Canada for funding the work.
References:
Agarwal, C., Goswami, A., 2016. Nernst Planck approach based on non-steady state flux for transport in a Donnan dialysis process. J. Memb. Sci. 507, 119–125. doi:10.1016/j.memsci.2016.02.021
Ariza, M.J., Caas, a., Benavente, J., 2001. Electrokinetic and electrochemical characterizations of porous membranes. Colloids Surfaces A Physicochem. Eng. Asp. 189, 247–256. doi:10.1016/S0927-
7757(01)00587-8
Cengeloglu, Y., Kir, E., Ersoz, M., Buyukerkek, T., Gezgin, S., 2003. Recovery and concentration of metals from red mud by Donnan dialysis. Colloids Surfaces A Physicochem. Eng. Asp. 223, 95–101.
doi:10.1016/S0927-7757(03)00198-5
Chagnes, A., Pospiech, B., 2013. A brief review on hydrometallurgical technologies for recycling spent lithium-ion batteries. J. Chem. Technol. Biotechnol. 88, 1191–1199. doi:10.1002/jctb.4053 Chen, X., Chen, Y., Zhou, T., Liu, D., Hu, H., Fan, S., 2015. Hydrometallurgical recovery of metal values