Network: Search for Sustainable Urban Form
著者 Zhang Ming
journal or
publication title
International Review for Spatial Planning and Sustainable Development
volume 1
number 1
page range 1‑17
year 2013‑01‑01
URL http://hdl.handle.net/2297/33109
1
http://hdl.handle.net/2297/32453?locale=en
Copyright@SPSD Press from 2010, SPSD Press, Kanazawa
On the Cul-de-Sac vs. Checker-Board Street Network:
Search for Sustainable Urban Form
Ming Zhang
Ph.D., AICP, Associate Professor, Community and Regional Planning, University of Texas at Austin, Austin, TX 78712, USA, E-mail: [email protected],Tel.: 512-471-0139, FAX.:
512-471-0716
Key words: Street network, connectivity, measure and neighborhood
Abstract: The study revisited the largely accepted idea to deal with sprawl by replacing cul-de-sac/curve-linear street with the traditional checkerboard system in community design. Recent discussions suggest that a neighborhood with cul- de-sac street pattern can promote accessibility and street connectivity, if it is designed integrated with open space and pedestrian paths, while creating safe and quiet residential environments. A good example is the discarded old wisdom, the Radburn. To date, the past researchers did not acknowledge the potential of the cul-de-sac neighborhoods in achieving the benefits New Urbansits strive to accomplish. This study tried to fill this gap by comparing a conventional suburban neighborhood, a neighborhood with creative cul-de-sac street pattern, and the grid street neighborhood.
1. INTRODUCTION
Cul-de-sacs and curve-linear streets present an iconic built environmental form of American suburban communities. Since the New Urbanism movement however, the cul-de-sac and curvature form has been under attack. Frequently the form features are used as visual illustration of suburban sprawl and are often tied to such sprawl-related problems as excessive driving and emissions, lack of place identity, and growing sedentary life style that increases obesity and health risks. In search for sustainable built environmental form, many planners/designers have advocated the traditional checker-board type of grids as an alternative to the conventional lollipop type of curvature; Grids are believed to improve connectivity and walkability that are largely lacking in the conventional cul- de-sac/curve-linear street network. Nevertheless, whether grids can outperform cul-de-sacs in achieving desired sustainable outcome (travel related) remains a topic of debate among scholars and practitioners. Better informing the debate motivated the study presented in this paper.
This paper first explains in retrospect the ideas of cul-de-sac and checker-
board streets as vocabularies for community design. It then analyzes and
compares their traffic and access characteristics through case study of three
neighborhoods, Houston Heights, the Woodlands, and the Grand Lakes, all
located in the greater Houston, Texas area. Houston Heights has a distinctive
grid of street network, whereas the Woodlands and the Grand Lakes follow the conventional hierarchical street network full of cul-de-sacs. The Grand Lakes neighborhood differs from the Woodlands mainly in that the cul-de- sacs in the Grand Lakes have open ends leading to green and open spaces by pedestrian and bike paths. With applications of geographic information system (GIS) tools, the study calculates and examines the metrics of built environmental characteristics of the three neighborhoods using the following performance indicators: average trip distance among all households, average paved street length per person, alpha index of network connectivity, link- node ratio, directness of pedestrian/cyclist routes, and pedestrian catchments area. Implications are drawn from the study findings in regards to designing and developing sustainable urban form.
2. THE CUL-DE-SAC IN THE CONVENTIONAL SUBURBAN NEIGHBORHOODS
The neighborhood street is a multi-functional space that serves a variety of purposes. It has a traffic-carrying function to serve the movement of people and freight and the delivery of public services (e.g., fire, postal, and ambulance). It can be a place of social interaction for children and adults.
Very often it functions as a border line delineating property rights and separating/linking different uses of land blocks. Furthermore, it has been a holding space for public facilities such as sewer and power lines and communication networks. To ensure proper functions of streets, local governments and professional organizations often establish rules or standards, for example, the subdivision ordinances adopted by most municipalities or the street design standards and guidelines provided by the Institute of Transportation Engineers. Reforming street network systems inevitably involves reform of these ordinances and design standards.
2.1 Cul-de-sac in the Radburn plan
Clarence Stein and Henry Wright first proposed the cul-de-sac in the Radburn design. The overall design of the Radburn was based on the concept of the neighborhood unit that Clarence Perry advocated. Based on Perry’s concept, the Radburn was planned for 7,500 to 10,000 populations that is the most desirable number of pupils in a school. The whole community was laid out with a half mile radius, centering on elementary schools and playgrounds. Each section of the Radburn had its own shopping center.
The main concern of the designers of the Radburn was that the increasing
automobiles made typical checkerboard street obsolete for living (Stein,
1967). Since drivers could see ahead on the uninterrupted road in the
checkerboard pattern, the streets would equally invite through traffic into
neighborhoods and threaten pedestrian safety. To mitigate the negative
impact of automobiles on neighborhoods, Stein and Wright designed a
hierarchical street system for each street to serve its own specialized function
(Lee and Stabin-Nesmith, 2001; Lee and Ahn, 2003). The system consisted
of express highway to connect outside communities, major arterials to
connect sections of the community, collector roads around superblocks, and
local streets (cul-de-sacs) only for accessing each house. The cul-de-sac
streets were narrower and lighter (18-20 feet wide) than the collector roads.
Stein and Wright suggested cul-de-sacs strictly for car access to each house, and pedestrian paths were completely separated from vehicles.
Pedestrian circulation system was formulated in the interior parks at the center of superblock and provided children with access to schools and recreations while protecting children from the danger of automobiles. the open spaces in each superblock were connected through underpasses, thereby creating a continuous pedestrian and open space system in the entire neighborhood (Parsons, 1990). Furthermore, the hierarchical street system was more cost-effective. Stein (1957) indicated that the paved area for the street and the length of utilities were 25 percent less than the grid street plan.
The savings from less pavement costs were paid for acquiring land for the interior parks in the superblocks (Handy et al., 2003).
2.2 The Street Design Standards by the Federal Highway Administration (FHA)
The FHA provided series of suggestions for development layout in 1930s. Although developers were not mandated to follow those standards, the FHA could reject loans in areas where the prescription of the subdivision design standard set by the administration was not complied (Handy et al., 2003). The series of publications and bulletins of the FHA clearly demonstrated that the administration rejected the idea of the grid pattern for residential neighborhood (Southworth and Ben-Joseph, 1995; Southworth and Parthasarathy, 1996; Handy et al., 2003). Also, the gridiron street system would increase traffic accidents, since the traffic would disperse equally through the area. Additionally, the FHA was concerned about a monotonous and dull suburban landscape created by the grid street pattern (Southworth and Ben-Joseph, 1995).
Based on these reasons, the FHA expressed strong preference towards Stein’s concept in terms of street design, and the FHA recommended a hierarchical street system with cul-de-sacs for residential developments.
Institute of Transportation Engineers (ITE) also exert strong influence on suburban street layout through series of standards and publications. The ITE supported the hierarchical street system of the FHA standards. Concerned with efficient vehicular movement and street safety, the ITE recommended 1) limited access to the perimeter highway; 2) discontinuous local streets to discourage through traffic; 3) street design with curvilinear cul-de-sac alignments; and 4) numerous three leg T intersections (Southworth and Ben- Joseph, 1995; Southworth and Parthasarathy, 1996).
The FHA standards failed to incorporate the key Radburn design concept
of the public open space and separate pedestrian circulation system
(Southworth and Parthasarathy, 1996). That is, while the main idea for the
FHA street standards is originated from the Radburn plan, its comprehensive
design concept was not incorporated into the FHA standards. The standards
only focused on street designs. Exclusive pedestrian circulation system
integrated with green open space was not adopted into the standards. Instead,
the FHA and ITE put overriding emphasis on efficient vehicular traffic. It
led to increase the lengths of streets and decrease sidewalk widths
(Southworth and Parthasarathy, 1996). In most of post World War II
suburbs, the cul-de-sacs are long and disoriented, and the sidewalks are often
found on only one side of the street or not found at all. The minimization or
elimination of the pedestrian paths indicates that pedestrian movement was
not considered important.
While the whole innovate Radburn model was discarded, the developers adopted some parts that they could market from the Radburn design. The later new town development was considered a “piecemeal adaptation” of the Radburn design (Birch, 1980). Current typical suburban communities with the cul-de-sac provide quiet residential environments, but parts of a neighborhood are disconnected, and pedestrian access is severely restricted to various parts of suburbs.
3. MEASURING STREET CONNECTIVITY AND ACCESSIBILITY
Measures reviewed above evaluate slightly different aspects of street connectivity (Table 1). The measures using block size, length and density provide good proxy indicators of street connectivity, because those measures indirectly account for street lengths and intersection density. However, the block measures may not be appropriate for the analysis for neighborhood with superblocks. For example, it is likely that the whole neighborhoods could be composed of a few superblocks.
In terms of link node ratio, connected node ratio, Alpha and Gamma indices, the main disadvantage is that those measures are not related to the size of the blocks and the spacing of intersections. Thus, the measures do not reflect the distance between points in any way. It is possible to have the same values for the grid neighborhoods with small and large blocks (Dill, 2004). Nonetheless, those measures are easy to generate and use. All the information required for those measures are total number of nodes and links of the study area.
Dill (2004) stated that the Pedestrian Route Directness would be a better measure for pedestrian and bicycling friendliness, since the measure directly reflects the distance traveled that is a primary factor for discouraging walking or bicycling. Empirical evidence supports this argument at neighborhood level. Handy (1992) found that residents living in a traditional neighborhood that presumably have short distances between local destinations, are more likely to walk or bike than those living in car-oriented neighborhoods. However, Dill (2004) also pointed out that the measure is less attractive for policy making or large scale research, since analyzing all pairs of points requires additional computational capability or user’s judgment if not all pairs are analyzed.
The measure of the Pedestrian Catchment Area provides proxy indicator for pedestrian accessibility from a point. However, measuring the size of area does not consider the characteristics of the area. For example, an area created by the walkable network distance can be large. However, the primary land use of the calculated area may not be residential. Dill (2004) suggests Effective Walking Area (EWA) that is measured as a ratio of the number of parcels within a one quarter mile network distance from a point to the number of parcels within a one quarter mile radius from the node. While the EWA can remove the problem with the PCA, it requires parcel boundary information for the analysis.
Table 1 Measures and their definitions
Measure Definition
Block Lengths The block lengths are measured from the curb to curb or from the centerline of the street intersection to the other centerline.
Block Size block size reflects two dimensions of the block that can be measu
red by the width and length, the area, or the perimeter.
Block Density the number of blocks per a certain unit area
Intersection Density the number of four-way intersections per unit of area Street Density the linear miles of streets per unit of land
Length of Cul-de-Sac the median length of cul-de-sacs
Connected Node Ratio the number of street intersections divided by the number of inters ections and cul-de-sacs
Link Node Ratio the number of links such as roadway or pathway segments divide d by the number of nodes being intersections or the ends of dead- end streets in a study area
Alpha Index the ratio of the number of actual circuits to the maximum number of circuits. It is equal to (the number of links – the number of no des +1)/(2*the number of nodes – 5). Between 0 and 1, higher va lues indicate a more connected network.
Gamma Index the number of links in the network divided by the maximum poss ible number of links between nodes (3*the number of nodes –6).
By the construction of the index, this feature indicates a percenta ge of connectivity with range between 0 and 1
Pedestrian Route Directn ess
the distance using the actual network divided by the straight line distance for two locations
Pedestrian Catchment Ar ea (PCA)
an area created by the walkable network distance divided by a cir cled area by the Euclidean walkable distance
A number of researchers adopted the some of the measures suggested above for evaluating street connectivity in their analyses. Randall and Baetz (2001) developed GIS based methodology measuring Pedestrian Route Directness (PRD) between residences and local destinations. The authors used the value of 1.5 as a critical value for “acceptable” level of street connectivity. The results indicated that the neighborhoods with the grid street patterns had the values between 1.40 and 1.48, and the values for neighborhoods with curvelinear street patterns ranged from 1.63 to 1.88.
In addition, the study selected a suburban neighborhood in Canada and showed that as additional pedestrian connectors are proposed in the neighborhood, the PRD measure between residences and the elementary school in the neighborhood is increased. The authors suggested that the PRD measure using GIS based tool would be useful for comparing conventional suburban developments with traditional and neo-traditional neighborhoods and measuring the improvement by altering design of an existing neighborhood.
Similarly, Hess (1997) compared two neighborhoods in urban and suburban areas. Hess (1997) found 1.2 of PRD for the grid urban neighborhood and 1.7 for the curvelinear street neighborhood in suburban area. The reason for this finding is that street miles in suburban neighborhood are less than half of street miles in the urban grid pattern neighborhood. Furthermore, block sizes for multifamily housing and commercial uses are significantly larger in the suburban neighborhood because of private parking and the internal street circulation system. The author concluded that medium density suburban neighborhoods face serious deficit of street infrastructure, especially pedestrian network.
Schlossberg and Brown (2004) compared eleven Transit Oriented
Developments in Portland, Oregon in terms of the connectivity of walking
environment. The authors pointed out the limitations of the street
connectivity measures previously adopted in past research studies: Overall,
the measures do not differentiate the pedestrian friendly street and less
pedestrian oriented streets, thus treating all road segments as equally
attractive for walking (Schlossberg and Brown, 2004, p.4).
Their study accounted for this limitation and modified the measures of street connectivity tailored to pedestrian walkability. For example, in calculating the intensity of intersections, the impedance-based analysis excludes freeways and major arterial roads from the dataset and only accounts for intersections derived by neighborhood street crossings. If a neighborhood street reaches a major arterial road, the node becomes dead- end street. This makes intuitive sense, because the intersections and dead- ends obtained from the impedance based analysis would be more consistent with how a pedestrian view the walkability of the environment
The results indicated that not all Transit Oriented Developments are walkable at the same degree. The selected TODs varied to a great extent in terms of pedestrian walking environments. The pedestrian impedance analysis introduced in Schlossberg and Brown (2004) appears useful method to evaluate pedestrian walking environment.
4. CASE STUDIES: COMPARING URBAN FORMS OF THE NEIGHBORHOODS
4.1 Selected Neighborhoods
For this study, three neighborhoods are selected based on the physical configuration of the street pattern. The Grand Lakes located in Katy was developed on the 1,400 acre land. The Grand Lakes community is chosen as the Radburn-influenced neighborhood with cul-de-sac street pattern. The overall community is divided into two sections by a major arterial and consists of six neighborhoods. Each neighborhood has a park at the center, connected through green pedestrian paths separated from automobiles. In each two large sections, an elementary school and shopping center as well as various community services (e.g., church, daycare) are located to serve the residents. Figure 1 shows the Grand Lakes master plan combined with aerial photograph.
Figure 1. The digitized Grand Lakes
The street pattern and overall neighborhood plan of the Grand Lakes shows strong influences from the design concept of the Radburn plan. First, both communities are designed based on Perry’s neighborhood unit concept.
A section of both neighborhoods are centered on an elementary school serving residences located within each section. Also, in both cases, the hierarchical street pattern is laid out separating automobiles and pedestrians, and pedestrian paths are connected through public open space. The cul-de- sac streets are relatively shorter and less disoriented compared to the streets in current typical suburban residential developments.
Figure 2. The digitized Woodlands
The Woodlands was selected to represent the neighborhood with conventional cul-de-sac street pattern. The Woodlands is one of the first master planned communities in the U.S. (ULI, 2003). The neighborhood was located on 27,000 acres of forest, 31 miles north of Houston. According to 2000 Census, its total population amounts to 56,000. The basis for the master plan of the Woodlands is a seven-village concept. As of 2003, six villages (Grogan’s Mill, Panther Creek, Cochran’s Crossing, Indian Springs, Alden Bridge, and Sterling Ridge) are completed. Each section contains major local attractions such as schools, shopping, community services and shopping, connected by a network of trails. In this study, we selected the 1,700 acre of Panther Creek Village to compare with other neighborhoods.
The cul-de-sac streets were generally more curvelinear and longer than
those in the Grand Lakes. The community is famous for its ecological site
planning by Ian McHarg. McHarg applied the concept of overlaying environmental constraints to identify the lands most suitable and vulnerable for developments. As a result, the overall neighborhood design accounted for the site’s natural systems and their complex interrelationships. This ecological planning was the basis for creating land plan for the community.
In particular, major arterials and collector roads were aligned away from drainage areas. (see ULI, 2003 for the detailed introduction of the Woodlands). Perhaps, McHarg designed the curvelinear and disoriented cul- de-sacs based on the environmental sensitivity analysis (Figure 2).
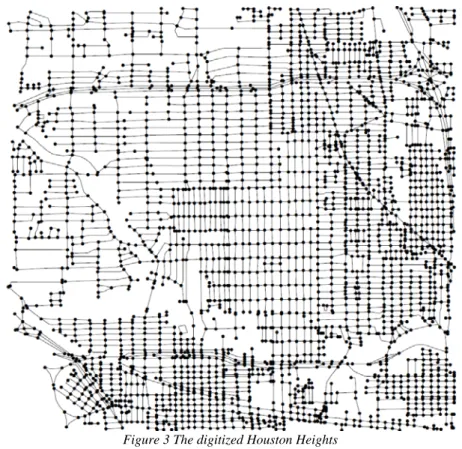
The Houston Heights in the inner city of Houston is selected as the grid street neighborhood. As a historic district of Houston downtown, it is located center of Houston, close to I-610. The neighborhood is distinguished from the other two neighborhoods in terms of street design: It has strict grid street pattern. Figure 3 shows the street network and location of Houston Heights.
Figure 3 The digitized Houston Heights
4.2 Measuring Street Connectivity and Accessibility
From the studies reviewed in the previous sections, we adopted the following measures to analyze urban forms of the selected neighborhoods.
The measures are selected because those are considered appropriate in applying to the neighborhood level analysis:
¾ Link-node ratio
¾ Percentage of cul-de-sacs
¾ Percentage of four-way intersections
¾ Street Density
¾ Alpha index
¾ Gamma index
¾ Pedestrian route directness (PRD)
¾ Pedestrian Catchment Area (PCA)
The eight measures above are selected to compare street connectivity and accessibility of three neighborhoods. The first six indices primarily measure street connectivity. In other words, the six indices measure the degree of
“gridness” of the urban form. The indices of pedestrian route directness and pedestrian catchment area measure accessibility for pedestrians. Although both measures are highly correlated with street connectivity, they are based on the aerial and network distance from point to point. Using the two measures make more intuitive sense in comparing pedestrian and bicycle friendliness of the neighborhoods, because the distance has been considered as a major factor for walking and bicycling. In our study, the two measures are applied to each residence and major local destinations in the communities.
4.3 Preparing Data and TransCAD Functions used for the Analyses
To conduct analysis, three neighborhood plans are first digitized using the TransCAD GIS software. The links are considered to be along the centerlines of the roads, and centroids are assigned to all the residential lots.
Dummy connectors are created to link each centroid and the street network.
In the analyses, the length of dummy connector will be added when calculating the distances from residences to major neighborhood destinations. Theoretically, the dummy connectors are assumed to represent the distance from the front door of the residential unit to the street (Aultman- Hall et al., 1997).
To calculate street connectivity indices of link node ratio, Alpha and Gamma index, the required information is total number of nodes and the total number of links at the whole neighborhood. For measuring street density, we need to know the total lengths of the streets in a neighborhood.
To compute percentage of cul-de-sacs, we need to identify each line’s starting and ending nodes (from-node and to-node). If a node is just once used either for starting point or ending point of a line, that node is the dead end of the cul-de-sac. The total number of such nodes means the number of cul-de-sac in the neighborhood. For the percentage of 4 way intersections, nodes that are used four times as a starting or ending point of lines. The number of such nodes is the same as the number of 4 way intersections in the neighborhood. Before computing percentages of cul-de-sacs and 4 way intersections, the external points that can be considered cul-de-sac should be removed from the digitized map.
For computing PRD, the centroids of the residences and major destinations are selected in TransCAD. Then, TransCAD can generate the distance matrix for measuring mean aerial distances and multiple paths matrix for calculating mean network distance from residences to local destinations.
4.4 Findings
Street Connectivity Indices
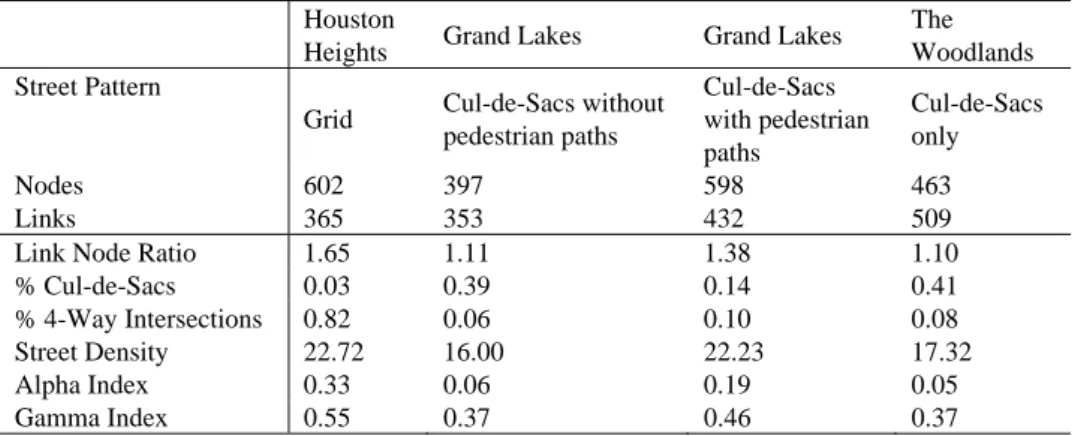
Table 2 presents the results of street connectivity in the three
communities. Overall, the values of the measures indicate that the degree to
which streets are inter-connected is higher in the Houston Heights than the Grand Lakes and the Woodlands. The result comes as no surprise, because the indices are proxy indicators for the level of “gridness” of the neighborhoods. Given that the physical configuration of the Houston Heights neighborhood are based on a strict grid street pattern, the street connectivity indices for the Houston Heights neighborhood should be higher than two other neighborhoods with cul-de-sacs.
Also, street density indicates that street miles divided by the size of neighborhood area are the highest in the Houston Heights. This reflects developer’s concerns in the increase of infrastructure costs when developing the grid street neighborhood. The Grand Lakes neighborhood has shortest street miles among the three neighborhoods.
Table 2 Street Connectivity Index
Houston
Heights Grand Lakes Grand Lakes The Woodlands Street Pattern
Grid Cul-de-Sacs without pedestrian paths
Cul-de-Sacs with pedestrian paths
Cul-de-Sacs only
Nodes 602 397 598 463
Links 365 353 432 509
Link Node Ratio 1.65 1.11 1.38 1.10
% Cul-de-Sacs 0.03 0.39 0.14 0.41
% 4-Way Intersections 0.82 0.06 0.10 0.08
Street Density 22.72 16.00 22.23 17.32
Alpha Index 0.33 0.06 0.19 0.05
Gamma Index 0.55 0.37 0.46 0.37
Accessibility Indices
Accessibility indices are calculated only for single family residences, since the multi-family housings only exist in the Houston Heights neighborhood. Mean aerial and network distances are measured from each residences (represented by the centroids of residential lots) to a major local destination. Based on the results, Pedestrian Route Directness (PRD) for each destination is determined.
First, accessibility scores of different land uses are compared within a neighborhood. Then, accessibility indices are compared between the communities in terms of land uses.
Accessibility: The Comparison within the Neighborhoods
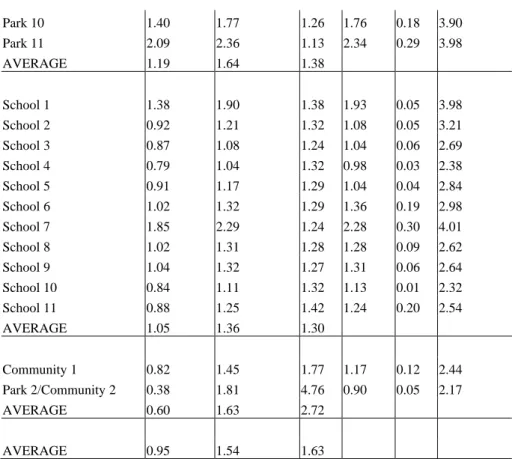
Table 3 shows the accessibility indices for the Houston Heights neighborhood. In calculating the accessibility, local destinations within 0.25 mile buffer around the neighborhood boundary are also included.
Table 3 The Houston Heights Neighborhood Accessibility Scores (Miles) Houston Heights Aerial Dist Network Dist PRD Median Min Max
Park 1 1.18 1.64 1.39 1.62 0.05 3.66
Park 2/Community 2 0.38 1.81 4.76 0.90 0.05 2.17
Park 3 0.99 1.21 1.22 1.19 0.04 2.97
Park 4 0.82 1.16 1.41 1.17 0.12 2.44
Park 5 1.11 1.43 1.29 1.42 0.16 2.76
Park 6 1.59 2.13 1.34 2.10 0.34 3.94
Park 7 1.13 1.43 1.27 1.46 0.10 3.05
Park 8 1.16 1.49 1.28 0.10 1.50 3.15
Park 9 1.25 1.60 1.28 1.60 0.19 3.30
Park 10 1.40 1.77 1.26 1.76 0.18 3.90
Park 11 2.09 2.36 1.13 2.34 0.29 3.98
AVERAGE 1.19 1.64 1.38
School 1 1.38 1.90 1.38 1.93 0.05 3.98
School 2 0.92 1.21 1.32 1.08 0.05 3.21
School 3 0.87 1.08 1.24 1.04 0.06 2.69
School 4 0.79 1.04 1.32 0.98 0.03 2.38
School 5 0.91 1.17 1.29 1.04 0.04 2.84
School 6 1.02 1.32 1.29 1.36 0.19 2.98
School 7 1.85 2.29 1.24 2.28 0.30 4.01
School 8 1.02 1.31 1.28 1.28 0.09 2.62
School 9 1.04 1.32 1.27 1.31 0.06 2.64
School 10 0.84 1.11 1.32 1.13 0.01 2.32
School 11 0.88 1.25 1.42 1.24 0.20 2.54
AVERAGE 1.05 1.36 1.30
Community 1 0.82 1.45 1.77 1.17 0.12 2.44 Park 2/Community 2 0.38 1.81 4.76 0.90 0.05 2.17
AVERAGE 0.60 1.63 2.72
AVERAGE 0.95 1.54 1.63
In terms of average mean network distance, all the land uses are located beyond walking distance from the residences. Mean network distances for elementary school are the shortest among other land uses. This trend also holds for PRD. The average PRDs for the elementary schools are higher than the average PRDs for community centers and parks. In sum, none of the land uses are within a walking distance on average from the residences. The elementary schools are the most accessible in the Houston Heights, but the network distance is longer than the distance pedestrians can easily walk.
Especially, none of the residences are within an aerial walking distance from any of destinations in and around the community. It might be expected that automobiles would be dominant transportation modes to travel to major local destinations in the Houston Heights community.
Figure 1 shows the major local attractions in the Grand Lakes neighborhood.
Table 4 shows the results of accessibility analysis for the Grand Lakes neighborhood without considering separate pedestrian trails. For the sake of the analysis, the Grand Lakes community is largely divided into two sections (Section A and B in Figure 1) by the major arterial. The major arterials can be used for dividing the community, since they are major barriers for walking (Schlossberg and Brown, 2004). Section A is further divided into five parts in which a park is located at the center of the section. We assumed that residents are most likely to use the parks located in the section their residences belong to. Thus, accessibility indices for parks are calculated with residences in each section. Similarly, accessibility scores for two elementary schools and three retails are separately calculated for Section A and B. It makes intuitive sense that if qualities or amenities of the local destinations are similar, the residents are more likely to use the places that has the greater proximity from their homes.
Table 4 The Grand Lakes Accessibility Scores without Pedestrian Trails
Grandlake without
Pedestrian Paths Aerial Dist Network Dist PRD Median Min Max park1 0.20 0.35 1.75 0.35 0.15 0.59 park2 0.22 0.40 1.82 0.40 0.09 0.61 park3 0.26 0.51 1.96 0.49 0.11 0.93 park4 0.26 0.94 3.62 0.50 0.11 0.94 park5 0.18 0.33 1.83 0.32 0.11 0.56 park6 0.24 0.57 2.38 0.40 0.11 0.88
AVERAGE 0.23 0.52 2.29
Retail1 0.75 1.18 1.57 1.18 0.29 2.32 Retail2 0.59 0.97 1.64 0.93 0.31 1.95 Retial3 0.50 1.10 2.20 0.99 0.67 1.31
AVERAGE 0.61 1.08 1.76
school1 0.55 0.96 1.75 0.92 0.31 1.84 school2 0.42 0.82 1.95 0.79 0.29 1.15
AVERAGE 0.49 0.89 1.84
AVERAGE 0.44 0.83 1.96
Mean network distance for parks (0.52 miles) is the shortest compared to other land uses. In Figure 1, it may be obvious that a major design concept for the Grand Lakes is parks located at the center of each section of the community. Also, because of the way the measures are calculated, accessibility scores for the parks account for smaller area around the parks, while retails, schools, and church account for larger areas.
The average PRD value for parks is the highest, compared to other uses.
It means that while the mean network distance to parks is the shortest, the locations of the parks are even more closely located within aerial walking distance (0.23 miles) from the residences. However, people need to travel more than twice of the walking distance (0.52 miles) perhaps because the hierarchical street pattern with cul-de-sacs makes pedestrian travels difficult despite the fact that they are closely located to the residences.
The mean aerial and network distances for retails, elementary schools and church serving larger sections of the community are far beyond the walking distance. Also, the average PRD for retails, elementary schools and church are similar and smaller than the mean PRD value calculated for parks.
When the separate pedestrian trails are considered in measuring accessibility in Grand Lakes, the values become smaller. Compared to Table 4 with Table 5, average network distance and PRD for parks, retails and schools are all significantly decreased. Also, the paired t-test between these differences in network distances are statistically significant with 99 percent confidence level.
T
a
ble 5 The Grand Lakes Accessibility Scores with Pedestrian Trails Grandlakes with PedestrianPaths Aerial Dist Network Dist PRD Median Min Max
park1 0.20 0.34 1.70 0.34 0.11 0.59
park2 0.22 0.39 1.77 0.39 0.09 0.59
park3 0.26 0.40 1.54 0.40 0.11 0.64
park4 0.26 0.42 1.62 0.42 0.11 0.88
park5 0.18 0.29 1.61 0.29 0.11 0.53
park6 0.24 0.39 1.63 0.38 0.11 0.88
AVERAGE 0.23 0.37 1.64
Retail1 0.75 1.10 1.47 1.03 0.22 2.11
Retail2 0.59 0.87 1.47 0.83 0.19 1.74
Retial3 0.50 0.98 1.96 0.98 0.67 1.29
AVERAGE 0.61 0.98 1.60
school1 0.55 0.89 1.62 0.24 0.84 1.68
school2 0.42 0.63 1.50 0.68 0.17 0.98
AVERAGE 0.49 0.76 1.57
AVERAGE 0.44 0.71 1.60
Overall, the parks in the Grand Lakes are located in each section are the most accessible, compared to other destinations. However, the network distance is two times greater than the distance pedestrians are generally willing to walk. Maybe this is because the hierarchical street pattern with cul-de-sacs is inefficient for pedestrian travels. The retails, schools and church are less accessible than the parks mainly because those land uses are serving larger areas. As was the case for the Houston Heights, it is expected that automobiles would be major transportation means for traveling to the local destinations except for the parks.
Table 6 presents the accessibility scores for the Woodlands community.
The community is also divided into three sections by major arterials based on the same assumption employed in the accessibility analysis for the Grand Lakes: Pedestrians are most likely to use the local destinations located within the section they are living in, assuming that the qualities and amenities of the destinations across the whole community are similar.
It should be noted that the accessibility indices for Park 3 are separately calculated for Section 1 and Section 2, since Park 3 is located on the boundary of Section 1 and 2. Similarly, the accessibility scores for Elementary school 1 located in Section 2 are also calculated for all sections.
Because Section 1 does not include a school, and Elementary school 1 is located at the center of the whole village, it might be expected that there are some children living in Section 1 or 3 attending Elementary school 1.
Table 6 The Woodlands Accessibility Scores
Woodlands Aerial Dist Network Dist PRD Median Min Max
Park1 0.42 0.79 1.88 0.61 0.15 1.69
Park2 0.49 0.77 1.57 0.78 0.16 1.29
park3_1 0.81 1.22 1.51 1.29 0.43 1.95
park3_2 1.01 1.41 1.40 1.50 0.31 1.95
Park4 0.55 0.82 1.49 0.78 0.09 1.71
Park5 0.58 0.94 1.62 0.96 0.36 1.76
Park6 0.59 0.93 1.58 0.94 0.07 1.81
Park7 0.56 0.94 1.68 0.92 0.03 1.74
Park8 0.46 0.74 1.61 0.73 0.09 1.23
AVERAGE 0.61 0.95 1.59
school 1 0.59 0.85 1.44 0.80 0.09 1.81
school 2 0.51 0.81 1.59 0.81 0.09 1.32
school 1_ALL 0.77 1.18 1.53 1.20 0.09 2.17
AVERAGE 0.62 0.95 1.52
Retail 0.91 1.32 1.45 1.31 0.40 2.41
AVERAGE 0.71 1.07 1.52
On average, none of the local land uses in the Woodlands are within walkable distance from the residences. The mean network distances for parks and schools are both approximately 0.95 miles in length. Since the shopping center covers the whole Panther Creek village, the mean network distance is greater than parks and schools. In terms of PRD, the average PRD value for parks is the highest. Thus, while many parks are distributed along the village and closely located to the residencies on average, the ratio of the distance people need to travel to the aerial distance is the greatest.
Accessibility: The Comparison between the Neighborhoods
Accessibility scores produced for each community are compared. To do so, the accessibility scores are normalized using the following formula:
Normalized Distance
= (Average – Min)/*(Max-Min)
By this equation, all the network distances can be placed between 0 and 1, thus enable us to compare between neighborhoods. Table 7 summarizes average accessibility scores for the three neighborhoods. Accessibility scores for civic uses in the Houston Heights are excluded in Table 6, since the kind of uses do not exist in the Woodlands and the Grand Lakes.
Table 7 Accessibility Scores for the Three Neighborhoods The
Houston Heights
The Grand Lakes without Pedestrian Trails
The Grand Lakes with Pedestrian Trails
The Woodlands Parks
Mean Network Distance 0.56 0.60 0.47 0.51 Elementary Schools
Mean Network Distance 0.41 0.52 0.31 0.52 Retails
Mean Network Distance 0.70 0.50 0.47 0.46 Total Mean Network
Distance 0.56 0.54 0.42 0.50
Overall, total mean network distance calculated as average distance of all
the mean network distance in a neighborhood is the shortest in the Grand
Lakes with considering separate pedestrian trails. The mean network
distances for parks and elementary schools are shortest in the Grand Lakes
with pedestrian trails, while the Woodlands has the shortest mean network
distance from its residences to retails. From the results, major findings can
be summarized as follows:
¾ Separate pedestrian paths significantly increased pedestrian accessibility and street connectivity in a cul-de-sac neighborhood;
¾ Between the two cul-de-sac based neighborhoods, the neighborhood with design concepts focusing on better accessibility and interconnectedness has higher street connectivity and walkability than the neighborhoods without these design concepts; and
¾ Street connectivity and walkability of the cul-de-sac street design with separate pedestrian paths are comparable with or higher than those of the grid urban form.
5. CONCLUSION
The study revisited the largely accepted idea to deal with sprawl by replacing cul-de-sac/curve-linear street with the traditional checkerboard system in community design. Recent discussions suggest that a neighborhood with cul-de-sac street pattern can promote accessibility and street connectivity, if it is designed integrated with open space and pedestrian paths, while creating safe and quiet residential environments. A good example is the discarded old wisdom, the Radburn. To date, the past researchers did not acknowledge the potential of the cul-de-sac neighborhoods in achieving the benefits New Urbansits strive to accomplish.
This study tried to fill this gap by comparing a conventional suburban neighborhood, a neighborhood with creative cul-de-sac street pattern, and the grid street neighborhood.
This study compares the three neighborhoods in terms of street connectivity and accessibility. The Houston Heights, the Grand Lakes and the Woodlands are selected based on their distinctive street patterns. The Houston Heights has a strict grid street pattern, while the Grand Lakes and the Woodlands are designed based on the hierarchical street pattern with cul- de-sacs. While the same concept of the hierarchical street pattern is used for the Grand Lakes and the Woodlands, the overall neighborhood designs show that the layout of the neighborhoods are different from each other. In the Grand Lakes, the cul-de-sac streets are designed centered around the parks in each section of the community, serving residences in internal blocks in the community. The cul-de-sacs are well-organized and integrated with public open space with pedestrian paths, as we have seen in the Radburn plan. In contrast, the overall neighborhood design of the Woodlands does not show any distinctive design concept or a pattern. The cul-de-sac streets in the Woodlands are more disoriented and culvelinear than the Grand Lakes, perhaps because the overall neighborhood plan is based on the environmental sensitivity analysis done by Ian McHarg.
The analyses of this study indicate that the neighborhood with cul-de-sac
streets can provide higher accessibility for pedestrians than the grid street
neighborhood. In other words, the benefits that New Urbanist proposal
intends to achieve can be gained in a neighborhood designed based on the
hierarchical street pattern with cul-de-sacs. This study shows that although
the Grand Lakes utilizes cul-de-sacs, the degree of walkability is comparable
with or better than the Houston Heights. Total mean network distance
calculated as average of all the network distance is the shortest in the Grand
Lakes. The mean network distances for parks and elementary schools are
also shortest in the Grand Lakes. The mean network distance is considered
the most reliable measures for indicating pedestrian accessibility, because
the distance is a major factor for pedestrian travels.
This finding has an important implication for policy makers. For modifying our current development practices or proposing new development proposal to minimize automobile travels, developing the cul-de-sac street neighborhood in a way to increase pedestrian accessibility may be a better solution than proposing the New Urbansit grid neighborhood. Moreover, given that people have expressed preferences towards cul-de-sacs over the grid street pattern, it would be politically more feasible way to alter our urban forms. However, the street pattern alone cannot attain benefits such as high street connectivity and pedestrian accessibility. What is more important is the overall neighborhood design integrated with street network pattern.
The grid pattern alone cannot promote pedestrian travels if local attractions are located far away from residences. Similarly, the cul-de-sac street community can encourage pedestrian travels if the street pattern is well- integrated with major destinations and public open space.
There exist several limitations in the present study, suggesting directions for improvement in the future. First, this study did not account for car free network, possibly present in the Grand Lakes and the Woodlands. Because pedestrian paths separated from automobiles are not necessarily form a linear way, it is difficult to digitize those paths. More data such as aerial photographs are required to properly digitize pedestrian only circulation systems. This study implicitly assumed that all road segments are as equally attractive for walking. Second, most residential cul-de-sac streets are car- oriented and not likely to have sidewalks. The sidewalk availability has been found as a significant l factor for encouraging non-motorized transportation mode (Rodriguez, 2004). Future study can overcome the limitations by incorporating more data.
REFERENCES
Aultman-Hall, L., Roorda, M. and Baetz, B. (1997) Using GIS for Evaluation of
Neighborhood Pedestrian Accessibility. Journal of Urban Planning and Development, 123, 10-17.
Birch, E.L. (1980). Radburn and the American Planning Movement: The persistence of an idea. Journal of the American Planning Association, 46, 424-439.
Cervero, R. and Kockelman, K.(1997). Travel Demand and the 3Ds: Density, Diversity, and Design. Transportation Research D, Vol. 2: 199-219.
City of Austin. (2000). Houston Heights Neighborhood Plan. Planning, Environmental and Conservation Services Department, City of Austin.
Dill, J. (2004). Measuring Network Connectivity for Bicycling and Walking. Presented at the Annual Transportation Research Board Meeting, Washington D.C.
Ewing, R., and Cervero, R. (2001). Travel and the built environment: A synthesis.
Transportation Research Record, 1780, pp. 87-114.
Handy, S., Paterson, R.G., and Butler, K. (2003). Planning for Street Connectivity: Getting from here to there. American Planning Association, PAS Report Number 515.
Handy, S. (2002). Accessibility vs. Mobility-Enhancing Strategies for Addressing
Automobile Dependence in the U.S. Prepared for the European Conference of Ministers of Transport.
Hess, P. (1997). Measures of Connectivity. Places 11, 59-65.
Lee, C.M. and Ahn, K.H. (2003). Is Kentlands Better than Radburn? The American Garden City and New Urbanist Paradigms. Journal of American Planning Association, 69(1), 50- 71.
Lee, C.M. and Stabin-Nesmith, B. (2001). The Continuing Value of a Planned Community:
Radburn in the evolution of Suburban Development. Journal of Urban Design, 6(2), 151- 184.
Parsons, K.C. (1990). Clarence Stein and the Greenbelt Towns: Settling for less. Journal of the American Planning Association, 56, 161-183.
Randall, T. A. and Baetz, B. W. (2001) Evaluating Pedestrian Connectivity for Suburban Sustainability. Journal of Urban Planning and Development, 127, 1-15.
Rodriguez, D.A., Joo, J. (2004). The relationship between non-motorized mode choice and the local physical environment. Transportation Research Part D 9., 151-173.
Schlossberg, M. and Brown, N. (2004). Comparing Transit Oriented Developments Based on Walkability Indicators. Presented at the Annual Transportation Research Board Meeting, Washington D.C.
Song, Y. (2002). Impacts of Urban Growth Management on Urban Form: A Comparative Study of Portland, Oregon, Orange County, Florida, and Montgomery County, Maryland.
National Center for Smart Growth Research and Education, University of Maryland.
Song, Y. (2003). Measuring Urban Form: Is Portland Winning the War on Sprawl? Journal of American Planning Association, 70(2), 210-225.
Southworth, M., and Ben-Joseph, E. (2004). Reconsidering the Cul-de-Sac. Access 24 (Spring): 28-33.
Sourthworth, M. (1997). Walkable Suburbs? An Evaluation of Neo-traditional Communities at the Urban Edge. Journal of the American Planning Association, 63(1), 28-44.
Stein, C.S. (1967). Toward new towns for America. Cambridge: MIT Press.
Southworth, M., and Ben-Joseph, E. (1995). Street standards and the shaping of suburbia.
Journal of the American Planning Association, 61(1), page numbers.
Southworth, M. and Parthasarathy, B. (1996). The Suburban Public Realm I: Its emergence, growth and transformation in the American metropolis. Journal of Urban Design, 1(3), 245-264.
Southworth, M., and Ben-Joseph, E. (1997). Streets and the shaping of cities and towns. New York:McGraw-Hill.
Urban Land Institute (2003). Great Planned Communities. Washington, D.C. the Urban Land Institute.