Estimation of demographic history of Japanese and Taiwanese populations in Prunus mume
using SSR marker genotypes
Koji Numaguchi
1), 2), Yuto Kitamura
2), Ryo Ishikawa
1), Takashige Ishii
1)1) Graduate School of Agricultural Science, Kobe University (1-1 Rokkodai, Nada-ku, Kobe 657-8501, Japan) 2) Japanese Apricot Laboratory, Wakayama Fruit Tree Experiment Station (1416-7 Higashi-Honjo, Minabe, Wakayama
645-0021, Japan)
Summary: Prunus mume Sieb. et Zucc. (conventionally called Japanese apricot, Chinese mei and mume) is a
deciduous fruit tree species in the genus Prunus. More than 300 P. mume cultivars are distributed mainly in East Asia, including Japanese fruit, small-fruit and ornamental cultivars and Taiwanese cultivars. In order to estimate demographic history of three Japanese and one Taiwanese subpopulations, approximate Bayesian computation (ABC) analysis was carried out using 20 SSR genotype datasets of 53 cultivars (20 fruit, 8 small-fruit, 20 ornamental and 5 Taiwanese cultivars). At fi rst, the best fi tting model (posterior probability: 0.501) was estimated among six probable scenarios, and median values of demographic parameters were computed. The generation time for P. mume cultivars was assumed to be seven years (full reproductive age) for time conversion. In the best scenario, Japanese and Taiwanese populations had fi rst diverged at 10360 (95% confi dence interval (CI): 2079-56910) years ago, followed by the separation of ornamental cultivars among Japanese populations at 3633 (95% CI: 1218-12740) years ago, and fi nal diff erentiation between fruit and small-fruit cultivars at 2387 (95% CI: 623-6258) years ago. Although the divergence times were roughly estimated, the results suggest that Japanese and Taiwanese populations were separated through the geographic isolation with diff erent climate conditions, and ornamental, fruit and small-fruit cultivars were recently diff erentiated based on human preference in Japan.
Keywords: Demographic history, Prunus mume, simple sequence repeat (SSR) marker, approximate Bayesian
computation (ABC)
Introduction
Prunus mume Sieb. et Zucc. (conventionally called Japanese
apricot, Chinese mei and mume) is a deciduous fruit tree species in the genus Prunus, which includes popular stone fruit species such as peach [P. persica (L.) Batsch], almond [P. dulcis (Mill.)], Japanese plum (P. salicina Lindl.) and apricot (P. armeniaca L.). Since the fresh fruits are not edible because of strong acidity, they are generally processed into pickles called umeboshi , syrup and liquors. The origin of P. mume is not clearly determined, although it is believed to be originated from the mid-mountainous region in China (Mega et al. 1988). More than 300 P. mume cultivars are distributed mainly in East Asia, and they usually have self-incompatibility and require a certain amount of low temperature to break bud dormancy (Yamane 2014). On the other hand, Taiwanese cultivars adapted to subtropical climates generally show a weak-chilling requirement for dormancy release, and they were reported to be genetically diff erent from Japanese cultivars (Shimada et al. 1994, Hayashi
et al. 2008, Kitamura et al. 2018, Numaguchi et al. 2019).
Japanese cultivars are thought to be introduced from China about 2000 years ago for flower ornamental purposes (Mega et al. 1988). Then, fruit cultivars (including small-fruit cultivars) may have been generated in Japan. Interestingly, small-fruit cultivars mostly bearing small-sized fruits (~10 g) and showing self-compatibility are also preferred in some parts of Japan. As shown above, three major groups of ornamental, fruit and small-fruit cultivars are common in Japan.
Population structure among Japanese and Taiwanese cultivars of P. mume have been analyzed using random amplified polymorphic DNA (RAPD) and simple sequence repeat (SSR) markers (Shimada et al. 1994, Hayashi et al. 2008, Numaguchi
et al. 2019). However, these analyses could show only the
present population structure, but not infer the demographic history such as change of effective population size and divergence time of subpopulations. Approximate Bayesian computation (ABC) (Beaumont et al. 2002) is a computational method which estimates the best fi tting demographic model by comparing simulated datasets of assumed models and observed genotypes. Using datasets of simple DNA markers (e.g. SSR
Acccepted: December, 18, 2019
Corresponding author: Takashige Ishii ([email protected])
markers), this method has been successfully applied for various woody plant species, such as apple and olive (Cornille et al. 2012, Diez et al. 2015). In this study, we analyzed the demographic history among Japanese and Taiwanese populations of P. mume based on the ABC using SSR genotype data previously reported by Numaguchi et al. (2019).
Materials and methods
Plant materials and datasets
A total of 124 P. mume accessions were previously subjected to the STRUCTURE analysis (Pritchard et al. 2000) using 20 SSR markers (PMKS15, 21, 49, 59, 68, 75, 99, 113, 121, 131, 133, 149, 164, 175, 179, 187, 191, 193, 197, 201) (Numaguchi
et al. 2019). Of these, the representative cultivars forming mode
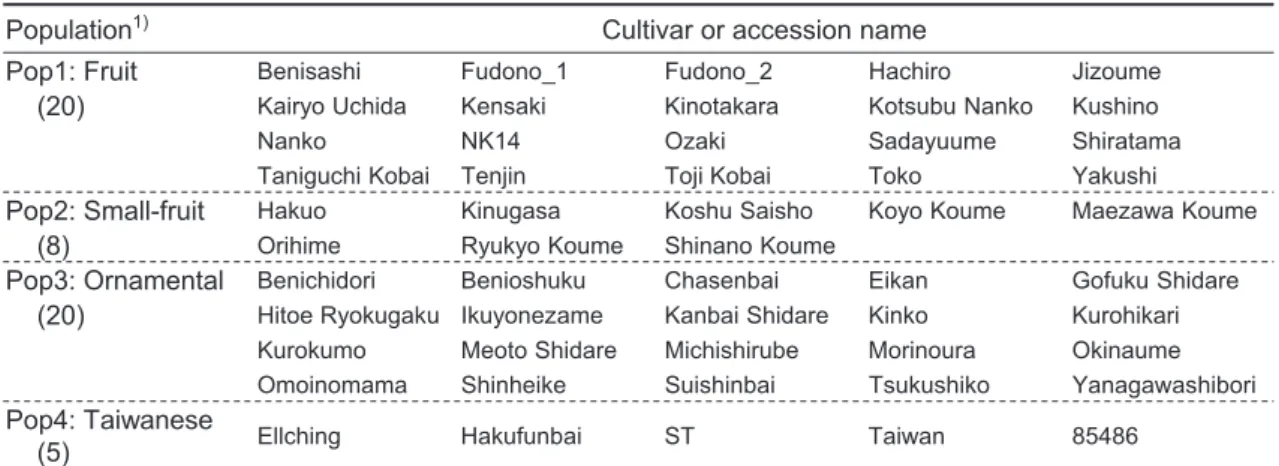
clusters (or core clusters) in the STRUCTURE analysis were selected for four subpopulations of Pop1 (fruit cultivars), Pop2 (small-fruit cultivars), Pop3 (ornamental cultivars) and Pop4 (Taiwanese cultivars). For Pop1 and Pop3, we respectively selected top 20 cultivars having high values of dominant clusters at K = 2 (Numaguchi et al. 2019). Similarly, eight and five cultivars sharing common clusters at K = 7 were selected for Pop2 and Pop4, respectively. The variety names of these 53 cultivars are listed in Table 1. All the plant materials were maintained in Japanese Apricot Laboratory, Wakayama Fruit Experiment Station, Japan.
ABC analysis was carried out using genotype datasets of the 53 cultivars based on 20 SSR markers. These datasets are available in the open access paper by Numaguchi et al. (2019).
Estimation of demographic model
To make approximate Bayesian computation, a software of DIYABC v2.0 (Cornuet et al. 2014) was used to infer the demographic history. According to the previous results on
genetic distances among four subpopulations, Taiwanese group was inferred to diverge fi rst (Numaguchi et al. 2019). Therefore, we assumed six following scenarios with three divergence times measured in number of generations (t1 - t3) (Fig. 1). Scenario 1: all populations (Pop1 - 4) were simultaneously diff erentiated at t3. Scenario 2: Japanese (Pop1 - 3) and Taiwanese (Pop4) populations were first differentiated at t3, followed by the ornamental cultivars (Pop3) at t2, and fruit (Pop1) and small-fruit cultivars (Pop2) at t1. Scenarios 3 and 4: After the differentiation of Taiwanese population at t3, fruit cultivars (Pop1) or small-fruit cultivars (Pop2) were next diff erentiated at t2, followed by the other two. Scenarios 5 and 6: After the Taiwanese separation at t3, two populations were diff erentiated at t2, followed by the emergence of introgressed small-fruit (Pop2) or fruit cultivars (Pop1) at t1. Under each assumed model, a computation was carried out with 1 × 10⁶ simulated
datasets using DIYABC. Here, generalized stepwise model with single nucleotide insertion or deletion was employed as the SSR mutation model. Posterior probabilities indicating the fi tness of the assumed scenarios were calculated based on polychotomous logistic regression, according to Cornille et al. (2012) and Diez
et al. (2015).
Results and Discussion
Population structures revealed by STRUCTURE analyses may often be affected by recent admixture in the populations (Pritchard et al. 2000, Anderson and Thompson 2002, Excoffi er
et al. 2005). Therefore, in this study, we tried to estimate the
demographic history among four major subpopulations in P.
mume by ABC method.
Based on the previous results on genetic distances among four subpopulations (Numaguchi et al. 2019), six scenarios with divergence times are assumed. Of these, DIYABC analysis
Population1) Cultivar or accession name
Pop1: Fruit Benisashi Fudono_1 Fudono_2 Hachiro Jizoume
(20) Kairyo Uchida Kensaki Kinotakara Kotsubu Nanko Kushino
Nanko NK14 Ozaki Sadayuume Shiratama
Taniguchi Kobai Tenjin Toji Kobai Toko Yakushi
Pop2: Small-fruit Hakuo Kinugasa Koshu Saisho Koyo Koume Maezawa Koume
(8) Orihime Ryukyo Koume Shinano Koume
Pop3: Ornamental Benichidori Benioshuku Chasenbai Eikan Gofuku Shidare
(20) Hitoe Ryokugaku Ikuyonezame Kanbai Shidare Kinko Kurohikari Kurokumo Meoto Shidare Michishirube Morinoura Okinaume Omoinomama Shinheike Suishinbai Tsukushiko Yanagawashibori
Pop4: Taiwanese
(5) Ellching Hakufunbai ST Taiwan 85486
1) Parenthesis indicates number of cultivars in the population.
supports Scenario 2 with highest posterior probability of 0.501 (95% confidence interval: 0.482-0.521) (Table 2). In this scenario, Japanese (Pop1 - 3) and Taiwanese (Pop4) populations had fi rst diverged at t3, followed by diff erentiation between fruit (Pop1 - 2) and ornamental (Pop3) cultivars at t2, and fi nally fruit (Pop1) and small-fruit (Pop2) cultivars separated at t1 (Fig. 1). The 95% confi dence interval (CI) of Scenario 2 did not overlap with those for the other scenarios explaining the separation of fruit and small-fruit cultivars was not recent event (Scenarios 1, 3, 4) or the admixture event occurred among Japanese populations (Scenarios 5, 6) (Table 2). Scenario 2 seems to be consistent with the suggestion in the previous studies, i.e, Japanese cultivars were originally introduced from China for
ornamental purpose, and fruit and small-fruit cultivars were subsequently produced in Japan (Mega et al. 1988, Shimada et
al. 1994, Hayashi et al. 2008, Numaguchi et al. 2019).
For the best fitting model of Scenario 2, further parameters were estimated. Table 3 shows the eff ective population sizes (N1 – N4), divergence times (t1 – t3) and mutation-related mean values (μmic, pmic, snimic). Among them, we focused on divergence
t3 t2 t1
Scenario 1 Scenario 2 Scenario 3
Pop1 Pop2 Pop3 Pop4 Pop1 Pop2 Pop3 Pop4 Pop3 Pop2 Pop1 Pop4 present past
N1 N2 N3 N4 N1 N2 N3 N4 N3 N2 N1 N4
t3 t2 t1
Scenario 4 Scenario 5 Scenario 6
Pop1 Pop3 Pop2 Pop4 Pop1 Pop2 Pop3 Pop4 Pop3 Pop1 Pop2 Pop4 present past
N1 N3 N2 N4 N1 N2 N3 N4 N3 N1 N2 N4
Fig. 1 Demographic models of six scenarios compared in approximate Bayesian computations.
Pop1: Fruit cultivars. Pop2: Small-fruit cultivars. Pop3: Ornamental cultivars. Pop4: Taiwanese cultivars. N1 - N4: Eff ective population sizes for Pop1 ‒ 4. t1‒ t3: Divergence times.
Scenario p 1) CI (0.025) 2) CI (0.975) 2) 1 0.148 0.126 0.170 2 0.501 0.482 0.521 3 0.013 0.000 0.034 4 0.003 0.000 0.025 5 0.261 0.234 0.289 6 0.073 0.054 0.092 1) Posterior probabilities.
2) Boundaries of the 95% confidence intervals (CI). Table 2 Relative posterior probabilities for the six
demographic models based on DIYABC analysis.
Table 3 Demographic and mutation parameters estimated for Scenario 2.
Parameter 1) Median CI (0.025) 2) CI (0.975) 2) N1 946 314 3840 N2 4740 1330 9410 N3 3240 1050 8360 N4 5150 2020 9270 t1 341 89.1 894 t2 519 174 1820 t3 1480 297 8130 μmic 3.1ʹ10-4 1.7ʹ10-4 7.5ʹ10-4 pmic 0.29 0.19 0.3 snimic 6.6ʹ10-8 1.0ʹ10-8 2.2ʹ10-6
1) N1-N4: Effective population sizes. t1-t3: Divergence times (generations). μmic: Mean mutation rate of SSR. pmic: Mean increase or decrease of the length of the locus during mutation events. snimic: Mean mutation rate of single nucleotide insertion or deletion.
times which are critical in the demography scenario. The median values of the three divergence times of t1, t2 and t3 were 341 (95% CI: 89-894), 519 (95% CI: 174-1820) and 1480 (95% CI: 297-8130) generations ago, respectively. It is quite diffi cult to determine the generation time in woody plant species (Tsuda et al. 2015). In peach, Yu et al. (2018) assumed the generation time of seven years (full reproductive age) for the demographic study. As P. mume shows similar growth patterns to peach, we applied the same generation time for P. mume cultivars for time conversion. Consequently, the median values of t1, t2 and t3 were estimated to be 2387 (95% CI: 623-6258), 3633 (95% CI: 1218-12740) and 10360 (95% CI: 2079-56910) years ago, respectively. These results roughly suggest that Japanese and Taiwanese populations were separated through the geographic isolation with diff erent climate conditions, and ornamental, fruit and small-fruit cultivars were recently differentiated based on human preference in Japan. Although these median values have broad 95% confidence intervals, the differentiation period between Japanese and Taiwanese populations seems to be overlapped with the bottleneck periods of peach species (Yu et al. 2018). This suggests that the global warming climate after the last glacial period may also promote the population expansion and diff erentiation in P. mume. In addition, divergence times among ornamental, fruit and small-fruit cultivars were closely estimated to the beginning period of P.
mume utilization in Japan (Mega et al. 1988). Given that similar
genetic structures tend to be shared within each cultivar group (Numaguchi et al. 2019), Japanese people may have selected P.
mume trees based on the preferable traits such as fl ower shape and
color, tree architecture, fruit size and so on.
In this study, we roughly estimated the demographic history of Japanese and Taiwanese populations in P. mume. For further study, more plant materials (including Chinese cultivars and wild relatives) and more marker data are necessary to clarify the domestication and diff erentiation process in P. mume.
References
Anderson, E. C. and E. A. Thompson (2002) A model-based method for identifying species hybrids using multilocus genetic data. Genetics 160: 1217-1229.
Beaumont, M. A., W. Zhang and D. J. Balding (2002) Approximate Bayesian computation in population genetics. Genetics 162: 2025-2035.
Cornille, A., P. Gladieux, M. J. M. Smulders, I. Roldán-Ruiz, F. Laurens, B. Le Cam, A. Nersesyan, J. Clavel, M. Olonova, L. Feugey et al. (2012) New insight into the history of domesticated apple: secondary contribution of the European wild apple to the genome of cultivated varieties. PLoS Genet. 8: e1002703.
Cornuet, J. M., P. Pudlo, J. Veyssier, A. Dehne-Garcia, M.
Gautier, R. Leblois, J. M. Marin and A. Estoup (2014) DIYABC v2.0: a software to make approximate Bayesian computation inferences about population history using single nucleotide polymorphism, DNA sequence and microsatellite data. Bioinformatics 30: 1187-1189.
Diez, C. M., I. Trujillo, N. Martinez-Urdiroz, D. Barranco, L. Rallo, P. Marfil and B. S. Gaut (2015) Olive domestication and diversifi cation in the Mediterranean Basin. New Phytol. 206: 436-447.
Excoffier, L., A. Estoup and J. M. Cornuet (2005) Bayesian analysis of an admixture model with mutations and arbitrarily linked markers. Genetics 169: 1727-1738.
Hayashi, K., K. Shimazu, H. Yaegaki, M. Yamaguchi, H. Iketani and T. Yamamoto (2008) Genetic diversity in fruiting and flower-ornamental Japanese apricot (Prunus mume) germplasms assessed by SSR markers. Breed. Sci. 58: 401-410.
Kitamura, Y., T. Habu, H. Yamane, S. Nishiyama, K. Kajita, T. Sobue, T. Kawai, K. Numaguchi, T. Nakazaki, A. Kitajima et
al. (2018) Identifi cation of QTLs controlling chilling and heat
requirements for dormancy release and bud break in Japanese apricot (Prunus mume). Tree Genet. Genomes 14: 33.
Mega, K., E. Tomita, S. Kitamura, S. Saito and S. Mizukami (1988) Ume. In The grand dictionary of horticulture Aoba T.
et al. (eds.), Shogakukan, Tokyo. 289-300.
Numaguchi, K., S. Ishio, Y. Kitamura, K. Nakamura, R. Ishikawa and T. Ishii (2019) Microsatellite marker development and population structure analysis in Japanese apricot (Prunus mume Sieb. et Zucc.). Hort. J. 88: 222-231. Pritchard, J. K., M. Stephens and P. Donnelly (2000) Inference
of population structure using multilocus genotype data. Genetics 155: 945-959.
Shimada, T., T. Haji, M. Yamaguchi, T. Takeda, K. Nomura and M. Yoshida (1994) Classification of mume (Prunus mume Sieb. et Zucc.) by RAPD assay. J. Jpn. Soc. Hortic. Sci. 63: 543-551.
Tsuda, Y., K. Nakao, Y. Ide and Y. Tsumura (2015) The population demography of Betula maximowicziana, a cool-temperate tree species in Japan, in relation to the last glacial period: its admixture-like genetic structure is the result of simple population splitting not admixing. Mol. Ecol. 24: 1403-1418.
Yamane, H. (2014). Regulation of bud dormancy and bud break in Japanese apricot (Prunus mume Siebold & Zucc.) and peach [Prunus persica (L.) Batsch]: a summary of recent studies. J. Jpn. Soc. Hortic. Sci. 83: 187-202.
Yu, Y., J. Fu, Y. Xu, J. Zhang, F. Ren, H. Zhao, S. Tian, W. Guo, X. Tu, J. Zhao et al. (2018) Genome re-sequencing reveals the evolutionary history of peach fruit edibility. Nat. Commun. 9: 5404.
SSR マーカー遺伝子型に基づく日本と台湾のウメの過去の集団動態の推定
沼口孝司
1, 2)・北村祐人
2)・石川 亮
1)・石井尊生
1)1)神戸大学大学院農学研究科(〒 657-8501 神戸市灘区六甲台町 1-1)
2)和歌山県果樹試験場うめ研究所(〒 645-0021 和歌山県日高郡みなべ町東本庄 1416-7)
要旨:ウメ(Prunus mume)は Prunus 属の果樹であり,300 以上の品種が東アジアを中心に分布しているが,日本の実ウメ,小 ウメ,花ウメおよび台湾由来のウメもこれらに含まれる.そこで,日本と台湾のウメの過去の集団動態を推定するために,53 品 種(実ウメ 20 品種,小ウメ 8 品種,花ウメ 20 品種,台湾 5 品種)の SSR マーカー 20 座における遺伝子型のデータセットに基 づき,近似ベイズ計算(approximate Bayesian computation, ABC)を用いた解析を行った.まず,6 つの起こりうる分岐シナリオか ら最適モデル(事後確率 0.501)を推定し,そのモデルの集団動態に関するパラメーターの中央値を算出した.また,ウメの世 代時間を 7 年(生殖可能年齢)と仮定し,世代数を年代に換算した.最適モデルでは,日本と台湾の集団が 10360 年(95% 信頼 区間:2079-56910 年)前に初めに分岐し,その後 3633 年(95% 信頼区間:1218-12740 年)前に日本の集団から花ウメが分かれ, 最終的に 2387 年(95% 信頼区間:623-6258 年)前に実ウメと小ウメが分化したと推定された.これらの分岐年代は粗く推定さ れたものであるが,異なった気候条件を伴う地理的隔離により日本と台湾のウメが分化し,その後日本で人の用途に応じて花ウ メ,実ウメ,小ウメが最近分化したことを示唆する結果となった.
キーワード:集団動態,ウメ(Prunus mume),SSR マーカー,近似ベイズ計算(approximate Bayesian computation, ABC)
作物研究 65 号(2020) 連絡責任者:石井尊生([email protected])