Short
contribution
Outbreak
of Warm
Water
from
the Kuroshio
South
of Japan
―A Combined Analysis of Satellite and OMLET Oceanographic Data―*
Y.TOBA†, H. KAWAMURA‡, K. HANAWA†, H. OTOBE¶and K. TAIRA¶
Abstract: During the concentrated observation (April-May 1988) conducted as a part of the Ocean Mixed Layer Experiment (OMLET) in the sea area south of Japan, a conspicuous outbreak of warm water occurred from the large-meander
region of the Kuroshio toward the southwest in the direction of the former Ocean Weather Station "T". A series of NOAA-AVHRR infrared images clearly showed the process of this event. A surface buoy-mooring system deployed in this experiment recorded the arrival of this outbreak of water, in terms of the rise of sea-surface temperature (SST) of 1.5•‹C and the flow of warm water of 1.5kt toward the northwest at "T". We studied this phenomenon by combining time series of infrared SST images with the oceanographic data obtained by two research
vessels. The warm water was about 100 m deep in the section at 137•‹E along the edge of the Off-Shikoku Warm Water. It was estimated that about twenty outbreaks of this kind in a year can compensate a large heat loss to the atmosphere
above this ocean region.
1. Introduction
The seas around Japan are regions where a
large amount of heat is transported
from the
sea to the atmosphere
(e.g., Hsiung, 1985;
Iwa-saka and Hanawa, 1990).
We have been
car-rying out the Ocean Mixed Layer Experiment
(OMLET), as an oceanographic
component
of
the Japanese
World
Climate
Research
Pro-gramme (WCRP). One of the objectives of the
OMLET is to investigate
sample
processes
which are responsible
for the horizontal
eddy
heat transfer in the ocean south of Japan.
A time series of NOAA-AVHRR infrared
ra-diometer SST data taken at Tohoku University
showed that during the concentrated
observa-tion period of the OMLET in April-May 1988, a
conspicuous
outbreak of warm water occurred
from the large meander part of the Kuroshio toward the southwest in the direction of the former Ocean Weather Station "T" (OWS-T, 29•‹N, 135•‹E). OWS-T was the site where the Ocean Research Institute group (Otobe et al., 1989) was recording the water temperature and current by using a long-period surface buoy mooring system. Two research vessels, the Hakuho Maru (KH-88-2, the OMLET Cruise, 15 April to 11 May 1988) and the Tansei Maru (KT-88-6, 3-11 May 1988), were carrying out intensive observations of this area.
In this report we present a combined analy-sis of satellite data, cruise data, and the time series record obtained by the surface buoy. Details of the cruise are given by Asai (1988) in the Preliminary Report of the KH-88-2, which also contains reports of the KT-88-6 cruise.
2. Description
A time series data of NOAA-AVHRR Chan-nel 4 showing the occurrence of the outbreak is shown in Fig. 1. It was reported by Kawamura et a/.(1984) that the Kuroshio has some pulse like unsteady structure with a period of ten
* Received 26 May 1991; in revised form 5
August 1991; accepted 12 September 1991. †Department of Geophysics
, Faculty of Science, Tohoku University, Aoba-ku, Sendai 980, Japan. ‡CenterforAtmosphericandOceanicStudies
, Faculty of Science, Tohoku University, Aoba-ku. Sendai 980. Japan.
¶Ocean ResearchInstitutе
, University of Tokyo, Nakano-ku, Tokyo 164, Japan.
be related also to this unsteady
structure.
In
the middle of April, the highest temperature
core flows southward
from the Kii Peninsula to
form a kink-like
structure
at the southwest
corner of the large meander
(Fig. 1c).
Then
the next core has arrived
at this point in the
infrared
image of SST on 26 April (Fig.1 h),
and the image on 3 May (Fig. li) shows the
beginning
of the outbreak.
Figure 2 is the infrared image of SST on 13
May, and clearly shows a conspicuous
out-break
from the large meander
part of the
Kuroshio
toward the former OWS-T, which is
shown by the open circle at the center of the
was observed by the buoy of the Ocean Re-search Institute group on 10 May. In Fig. 3a, which shows the time series of sea surface temperature (SST), the temperature rise of about 1.5•Ž from the night of 10 May to 11 May is interpreted as the arrival of the front of this warm outbreak. Although the records of the surface current shown in Figs. 3b and 3c do not indicate a large current velocity on these dates, these records show a northwest velocity component of 1.5kt (75cm s-1) on 13 and 14 May, with velocity fluctuations following for several days. The outbreak of warm water loses its identity by mixing with the
sur-Fig. 2. Infrared image of the OMLET region from NOAA-AVHRR Ch. 4 data on 13
300 TOBA, KAWAMURA, HANAWA, OTOBE and TAIRA
a
b
c
Fig. 3.
Time series of sea-surface
temperature
(T), eastward
component
(U), and
northward
component
(V) of the surface current
velocity,
recorded by a surface
buoy mooring system of the Ocean Research
Institute,
University
of Tokyo, from
00:00 26 April to 24:00 20 May 1988.
rounding water within the following several days, as seen in Fig. 1o.
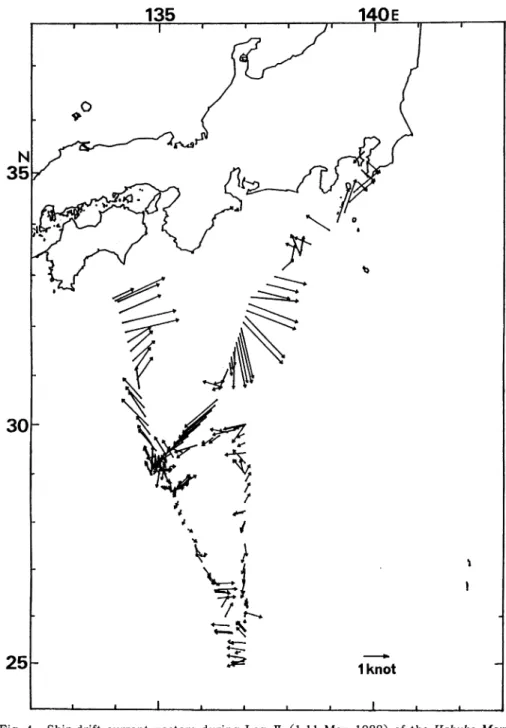
In Fig. 4, arrows indicate the ship-drift cur-rent vectors during the second leg (1-11 May) of the Hakuho Maru Cruise KH-88-2. Besides the current vectors of about 2kt (100cm s-1) corresponding to the Kuroshio main current at about 32•‹N, another group of large current vectors up to 1.7kt (85cm s-1) is seen at about 29-30•‹ N, toward the southwest at about 136•‹E and northwest at about 135•‹E. These current data seem to correspond well to the infrared image of SST in Fig. 2, and also to the above-mentioned buoy data.
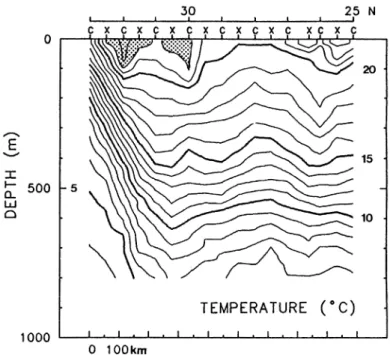
Figure 5 shows the temperature cross-section along the 137•‹E meridian obtained during the KH-88-2 and KT-88-6 cruises. At 32•‹N, we see the maximum-temperature water belt (warm core) of the Kuroshio, the area above 22•Ž being shaded, with strong baro-clinicity underneath. The other shaded area above 22•Ž at about 30•‹N corresponds to the outbreak of warm water mentioned above.
The thickness is about 100m, and this water has a T-S relationship (not shown here) similar to that of the corresponding part of the Kuro-shio at 33•‹N. Although there is no conspicuous
structure under the outbreak water, there is a tendency for concentrated isotherms to extend. down to 500m. This structure seems to corre-spond to the south edge of the warm eddy off Shikoku. It is conjectured that the out-break occurred when the water was overflow-ing along the edge of the warm eddy.
3. Discussion
3.1. Consideration of horizontal heat transfer by the outbreak
Assuming the thickness of the outbreak to be 100m from Fig. 5 and multiplying the area of the outbreak water by the difference of temperature between the outbreak water and the surrounding water (3) as estimated from Fig. 2, we may calculate the approximate excess heat transported by the outbreak to this region as 1•~1020J. This amount can be com-pared with the annual heat loss of 2•~1021J as estimated from an annual average time rate of heat loss of 100 W m-2 (e. g. Hsiung, 1985; Iwasaka and Hanawa, 1990) for this 800km•~ 800km region (from Honshu to the Subtropical Front and from the Nansei Islands to the Izu Islands). We may conclude that about twenty outbreaks of this kind in a year can
compen-Fig. 4. Ship-drift current vectors during Leg II(1-11
May 1988) of the Hakuho Maru
Cruise, KH-88-2.
sate for the heat loss to the atmosphere
in this
region of the ocean.
On the basis of their analyses
of intensive
temperature
data
observed
at the
former
OWS-T, Kurasawa
et al. (1983) inferred that
the process of horizontal
oceanic heat
conver-gence in the OMLET region was primarily
the
advection
of small warmer water masses from
the Kuroshio.
The present
study
supports
their inference.
This kind of temperature
rise
seems to occur several times during the year as
seen in Fig. 5 of Otobe et al. (1989) and Fig. 6
of Kurasawa
et al. (1983).
However,
observa-tion of such an outbreak
can be made with
302 TOBA, KAWAMURA, HANAWA, OTOBE and TAIRA
Fig. 5. Temperature section along the 137•‹E meridian made by the Hakuho Maru
Cruise KH-88-2 and the Tansei Maru Cruise KT-88-6, both on 3-10 May 1988.
satellite infrared data only when there are no
clouds.
The next occasion of a very similar
outbreak,
which
was clearly
observed
with
satellite data, occurred in January
1989.
3.2.
Counterpart of the Gulf Stream
phenom-ena
Cornillon et al.(1986)
found a "Warm
Out-break" as a possible mechanism that transports
heat from the Gulf Stream to the Sargasso Sea.
The outbreak
of the Kuroshio may correspond
to this kind of Warm Outbreak.
The Kuroshio
frequently
shows a typical
flow pattern called the Large Meander past the Kii Peninsula. As described earlier, the presentwarm outbreak occurred at the southwest
corner of the Large Meander, where the
Kuro-shio path had maximum curvature. Since the
Kuroshio Large Meander is almost fixed in
location, if the heat transport from the Kuro-shio to this part of the ocean always occurs at this specific position, it would be appropriate to call this warm outbreak, say, the "Kuroshio Meander Outbreak".
Acknowledgments
We acknowledge the captains, officers, and
crews of the Hakuho Maru KH-88-2 and the