© the Mammalogical Society of Japan MSJ MSJ Mammal Study Mammal Study 1348-6160
the Mammalogical Society of Japan Original papers
Nutritional condition and dietary profile of Japanese black bear
(
Ursus thibetanus japonicus) killed in western Japan in autumn 2004
Body condition and diet of black bears
Toru Oi
1,* and Hitomi Furusawa
21 Kansai Research Center, Forestry and Forest Products Research Institute, Momoyama, Kyoto 612-0855, Japan 2 Forestry and Forest Products Research Institute, Matsunosato, Tsukuba 305-8687, Japan
12 2008 12 2008 33 4 163 171 Received 19.5.2008 ; accepted 7.8.2008 Copyright © 2008 MSJ 2008
Abstract. The nutritional conditions and dietary profiles of Japanese black bears that intruded into residential areas in Hiroshima, western Japan, in autumn 2004 were estimated. Nutritional conditions were evaluated using a morphometric index, the body-condition index (BCI) deduced for the American black bear, which has similar morphology and physiology to the Japanese black bear. The BCI had a wide range, from –3.0 to 3.5, indicating a wide range of nutritional conditions of the bears. There were no significant effects of age class, sex, or month of capture on the BCI. Dietary profiles were estimated by measuring the carbon and nitrogen stable isotope ratios (δ13C, δ15N) of bear hairs, which archive information on dietary changes during the growth of the hair. These values indicated wide-ranging diets that included C3 plants, animal matter, and anthropogenic food, and identified
marked individual differences in dietary profiles. Individuals with a high BCI tended to consume high-δ15N food such as animal matter and acorns. Because the proportion of individuals that acquired the high-δ15N food was small, the amount and distribution of such food items might have been restricted and subject to competition among bears in Hiroshima in autumn 2004.
Key words: body condition, diet, Japanese black bear, stable isotope analysis.
Introduction
In some years, many Japanese black bears (Ursus thibetanus japonicus) intrude into residential areas in au-tumn (Japan Wildlife Research Center 2005; Oi 2005), increasing the incidence of human injuries caused by bear attacks. Thus, many bears are killed as a counter-measure to these intrusions. It is important to clarify the mechanism of this behavior by bears to prevent such human-bear accidents. Although low forest fruit pro-duction in autumn, when bears become hyperphagic in preparation for hibernation, is considered to be the puta-tive cause of this behavior (Oka et al. 2004; Oi 2005), the actual food habits and nutritional conditions of bears during these intrusions are not known.
It is important to evaluate the nutritional condition of bears to interpret behavioral changes in relation to fluctuations in food availability within a given habitat (Hellgren et al. 1993; Stirling et al. 1999). However, there are no practical indices that precisely represent the nutritional condition of the Japanese black bear. Cattet et al. (2002) proposed the body-condition index (BCI), which correctly predicts the nutritional condition of the
polar bear (Ursus maritimus), brown bear (Ursus arctos), and American black bear (Ursus americanus) based on residuals from the regression of total body mass (TBM) against straight-line body length (SLBL). The BCI has a close positive relationship with true body condition, measured as the standardized residual of the combined mass of fat and skeletal muscle against SLBL, in bears that were dissected to determine individual tissue masses. The BCI also has a close positive relationship with the standardized residual of fat mass against SLBL. Both fat and skeletal muscles represent a major source of stored energy (Atkinson et al. 1996). Thus, we evaluated the nutritional condition of bears using the BCI.
We estimated the dietary profile of bears by measuring the carbon and nitrogen stable isotope ratios (δ13C, δ15N)
along growth sections of bear hairs (Michael et al. 2003; Mizukami et al. 2005). More long-term and less-biased dietary information can be obtained via stable isotope analysis of animal tissues than by direct observation, scat analysis, and stomach content analysis, which can only archive dietary information for <1 week (Robbins et al. *To whom correspondence should be addressed. E-mail: [email protected]
Mammal Study 33 (2008) 164
2004). Nakashita (2006) provided two alternate types of food that had remarkably different stable isotope signa-tures to captive Japanese black bears and demonstrated that sections of bear hair preserve isotopic information about the individual’s food sources for a given time period when the section of the hair grows. The hair of Japanese black bears grows at a relatively constant rate during approximately June to October, and the hair that grew in the previous year is molted between July and September (Nakashita 2006). Thus, hairs sampled in October and November grew in the year sampled and may archive temporal fluctuations in the stable isotope ratios of the diet from early summer to autumn of the year sampled (Nakashita 2006).
Materials and methods
Bear samples
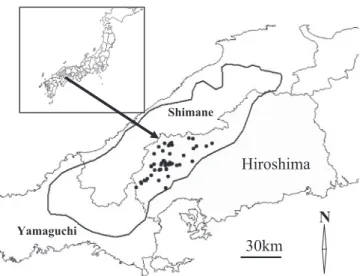
In autumn 2004, many bears intruded into residential areas in Hiroshima prefecture in the western part of Honshu, Japan (Fig. 1). The bear population in Hiroshima prefecture is part of the Western Chugoku population, which is isolated and consists of approximately 300–740 bears within a 7,000 km2 area (Japan Wildlife Research
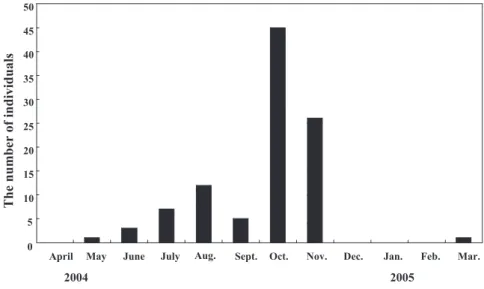
Center 2006). The hunting of bears in this area has been prohibited since 1994 to conserve the population, but kills of nuisance bears have been permitted. One hundred and five nuisance bears were killed in 2004, whereas 10 to 30 bears were killed each year from 1994 to 2003. With the help of the Hiroshima prefecture gov-ernment, we obtained samples and body measurements from 80% of the bears killed in October and November, when many bears intruded into residential areas. The number of bears killed in these 2 months accounted for 73% of the total number of bears killed in 2004 (Fig. 2). Fifty-six bears were analyzed, excluding five cubs because the cubs followed their mothers and their food might have depended on that of the mothers.
The age of each bear was determined by counting cementum annuli of sectioned roots of lower fourth pre-molars (Craighead et al. 1970), and bears were classified into age classes. The age class “young” was assigned to animals 1 to 3 years old, which are assumed to be repro-ductively immature (Komatsu et al. 1994; Katayama et al. 1996). The age class “adult” was assigned to animals ≥ 4 years old. The samples comprised 21 adult males, 25 adult females, 6 young males, and 4 young females.
Nutritional condition
We used the equation for the BCI of American black bear to calculate the BCI of Japanese black bear because these two species have similar body size, body shape, and physiology (Nowak 1999). The BCI for American black bear is calculated as follows:
BCI = (lnTBM – 3.21 × lnSLBL + 11.64) /(0.29 – 0.017 × lnSLBL)
where TBM is the total body weight in kilograms, and SLBL is the straight-line body length in centimeters. Dietary profile
Hairs for the stable isotope analysis were sampled from the frontal region of the head. Hairs with the hair root were cut from root to tip in sections of 5 mm. As the hair sections become shorter, more information on diachronic dietary change could be obtained, but effi-ciency in preparing samples will decrease. We obtained 50 samples composed of four sections, three samples of five sections, two samples of three sections, and one sample of seven sections. A hair section of 5 mm will preserve dietary information for about 0.7–1.3 months if the presupposition that the hair grows at constant rate during approximately June to October (Nakashita 2006) is correct. The corresponding sections of hairs were pooled for each bear and treated as a unit for analysis. The unit of hair sections was rinsed with 2:1 chloro-form:methanol solution to remove lipids and air dried.
Approximately 300 μg of hair sections (5–10 hair Fig. 1. Map of the research site. The gray area indicates Hiroshima prefecture; dots indicate locations where samples were obtained; the bold line delineates the area of the Western Chugoku population.
sections) from each unit was enclosed in a tin cup and combusted in an element analyzer (NC-2500, Thermo Electron Inc.) interfaced to a mass spectrometer (MAT-252, Thermo Electron Inc.). The results of measure-ments were expressed as follows:
δ13C or δ15N = [(R
sample/Rstandard) – 1] × 103,
where R is 13C/12C or 15N/14N. The R
standard for δ13C or
δ15N was the Pee Dee Belemnite standard or atmospheric
nitrogen, respectively. The precision (standard devia-tion) of isotopic measurements was estimated by repeat-edly measuring glycine standards and was 0.12‰ (n = 60) for δ13C and 0.19‰ (n = 63) for δ15N.
The stable isotope ratio of the hair of Japanese black bears will give a higher value than the food that was con-sumed because of fractionation or diet-tissue enrichment. For δ13C, the fractionation value is presumed to be 2‰
based on feeding experiments using captive bears (Hilderbrand et al. 1996; Felicetti et al. 2003; Nakashita 2006). For δ15N, the fractionation value is presumed to
be 3‰ when invertebrates are consumed, 4‰ when mammals are consumed, and 5‰ when plants are con-sumed, based on feeding experiment using captive bears (Hilderbrand et al. 1996; Felicetti et al. 2003; Robbins et al. 2005; Nakashita 2006). By adding 2 and 3–5‰ to the δ13C and δ15N, respectively, of potential bear food, the
δ13C and δ15N of the hair of the bear that consumed the
food can be estimated.
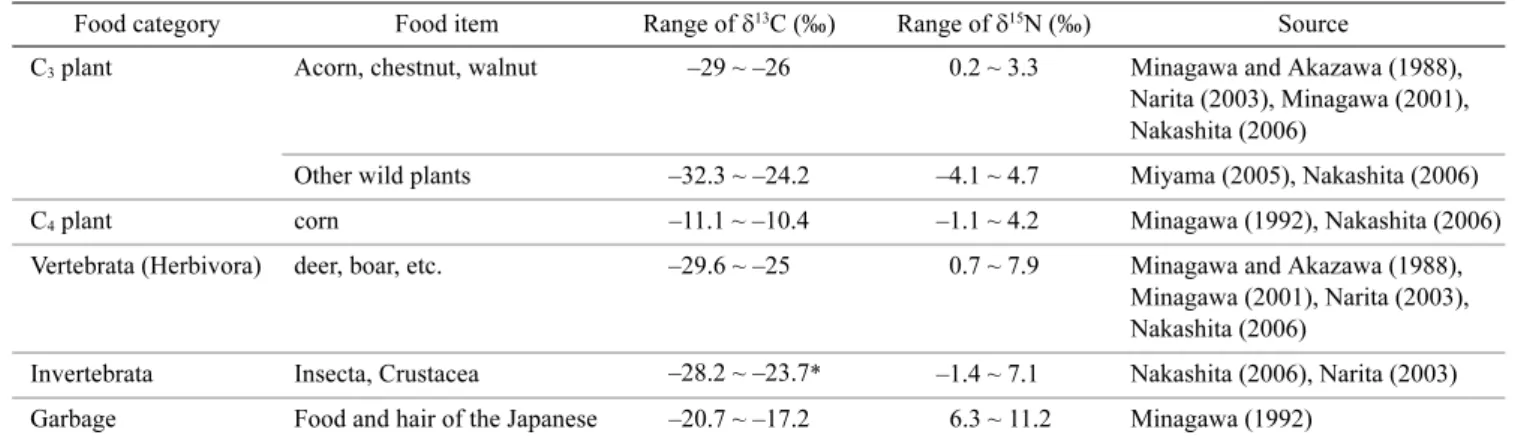
The δ13C and δ15N of potential bear food were obtained
from Minagawa and Akazawa (1988), Minagawa (2001), Narita (2003), and Nakashita (2006; Table 1). Bears are
omnivorous, and the diet generally consists of leaves and shoots in spring; succulent forbs, soft mast, and inverte-brates in summer; and soft and hard mast in autumn (Hashimoto and Takatsuki 1997). They also hunt and scavenge vertebrates such as the serrow, wild boar, and sika deer. Some of the food consumed by bears has a distinctive stable isotope signature. Corn is just one of the C4 plants planted in the region, and has a markedly
higher δ13C (–11.1 to –10.4‰) than do C
3 plants such as
wild plants (–32.3 to –24.2‰), but has similar δ15N
(–1.1 to 4.2‰) to that of C3 plants (–4.1 to 4.7‰).
Human food waste, and cattle fodder that often contains C4 plant materials, and materials of ocean origin also
have higher δ13C (–20.7 to –17.2‰) and higher δ15N
(6.3 to 11.2‰) than do C3 plants. The tissues of wild
creatures tend to have higher δ15N (–1.4 to 7.9‰) than do
C3 plants, but similar δ13C (–29.6 to –23.7‰) to C3
plants.
Because the maximum δ13C and δ15 N of natural foods
are –23.7‰ (invertebrate) and 7.9‰ (vertebrate), respec-tively, hair sections with δ13C > –21‰ strongly imply
that the bear consumed a substantial amount of anthro-pogenic food, and those with δ15 N > 12‰ and δ13C <
–21‰ strongly imply that the bear consumed a substan-tial amount of animal matter in the wild. However, these criteria are only sufficient to predict the consumption of the different food materials when consumed separately and not in combination. According to the proportion of each food material consumed, the δ13C and δ15N have
values intermediate to those of the original value of each single food type. Thus, it is possible that a bear con-Fig. 2. Monthly change in nuisance kills in 2004 in Hiroshima.
Mammal Study 33 (2008) 166
sumed anthropogenic food if δ13C is <–21‰ and animal
matter if δ15N is <12‰.
Starvation and nutritional stress also affect the stable isotope signatures of animal tissues (Hobson et al. 1993; Voigt and Matt 2004). The δ15N enrichment of animal
tissues was observed when captive animals were sup-plied with a nutritionally poor diet (e.g., Japanese quail Coturnix japonicus, Hobson et al. 1993; nectar-feeding bats Glossophaga soricina, Leptonycteris curasoae, Voigt and Matt 2004) and when wild Ross’ Goose (Chen rossii) had been fasting because of nesting (Hobson et al. 1993). Protein synthesis using catabolized nitrogenous compounds derived from the animal’s own body is the putative mechanism of this elevation in δ15N because an
animal’s body is already enriched in 15N relative to its
diet. We examined the presence of an increase in δ15N in
the rootmost hair section compared to the other sections of bear hair as evidence of starvation or nutritional stress when the BCI of bears was <–0.5, which is indicative of relatively poor nutritional condition.
Statistical analysis
We examined the effects of sex (male, female), age class (young, adult), and month when the bear was cap-tured (October and November) on the BCI using three-way ANOVA. In advance of the ANOVA, the BCI + 5 was square-root transformed to normalize the distribu-tion. The differences in stable isotope ratios among BCI classes were examined using the Mann-Whitney U test or Kruskal-Wallis test (two-tailed, significance level of 0.05). BCI was divided into three classes: high BCI, individuals ranked in the highest one-fourth in BCI; low BCI, individuals ranked in the lowest one-fourth in BCI;
and intermediate BCI, the remaining individuals. All statistical analyses were performed using SYSTAT 10 statistics software (SPSS Science Marketing Depart-ment, SPSS Inc., Chicago, IL).
Results
Body-condition index
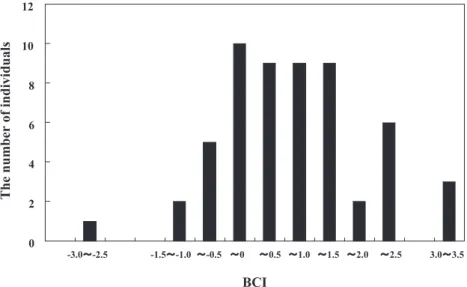
We summarized the TBM and HBL of each age class (Table 2). The BCI ranged from –3.0 to 3.5 (mean ± SD; 0.64 ± 1.2; Fig. 3). There were no significant effects of age class, sex, or month of capture, and there were no significant interactions among any combination of these factors except for Sex × Age-class × Month (Table 3). The average BCI of the young (0.25 ± 1.4) was lower than that of the adults (0.72 ± 1.1), although they did not differ significantly (U = 262.5, P = 0.487).
Stable isotope ratios
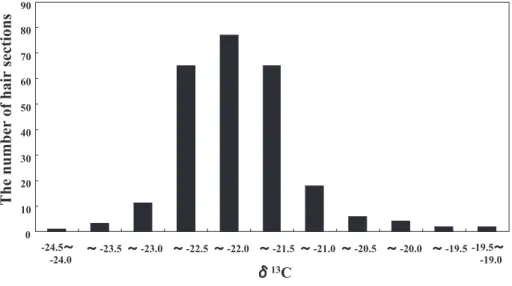
The δ13C of hair sections ranged from –24.1 to –19.3‰
(mean ± SD‰; –22.0 ± 0.7‰; Fig. 4), indicating that the bears consumed both natural and anthropogenic foods. The δ13C of 13 hair sections of eight bears (14%) was
>–21‰, implying the consumption of anthropogenic food.
The δ15N of hair sections ranged from 1.4 to 6.5‰ (4.0
± 0.9‰; Fig. 5). Thus, it is unclear whether the bears consumed animal matter because these values over-lapped those expected for the consumption of only C3
plant matter (0.9 to 9.7‰).
The difference between the maximum and minimum stable isotope ratios within a series of hair sections from a single bear was 0.1 to 3.3‰ for δ13C and 0.2 to 2.9‰
Table 1. The δ13C and δ15N of a potential bear diet
* The measurements (–20.1‰ and –20.3‰ in δ13C) for two samples of Camponotus obscuripes (Invertebrata) obtained by Nakashita (2006) were
excluded as outliers.
Food category Food item Range of δ13C (‰) Range of δ15N (‰) Source
C3 plant Acorn, chestnut, walnut –29 ~ –26 0.2 ~ 3.3 Minagawa and Akazawa (1988),
Narita (2003), Minagawa (2001), Nakashita (2006)
Other wild plants –32.3 ~ –24.2 –4.1 ~ 4.7 Miyama (2005), Nakashita (2006) C4 plant corn –11.1 ~ –10.4 –1.1 ~ 4.2 Minagawa (1992), Nakashita (2006)
Vertebrata (Herbivora) deer, boar, etc. –29.6 ~ –25 0.7 ~ 7.9 Minagawa and Akazawa (1988), Minagawa (2001), Narita (2003), Nakashita (2006)
Invertebrata Insecta, Crustacea –28.2 ~ –23.7* –1.4 ~ 7.1 Nakashita (2006), Narita (2003) Garbage Food and hair of the Japanese –20.7 ~ –17.2 6.3 ~ 11.2 Minagawa (1992)
for δ15N. Most (86%) of the observed differences
between the maximum and minimum δ13C within hair
sections of a single bear and 30% of the same values for δ15N were greater than the measurement error (P < 0.05;
0.47‰ for δ13C, 0.74‰ for δ15N, estimated as 2 × 1.96 ×
SD of measured values for standard glycine). This indi-cates substantial changes in the stable isotope ratio of the hair while the hair was growing. The patterns of temporal change in the stable isotope ratio in series of
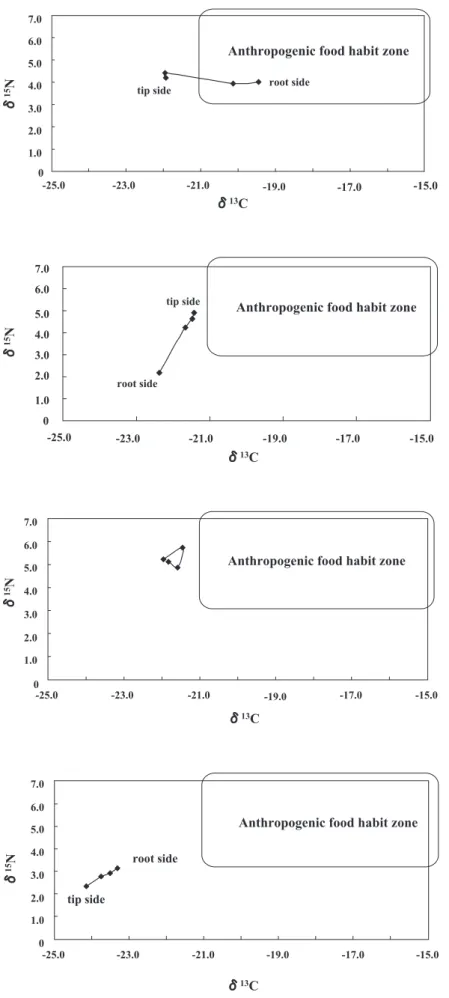
hairs varied, indicating individual differences in dietary profile. For example, of eight bears that might have consumed anthropogenic food, one had an anthropogenic food signature in the tip of hair sections, three had it in the root side of hair sections (Fig. 6), three had it in the middle hair sections, and one had it in all sections. Of 48 bears that had no anthropogenic food signature, 12 bears had a change in δ15N from high (>4‰, the midpoint of
the observed δ15N range) to low from the hair tip to the
Table 2. The total body mass (TBM) and the straight-line body length (SLBL) of each sex-age class of bear
Values indicate the mean ± standard deviation and range.
Adult male Adult female Young male Young female TBM (kg) 72.3 ± 19.8 58.7 ± 15.7 39.0 ± 10.2 38.0 ± 13.3
39~125 35~98 27~57 27~56
SLBL (cm) 137.3 ± 10.7 124.0 ± 8.6 112.0 ± 10.1 118.5 ± 13.3
120~159 103~142 101~122 102~130
Fig. 3. The distribution of the body-condition index (BCI) of the bears.
Table 3. The results of ANOVA for the effects of sex, age class, month of capture, and their interactions on the body-condition index (BCI) of bears
Source Sum of squares df Mean Squares F-ratio P
Sex 0.164 1 0.164 0.126 0.724
Age-class 4.073 1 4.073 3.128 0.083
Month 0.135 1 0.135 0.104 0.749
Sex × Age class 3.085 1 3.085 2.369 0.130
Sex × Month 4.291 1 4.291 3.295 0.076
Age class × Month 0.384 1 0.384 0.295 0.590
Sex × Age-class × Month 5.937 1 5.937 4.559 0.038
Mammal Study 33 (2008) 168
root (Fig. 7), and two bears had a change in δ15N in the
reverse direction. Eight bears had consistently high δ15N
(Fig. 8), whereas 17 bears had consistently low δ15N
(<4‰; Fig. 9). Nine bears showed other patterns of fluctuation in δ15N.
We looked for an increase in δ15N in the rootmost
sec-tion, which likely grew just before the bear was captured, by comparing it to the δ15N of other sections, as evidence
of serious starvation or nutritional stress when the BCI of the bear was <–0.5 (eight bears). An increase in δ15N
was observed in only two individuals, but the maximum increases were only 0.6 and 0.3‰, which were smaller than the measurement error.
The relationship between BCI and the stable isotope ratio
The BCI was not influenced by age class, sex, or month of capture. Consequently, all of the data were pooled. The means and standard deviations of δ15N of all
hair segments from a single bear in the high, intermedi-ate, and low BCI classes were 4.1 ± 0.6‰ (n = 14), 3.9 ± 0.7‰ (n = 28), and 3.6 ± 0.7‰ (n = 14), respectively, and did not differ significantly among BCI classes (Kruskal-Wallis test, H = 4.18, P = 0.124). The means and standard deviations of δ13C of all hair segments from
a single bear in the high, intermediate, and low BCI classes were –22.1 ± 0.6‰ (n = 14), –22.1 ± 0.6‰ (n = Fig. 4. The distribution of δ13C in hair segments.
Fig. 9. The typical diachronic change in the stable iso-tope ratio showing consistently low δ15N and low δ13C. Fig. 8. The typical diachronic change in the stable iso-tope ratio showing consistently high δ15 N and low δ13C. Fig. 7. The typical diachronic change in the stable isotope ratio showing high to low change in δ15N with
constantly low δ13C.
Fig. 6. The typical diachronic change in the stable isotope ratio, which might reflect anthropogenic food consumption.
Mammal Study 33 (2008) 170
28), and –22.2 ± 0.7‰ (n = 14), respectively, and did not differ significantly among BCI classes (Kruskal-Wallis test, H = 0.113, P = 0.945). The means and standard deviations of δ15N in the latter half of the hair segment
series (two fourths of hair cut into four sections, one third of hair cut into three sections, two fifths of hair cut into five sections, and three sevenths of hair cut into seven sections) from a single bear, which might have grown in late summer and autumn, in the high, interme-diate, and low BCI classes were 4.0 ± 0.9‰ (n = 14), 3.7 ± 0.6‰ (n = 28), and 3.3 ± 0.8‰ (n = 14), respectively, and differed significantly among classes (Kruskal-Wallis test, H = 6.597, P = 0.037). The means and standard deviations of δ13C in the latter half of hair segment series
from a single bear in the high, intermediate, and low BCI classes were –22.1 ± 0.9‰ (n = 14), –22.3 ± 0.5‰ (n = 28), and –22.2 ± 0.9‰ (n = 14), respectively, and did not differ significantly (Kruskal-Wallis test, H = 0.198, P = 0.91). Bears that had a high δ15N signature (>4‰) in the
latter half of the hair segment series composed 21% of the bears examined.
Discussion
Body condition
The wide range of BCI indicates that bears that intruded into residential areas had a wide range of nutri-tional conditions. These individual differences in BCI were not the result of age class, sex, or month of capture. Hashimoto and Yasutake (1999) reported that the body weight of captive adult female bears increased rapidly during the period from November to December as a result of hyperphagia in preparation for hibernation. Some variation in BCI might be explicable by such sea-sonal changes in weight, although we did not find an effect of month of capture. The range of BCI in October (–1.2 to 3.8) was as wide as that in November (–0.9 to 3.5, with one outlier of –3.0; Fig. 3), which suggests that there were marked individual differences in nutritional condition in both October and November. The age class may affect the BCI because the small body size of young individuals causes inefficient expenditure of acquired energy and is a disadvantage in competition for food. The young age class had smaller average BCI than did the adult class, although not significantly so. It is possi-ble that the small sample size of the young age class might have resulted in type II error. Further study based on larger samples is needed to clarify the influence of age class on the BCI.
The relationship between dietary profile and body condition
The wide range of δ13C and δ15N suggests marked
individual differences in food acquisition, which might influence the BCI. Individuals with a high BCI tend to have high δ15N in the root side of hairs, implying that
they depended on high-δ15N food items in late summer
and autumn. This food might be animal matter, acorns, or both, in addition to anthropogenic food. Insects are candidates for the high-δ15N food items in the summer
because they are abundant and are found in bear feces frequently in summer (Hashimoto and Takatsuki 1997). The high-δ15N food items available in autumn might
include hard mast such as Quercus acorns. Hard mast tends to have higher δ15N than other C
3 plant food items
(Narita 2006), although the ranges of δ15N overlap
(Table 1); the identification of acorn consumption via δ15N is difficult. The analysis of feces and stomach
con-tents help to solve this question. Anthropogenic food such as human food waste, cattle fodder, and corn also provide nutrition to bears. Only 14% of the bears were suspected to have consumed anthropogenic food. Because the proportion of individuals that acquired anthropogenic food and high-δ15N food was restricted
and small, the amount and distribution of such food items might have been restricted and subject to competi-tion among bears in Hiroshima in autumn 2004. Future research should evaluate the actual abundance of such food items including hard mast.
Temporal fluctuations in δ13C and δ15N (typical
exam-ples are shown in Figs. 6 and 7) were observed in most bears, which might reflect seasonal changes in bear food availability (Hashimoto and Takatsuki 1997). Starvation can contribute to some δ15N enrichment (Hobson et al.
1993; Voigt and Matt 2004); however, the increase in δ15N in the series of hair segments observed in the two
bears with a BCI < –0.5 was smaller than the expected measurement error. Thus, we conclude that there was no evidence of seriously poor nutrient conditions that culmi-nated in autophagia.
Acknowledgements: We appreciate the kind support of the Hiroshima prefecture government, the Hiroshima Hunters Association, and the Hiroshima Environment and Health Association in collecting samples and infor-mation. We also appreciate technical guidance during stable isotope measurements from Dr. T. Abe and Dr. S. Kagawa of FFPRI, and support during sample prepa-ration by Ms. S. Segawa and Ms. S. Ohkubo. This
research was supported by the Pollution Control Research Fund of the Ministry of Environment, Japan.
References
Atkinson, S. N., Nelson, R. A. and Ramsay, M. A. 1996. Changes in the body composition of fasting polar bears (Ursus maritimus): the effect of relative fatness on protein conservation. Physiological Zoology 69: 304–316.
Cattet, M. R. L., Caulkett, N. A., Obbard, M. E. and Stenhouse, G. B. 2002. A body-condition index for ursids. Canadian Journal of Zoology 80: 1156–1161.
Craighead, J. J., Craighead, Jr., F. C. and McCutchen, H. E. 1970. Age determination of grizzly bears from forth premolar tooth sections. Journal of Wildlife Management 34: 353–363. Felicetti, L. A., Schwartz, C. C., Rye, R. O., Haroldson, M. A.,
Gunther, K. A., Phillips, D. L. and Robbins, C. T. 2003. Use of sulfur and nitrogen stable isotopes to determine the importance of whitebark pine nuts to Yellowstone grizzly bears. Canadian Journal of Zoology 81: 763–770.
Hashimoto, Y. and Takatsuki, S. 1997. Food habits of Japanese black bears: a review. Honyurui Kagaku [Mammalian Science] 37: 1– 19 (in Japanese with English abstract).
Hashimoto, Y. and Yasutake, A. 1999. Seasonal changes in body weight of female Asiatic black bears under captivity. Mammal Study 24: 1–6.
Hellgren, E. C., Rogers, L. L. and Seal, U. S. 1993. Serum chemistry and hematology of black bears: physiological indices of habitat quality or seasonal patterns? Journal of Mammalogy 74: 304– 315.
Hilderbrand, G. V., Farley, S. D., Robbins, C. T., Hanley, T. A., Titus, K. and Servheen, C. 1996. Use of stable isotope to determine diet of living and extinct bears. Canadian Journal of Zoology 74: 2080–2088.
Hobson, K. A., Alisauska, R. T. and Clark, R. G. 1993. Stable-nitrogen isotope enrichment in avian tissues due to fasting and nutritional stress: implications for isotopic analysis of diet. Condor 95: 388–394.
Japan Wildlife Research Center. 2005. Special Report on Invasion of Asiatic Black Bears to Villages in 2004, Japan. Tokyo, Japan, 115 pp. (in Japanese).
Japan Wildlife Research Center. 2006. A Research Report on the Status of Bear Population in Western Chugoku Mountain Area. Tokyo, Japan, 9 pp. (in Japanese).
Katayama, A., Tsubota, T., Yamada, F., Kita, I. and Tiba, T. 1996. Reproductive evaluation of Japanese black bears (Selenarctos thibetanus japonicus) by observation of the ovary and uterus. Japanese Journal of Zoology and Wildlife Medicine 1: 26–32 (in Japanese with English summary).
Komatsu, T., Tsubota, T., Kishimoto, M., Hamazaki, S. and Tiba, T. 1994. Puberty and stem cell for the initiation and resumption of spermatogenesis in the male Japanese black bear (Selenarctos thibetanus japonicus). Journal of Reproduction and Development
40: 65–71 (in Japanese with English summary).
Michael, M., Auerswald, K. and Schnyder, H. 2003. Reconstruction of the isotope history of animal diets by hair segmental analysis. Rapid Communications in Mass Spectrometry 17: 1312–1318. Minagawa, M. 1992. Reconstruction of human diet from δ13C and
δ15N in contemporary Japanese hair: a stochastic method for
esti-mating multi-source contribution by double isotope tracers. Applied Geochemistry 7: 145–158.
Minagawa, M. 2001. Dietary pattern of prehistoric Japanese popula-tions inferred from stable carbon and nitrogen isotopes in bone protein. Bulletin of the National Museum of Japanese History 86: 333–357 (in Japanese).
Minagawa, M. and Akazawa, T. 1988. Food intake by Jomon people. Iden 42: 15–23 (in Japanese).
Miyama, K. 2005. Nitrogen stable isotope of plants in mountain ecosystem [Bachelor Thesis of Tokyo University of Agriculture and Technology], Tokyo, Japan, 10 pp. (in Japanese).
Mizukami, N. R., Goto, M., Izumiyama, S., Hayashi, H. and Yoh, M. 2005. Estimation of feeding history by measuring carbon and nitrogen stable isotope ratios in hair of Asiatic black bears. Ursus 16: 93–101.
Nakashita, R. 2006. Reconstruction of the feeding history of Asiatic black bear (Ursus thibetanus) by carbon and nitrogen stable iso-tope [Doctoral dissertation]. Tokyo University of Agriculture and Technology, Tokyo, Japan, 94 pp.
Narita, R. 2003. Dietary analysis on Asiatic black bears by stable isotope signature—importance of animal matter [Masters thesis]. Kyoto University, Kyoto, Japan, 37 pp.
Narita, R., Sugimoto, A. and Takayanagi, A. 2006. Animal components in the diet of Japanese black bears Ursus thibetanus japonicus in the Kyoto area, Japan. Wildlife Biology 12: 375–384.
Nowak, R. M. (ed.). 1999. Walker’s Mammals of the World 6th Edition. The Johns Hopkins University Press, Baltimore, Mary-land, USA.
Oi, T. 2005. Cause of frequent invasion on the residential area by Asiatic black bears. Forestry Chemicals 172: 9–16 (in Japanese). Oka, T., Miura, S., Masaki, T., Suzuki, W., Osumi, K. and Saito, S. 2004. Relationship between changes in beechnut production and Asiatic black bears in northern Japan. Journal of Wildlife Management 68: 979–986.
Robbins, C. T., Schwartz, C. C. and Felicetti, L. A. 2004. Nutritional ecology of ursids: a review of newer methods and management implications. Ursus 15: 161–171.
Robbins, C. T., Felicetti, L. A. and Sponheimer, M. 2005. The effect of dietary protein quality on nitrogen isotope discrimination in mammals and birds. Oecologia 144: 534–540.
Stirling, I., Lunn, N. J. and Iacozza, J. 1999. Long-term trends in the population ecology of polar bears in western Hudson Bay in relation to climatic change. Arctic 52: 294–306.
Voigt, C. C. and Matt, F. 2004. Nitrogen stress causes unpredictable enrichment of 15N in two nectar-feeding bat species. Journal of Experimental Biology 207: 1741–1748.