Vacancy effects on one-dimensional migration
of interstitial clusters in iron under
electron irradiation at low temperatures
著者
Satoh Y., Abe Y., Abe H., Matsukawa Y., Kano
S., Ohnuki S., Hashimoto N.
journal or
publication title
Philosophical Magazine
volume
96
number
21
page range
2219-2242
year
2016-06-23
URL
http://hdl.handle.net/10097/00120828
doi: 10.1080/14786435.2016.1194533This is an Accepted Manuscript of an article published by Taylor & Francis Group in Philosophical Magazine on 23/06/2016, available online:
http://www.tandfonline.com/10.1080/14786435.2016.1194533
Philosophical Magazine, 96 (2016) pp.2219–2242
Vacancy effects on one-dimensional migration of interstitial clusters in iron under electron irradiation at low temperatures
Y. Satoh1 , Y. Abe2 , H. Abe1* , Y. Matsukawa1 , S. Kano1* , S. Ohnuki3 , N. Hashimoto3 1
Institute for Materials Research, Tohoku University, 2-1-1 Katahira, Aoba-ku, Sendai 980-8577, Japan
2
Nuclear Science and Engineering Center, Japan Atomic Energy Agency, 2-4 Shirakata, Tokai-mura, Ibaraki 319-1195, Japan
3
Division of Materials Science and Engineering, Hokkaido University, N13 W8 Kita-ku, Sapporo, Hokkaido 060-8628, Japan
* Present address: Department of Nuclear Engineering, School of Engineering, The University of Tokyo, 2-22 Shirakata Shirane, Tokai, Ibaraki 319-1188, Japan
Abstract
We performed in-situ observation of one-dimensional (1D) migration of self-interstitial atom (SIA) clusters in iron under electron irradiation at 110–300 K using high-voltage electron microscopy. Most 1D migration was stepwise positional changes of SIA clusters at irregular time intervals at all temperatures. The frequency of 1D migration did not depend on the irradiation temperature. It was directly proportional to the damage rate, suggesting that 1D migration was induced by electron irradiation. In contrast, the 1D migration distance depended on the temperature: distribution of the distance ranged over 100 nm above 250 K, decreased steeply between 250 K and 150 K, and was less than 20 nm below 150 K. The distance was independent of the damage rate at all temperatures. Next we examined fluctuation in the interaction energy between an SIA cluster and vacancies of random distribution at concentrations 10-4
–10-2
, using molecular statics simulations. The fluctuation was found to trap SIA clusters of 4 nm diameter at vacancy concentrations higher than 10-3
. We proposed that 1D migration was interrupted by impurity atoms at temperatures higher than 250 K, and by vacancies accumulated at high concentration under electron irradiation at low temperatures where vacancies are not thermally mobile.
1. Introduction
Self-interstitial atom (SIA) clusters perform one-dimensional (1D) migration: glide motion along the Burgers vector with low activation energy [1,2]. In a recent theory of defect structural evolution under high-energy neutron irradiation, 1D migration is regarded as a potential mechanism for controlling the kinetics of defect reactions. For example, SIA clusters are produced directly from collision cascades, after which they escape quickly from the damage zone through 1D migration, which biases the kinetics to vacancy dominance in the production bias model [3]. The 1D migration is responsible for void swelling and heterogeneous defect distribution near dislocations and grain boundaries. The 1D migration is therefore of practical and fundamental importance in relation to nuclear materials research.
Molecular dynamics (MD) simulations predict fast 1D random walks of SIA clusters in iron [4–7], but do not correspond to experimental observations. For example, most SIA clusters are in a stationary state under post-irradiation observation using a conventional 200 kV transmission electron microscope at room temperature (300 K). Instead, through in situ observation using high-voltage electron microscopy (HVEM), it has long been known that SIA clusters larger than a few nanometers perform
intermittent 1D migration with irregular time intervals under electron irradiation [8,9]. One interpretation is that impurity atoms affect 1D migration, even in
high-purity iron [10,11]. In the model, the SIA clusters are fundamentally mobile at low activation energy, but are usually in a stationary state, being trapped by impurity atoms through elastic interaction. Impact with fast electrons induces detrapping to initiate 1D migration. The liberated cluster performs 1D migration until it is trapped again by another impurity atom. The diffusion coefficient of free 1D migration is so high that the cluster is observed to jump from one impurity to another. Namely the 1D migration of SIA clusters is interrupted by impurity atoms in the model. Besides, the stepwise 1D migration corresponds to the free path of SIA clusters. This model is consistent to the following experimental observations at 300 K [10–12]. 1) The 1D migration distance is reduced in specimens containing larger amounts of solute/impurity atoms. 2) The frequency of 1D migration, the average number of 1D migration events observed per single SIA cluster during a unit time, is proportional to the electron beam intensity. Turning to 1D migration at elevated temperatures where the impurities are thermally mobile, SIA clusters are reported to show continuous 1D migration without help from electron irradiation: the clusters are considered to migrate being bound with interstitial impurity atom [13]. Besides the contribution of other traps has been suggested:
[18–20], other SIA clusters [9,21], and a low-symmetry (‘non-parallel’) configuration in SIA clusters [22].
The initial motivation for this study was to examine whether the model
described above interprets 1D migration behavior at low temperatures. We conducted in situ observation of 1D migration in iron under electron irradiation at temperatures of 110–300 K and with damage rates of 0.002–0.01 dpa s-1
. The 1D migration distance was greatly reduced below 250 K: a fact which could not be explained by the effect of impurities. Instead we considered effects of vacancies on 1D migration. Vacancies would be accumulated at high concentrations under electron irradiation at low
temperatures where vacancies are not thermally mobile. We conducted molecular statics (MS) simulation for interaction between an SIA cluster and high concentration of vacancies having a random distribution. We discuss the contributions of impurity atoms and vacancies on the 1D migration processes.
2. Experimental procedure
The iron specimen used in these experiments was obtained commercially. It was identical to that designated as Fe2 in earlier reports [10, 11]. We determined the
chemical compositions of as-received block specimens: amounts of carbon (28) and oxygen (14) using the infrared absorption method, and those of hydrogen (11) and nitrogen (4) using the thermal conductivity method. The values in the parentheses show the concentrations in atomic parts per million (appm). The substitutional elements were analyzed using glow discharge mass spectrometry (GDMS). If we exclude the
substitutional elements below the detection limit, then the total amount of substitutional impurities was 2.6 appm. We neglected the effects of hydrogen on 1D migration
because hydrogen has high diffusivity and low solubility that result in its segregation into grain boundaries or dislocations before irradiation. Consequently, the major impurities were found to be carbon, oxygen, and nitrogen.
Specimens for HVEM were prepared as follows. The block specimen was cold-rolled to 0.1 mm thickness. Then disc specimens of 3-mm-diameter were punched from the sheet. The surface layer of each specimen was chemically etched using
H2O2:HF:H2O (50:3:6) solution, followed by rinsing in H2O2:H2O (1:1). Then disc specimens were wrapped in molybdenum foil and were annealed in a quartz glass tube for 4 h at 1098 K in vacuum of about 10-4
Pa. Thin foil specimens were prepared for electron microscopy by electropolishing in HClO4:C2H5OH (1:19) solution.
The electron irradiation and in situ observation were performed at acceleration voltage of 1250 kV using HVEM (JEMARM-1300; JEOL Ltd.) at Hokkaido University.
The electron beam intensity was 14–2.9 × 10²³ e m-2
s-1
. It corresponds to the damage rate of 0.01–0.002 dpa s-1
[23], applying 20 eV as the threshold energy (Ed) for atomic displacement [24,25]. The specimen was mounted on a double-tilt liquid nitrogen cooling holder (636; Gatan Inc.). Temperature of the specimen stage was monitored and controlled using the built-in temperature sensor and electric heater.
Electron irradiation and in situ observation were made on wedge-shaped specimens at regions up to about 400 nm thickness. We used bright-field images under two-beam conditions with exciting 011 systematic reflections. The direction of
observation was near <111>. The direct magnification factor was 1 × 10⁵
or 6 × 10⁴ . Images on the fluorescent screen were recorded using a CCD camera at 30 frames per second through the viewing window of the HVEM. The recorded area was 291 nm × 158 nm and 466 nm × 253 nm, respectively, at magnification factors of 1 × 10⁵
and 6 × 10⁴
. The smallest limit of the clusters observed was 2–3 nm. We regarded all clusters showing clear contrast as SIA clusters.
The 1D migration of individual SIA cluster was analyzed frame-by-frame on the display of a personal computer. A single 1D migration event of an SIA cluster was a sequence from one stationary state to another through 1D migration, irrespective of the time spent for the 1D migration. The distance of 1D migration was that measured between the two stationary points. We identified the center of mass of a cluster image by the naked eye, and measured the position before and after the 1D migration. We ignored 1D migration of less than 2 pixels (about 1 nm) and ignored the sudden appearance and disappearance of cluster images [10].
3. Experimental results
3.1. 1D migration observed under electron irradiation at low temperatures
Each area was irradiated for a few minutes at a beam intensity of 1.4 × 1024 e m-2 s-1
(i.e., 0.01 dpa s-1
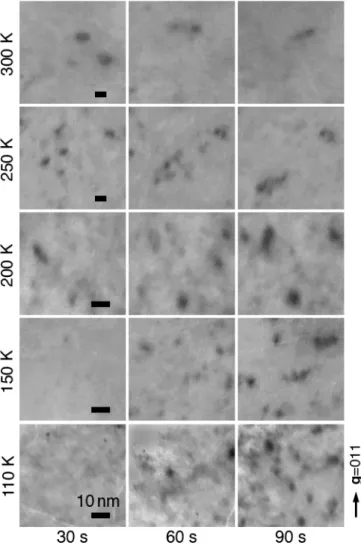
). Figure 1 presents a comparison of variation of SIA clusters under irradiation among different irradiation temperatures. Figure 2(a) shows time evolutions of the number of SIA clusters observed in a region of fixed size. The number of clusters increased in the nucleation process. It then decreased, probably attributable to
coalescence and escape to the specimen surface through 1D migration. The differences in the numbers of observed clusters among the experimental runs performed at the same condition partly occurred from the difference in specimen thickness between the
observed areas. The time evolution proceeded more rapidly at higher irradiation temperatures. The SIA clusters were fewer at 300 K than at other temperatures. The cluster did not form at 350 K or higher in the present experimental conditions.
Nucleated SIA clusters performed 1D migration. Most 1D migrations appeared as discrete jumps (i.e., stepwise positional changes) at irregular time intervals.
Sometimes we observed sets of several successive jumps, including back-and-forth motions between certain points. In iron at 300 K, the crystallographic orientation of most 1D migration is along <111>, and the rest along <100> [10]. The two directions were mutually distinguishable by in-situ observation along the direction close to <100>. From these experiments, however, we were unable to ascertain the direction of 1D migration because the specimen exhibited a strong {111} oriented texture, where projections of <111> and <100> mutually overlap.
3.2. Frequency of 1D migration
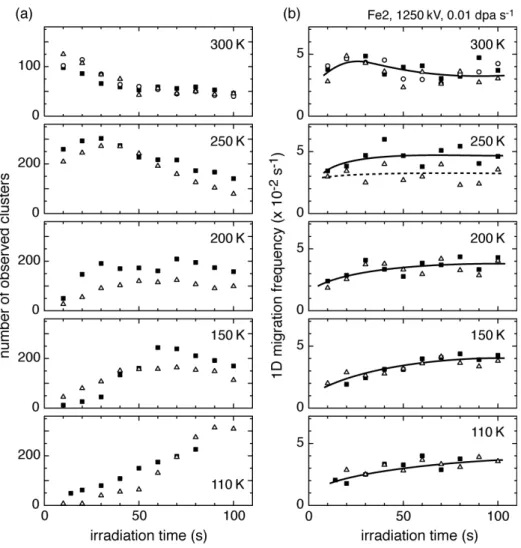
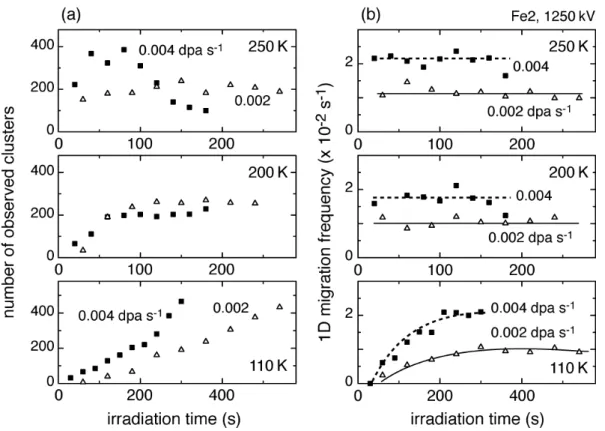
The frequency of 1D migration was the average number of 1D migration events observed per single SIA cluster during a unit time. We estimated the frequency from the total number of 1D migration events during a certain period (i.e., 10–60 s) and the number of all the SIA clusters observed at the central time of the period. Figure 2(b) presents time evolutions of the 1D migration frequency for steps of 10 s. The frequency did not depend strongly on the irradiation time. Below 250 K, the frequency was slightly lower in the early stage of irradiation, after which it increased to saturation. Figure 3 presents a comparison of the time evolutions of the number of SIA clusters and 1D migration frequency among different damage rates.
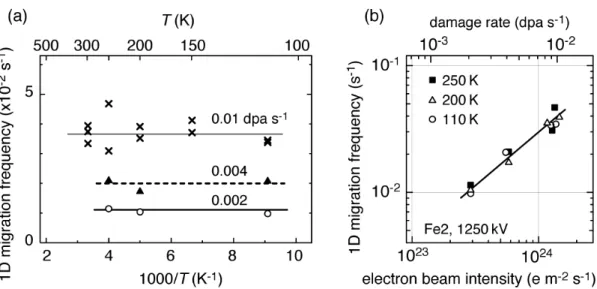
Figure 4(a) portrays the frequency in the saturation as a function of the
irradiation temperature. The frequency showed no temperature dependence. Figure 4(b) shows that the frequency in the saturation was almost proportional to the damage rate at low temperatures; it is the same damage rate dependence at 300 K [10]. The initiation of 1D migration would be driven by impact with fast electrons (i.e., athermal process).
3.3. Distance of 1D migration
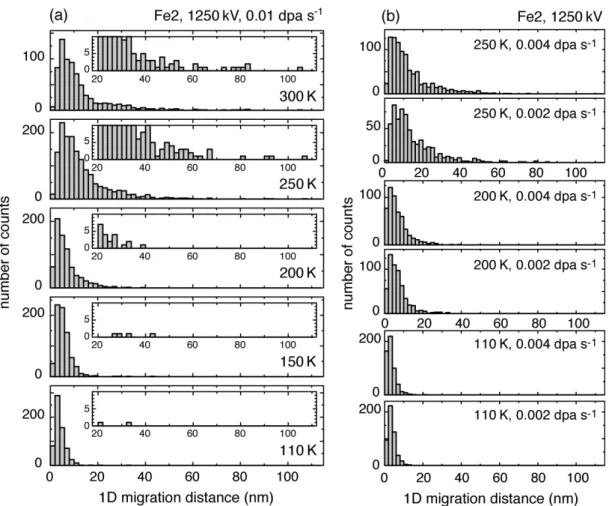
Figure 5(a) presents the temperature dependence of distance distribution of 1D migration observed from the start of irradiation to 100 s at a damage rate of 0.01 dpa s-1
. The probability of 1D migration monotonically decreased concomitantly with
increasing 1D migration distance at each temperature. The maximum distance was greater than 100 nm at 300 K, which is consistent with results described in an earlier report [10,11]. With decreasing irradiation temperature, the distance was greatly
reduced between 250 K and 150 K. The distance was less than 20 nm at 150 K and 110 K.
damage rates at 250 K, 200 K, and 110 K. The distribution did not depend on the damage rate at each temperature, or at 300 K [11]. Temperature dependence of 1D migration distance will not be interpreted straightforwardly based on the model that regards impurities as a trap for SIA clusters [10,11].
4. Interaction between SIA cluster and vacancies of random distribution
The interaction energy between a single vacancy and a 127-SIA cluster is reported as less than 0.2 eV in iron [14,15]. The low binding energy would not
immobilize SIA clusters even around 100 K on the experimental time scale (i.e., around 1 s). Electron irradiation at low temperatures induces vacancies at high concentrations, and the total interaction energy might be enough for the trapping. When an SIA cluster glides through vacancies of random distribution, the number of interacting vacancies fluctuates with the glide distance. As a result, the total interaction energy (also the self-energy of the cluster) fluctuates with the glide distance. Fluctuation of large
amplitude would act as a barrier against 1D migration. It is by analogy with trapping of SIA clusters by solute atoms: the interaction energy between a 217-SIA cluster and single solute copper atom is as low as around 0.1 eV in iron, but the amplitude of the fluctuation in the total interaction energy exceeds a few electron volts in concentrated alloys [26]. In this section, we examine the fluctuation amplitude of total interaction energy of SIA clusters gliding through random vacancies using MS method.
4.1. Calculation procedure
The calculation cell contained 1.3 × 10⁶
mobile atoms applied with an
interatomic potential for iron reported by Ackland et al. [27]. It had bcc structure with dimensions of 30 nm, 21 nm, and 24 nm, respectively, along the axes x 111
[
]
, y 112!" #$, and z 110!" #$. A periodic boundary condition was applied for all faces of the calculation cell. Next we introduced an SIA cluster, a hexagonal plate with Burgers vectorb = a 2 111
[
]
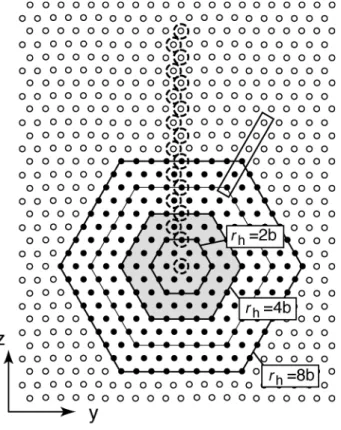
, at the cell center. The maximum radius rc of the cluster was 2b (19 SIAs), 4b (61 SIAs), or 8b (217 SIAs), where b denotes the interatomic distance along the close-packed directions of atoms <111>. A 217-SIA cluster has 4 nm diameter, which will be observed with HVEM in the above experimental condition. Weconsidered the calculation cell to consist of atomic rows along the x direction, i.e., the direction of the Burgers vector. Atomic rows on a hexagonal shell were grouped and labeled by the maximum radius rh of the shell, as shown in Figure 6. For example, all atoms on the periphery of a 217-SIA cluster belong to a shell for rh = 8b. The vacancy position was denoted by radius rh of the shell and the x coordinate of the vacancy.
We produced vacancies of random distribution having a concentration CV of 1×10⁻⁴, 3×10⁻⁴, 1×10⁻³, 3×10⁻³, or 1×10⁻² in the calculation cell. Then the cell was relaxed at zero pressure, and was regarded as the initial condition ( j = 0). An iteration of the following sequence yielded a total interaction energy profile for the glide distance of 2000b while introducing a random vacancy distribution. The cell size was fixed during relaxation in the following iteration.
1) The vacancies in the single atomic layer at the cell surface of
€
+ x side were
replaced by vacancies with a new random distribution. The formation energy of the cell after relaxation was denoted as Ej
b
. This operation is not expected to affect the interaction energy because the cluster was far from the surface layer.
2) The distribution of all the vacancies in the cell was translated to the
€
−x direction for a distance
€
b. The formation energy of the cell after relaxation was Ej+1a . The energy difference Eaj+1
− Ej b
is equivalent to the change in the total interaction energy when the cluster glides for a distance
€ b to the € + x direction: u( jb + b) − u( jb) = Ej+1 a − Ej b .
A critical issue would be a treatment of recombination between vacancies and the SIA cluster. Previous studies reported that an SIA at the cluster periphery glides for a distance of several
€
b along the direction of the Burgers vector to recombine with a
vacancy even in MS method (i.e., spontaneous reaction) [14–16]. The recombination decreased the total number of point defects and so the total formation energy of the cell, causing an apparent decrease in the interaction energy. However, the recombination would not contribute to trapping of the SIA cluster. After annihilation of a vacancy at the periphery of a 217-SIA cluster for example, 216-SIA cluster remains with a jog on the loop dislocation and is free from the attractive interaction. Instead, the vacancies that survive the recombination contribute to the trapping of SIA clusters.
In MS simulations, only the vacancies located in the shell of the cluster
periphery recombine with 127- and 19-SIA clusters [15,16]. In a MD simulation at 1000 K, a vacancy at the center of the cluster plane of 37 SIAs immobilized the cluster until the vacancy migrated to the periphery to recombine at 260 ps [15]. Another estimation is available: potential energy barrier for vacancy migration on the plane of a 61-SIA cluster from the center to the periphery where it can recombine [15]. The vacancy migration from rh = 3b to 4b (the cluster periphery) is spontaneous, while the migration energy inside the plane (e.g., from rh = 2b to 3b) was larger than 0.52 eV. However, the former seems to be inconsistent to the spontaneous recombination of vacancies only in the shell of cluster periphery in the above MS simulations [15].
MS calculation, we suppressed vacancy production in the shells where recombination was possible to occur: the shells were rh = rc− b, rc, and rc+ b for the cluster radius
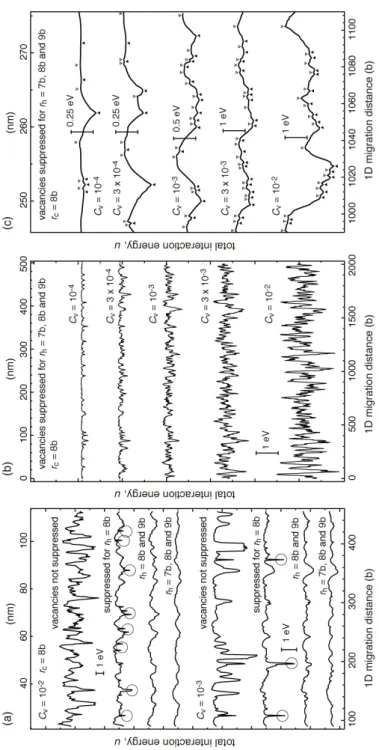
rc. Figure 7(a) compares the interaction energy profiles for a 217-SIA ( rc= 8b ) cluster at CV = 1×10⁻³ and 1×10⁻² with vacancy suppression among different shells. Without suppression of vacancies, the profiles show steep fluctuation. When vacancies were suppressed in the shell of the cluster periphery (rh = 8b), the fluctuation became moderate but had sudden drops deeper than 1 eV shown with circles. Examination of vacancy distribution revealed that recombination of a vacancy in the shell rh= 9b near the cluster corner is responsible for the drop. Then suppression in rh = 8b and 9b avoided the recombination. Although vacancies in rh = 7b did not recombine in the present MS calculation, we suppressed vacancies also in rh= 7b because of possible migration of vacancies suggested in [15]. Consequently, the total interaction energy would be an underestimation in the following two respects. 1) Vacancies were absent near the cluster periphery, where survived vacancies have strong interaction. 2) The actual concentration of vacancies was lower than the nominal concentration CV, although the difference was not greater than 1% of CV.
4.2. Results of calculation
Figures 7(b) and 7(c) present interaction energy profiles for a 217-SIA cluster as a function of the vacancy concentration CV. Symbols in Figure 7(c) show peak positions (i.e., hills and valleys) in the fluctuation. At the lowest vacancy concentration
CV = 1×10⁻⁴, the profile consisted of isolated peaks with energies of approximately 0.1 eV. At the next concentration CV= 3×10⁻⁴, the profile showed continuous fluctuation. With further increasing vacancy concentration CV, the fluctuation increased its amplitude but did not change much in terms of the wavelength.
Figure 8 portrays distributions of the energy difference Ep and distance dp
between neighboring peaks: a hill and the next valley. The energy difference Ep was distributed up to about 0.8 and 2 eV, respectively, for vacancy concentrations CV of 1×10⁻³ and 1×10⁻². Peaks around 1 eV observed for C
V above 1×10 −3 are expected to act as a barrier for 1D migration, even on an experimental time scale. Symbols in Figure 8(b) show a correlation between the energy difference Ep and the peak distance dp: peaks with greater mutual distance dp tended to have a larger energy difference Ep. In fact, peaks having small mutual distance dp would be negligible in terms of 1D migration, except at very low temperatures.
It is useful to interpret the total interaction energy profile as a function of vacancy concentration CV and cluster radius rc. By analogy with interaction between
an SIA cluster and solute atoms in random binary alloys [26], we assume that the total interaction energy be given by superposition of interaction energy f between an SIA cluster and individual vacancy. For the interaction energy f , see Appendix B, as well as previous reports from 7- to 127-SIA clusters [14–16].
When the vacancy concentration CV is extremely low, a gliding SIA cluster occasionally incorporates a single vacancy in its interaction volume. Each incorporated vacancy produces an isolated peak (corresponding to the interaction energy f ) in the total interaction energy profile. With increasing vacancy concentration, the respective peaks mutually overlap. Assuming 250 atomic rows as the total cross section σ , and 10b as the interaction range α (along the direction of the Burgers vector) for a 217-SIA cluster, the critical concentration of vacancies for the overlapping
CV ≈ 1 2ασ
(
)
yields 2 ×10⁻⁴, which is consistent with the vacancy concentration dependence of the total interaction energy profiles presented in Figures 7(b) and 7(c): the peaks overlap at CV= 3×10⁻⁴. The critical concentration was approximately3×10−3, and greater than 1×10⁻² for cluster radii
rc, respectively, of 4b and 2b. Above the critical concentration, the fluctuation wavelength does not depend on the vacancy concentration CV but on the range α of interaction energy f [26]. In contrast, the fluctuation amplitude increased in proportion to the square root of vacancy concentration CV1 2, as described in Appendix A.
Figure 9 compares the average amplitude of the fluctuation V[u]1 2
between the MS calculation and Equation (A2) for the superposed interaction energies. Two results showed good correspondence, suggesting the applicability of the superposition. We made three trials using different random seeds for vacancy distribution for a 19-SIA cluster( rc= 2b ) at CV= 10
−3, because the volume for strong interaction (
σ0 = 1)
incorporates only two vacancies on average during 1D migration for 2000b . In concentrated alloys with solute concentration higher than several percent, solute–solute interaction also contributed to the total interaction energy [26]. In the present calculation for vacancy concentrations up to 10-2
, vacancy–vacancy interactions were negligible. It is noteworthy that the fluctuation wavelength above the critical concentration was longer for vacancies than for solute copper atoms: the distance between peaks dp ranged to 15b for vacancies and 8b for copper atoms [28]. The difference is thought to reflect the longer interaction range for a vacancy (Figure 12) than a solute copper atom (Figure 6 in Ref. [26]).
5. Discussion
5.1 Analysis of the experimental 1D migration distance
We analyzed the experimental 1D migration distance based on the model proposed in earlier reports [10,11]. First, we summarize the model briefly. An SIA cluster has a certain region (cross section
€
σ expressed as the number of atoms) on the cluster plane. A trap (concentration CT) on the region immobilizes the cluster through the elastic interaction. Distance of 1D migration corresponds to the free path of the SIA cluster gliding through the traps of random distribution. When the trap concentration is extremely low σ CT
(
<< 1)
, the probability p(x) of 1D migration with a distance xb obeys the geometrical distribution asp(x) = Pg(x,σ CT) = σ CT
(
1−σ CT)
x−1. (1)
The logarithm of the probability Pg(x,σCT) shows a linear relation to the 1D migration distance. One can estimate σ CT from the semi-logarithmic plot of the distribution; the gradient is ln 1−σ C
(
T)
≈ −σ CT.The distributions of 1D migration distances in Figure 5 are shown in Figure 10 using the semi-logarithmic scale. Each distribution was fitted by a straight line, showing the applicability of the above model [10,11]. The distance at 150 K and 110 K was so short that we did not ascertain whether the distribution obeys the geometrical
distribution, or not.
Besides, we estimated statistical dispersion of the distance distribution based on the proposed model as follows. Suppose the total counts of 1D migration events n , and the probability for counting k (≤ n) 1D migration with a distance xb follows the
binomial distribution Pb(k, n, p(x)) =nCk p(x) k
1− p(x)
(
)
n−k. It has an average np(x)and variance np(x) 1− p(x)
(
)
≈ np(x) . Bars in Figure 10 show the standard deviationnp( ′x ) for the histogram np( ′x ) with the bin size 2 nm. The bar has longer distance
for smaller np( ′x ) on the semi-logarithmic plot, and is not applicable for np( ′x )
close to 1. Some experimental counts less than 10 had dispersion larger than that expected from the model. As was pointed out also in the previous report [10], the quick back and forth motion of SIA clusters is not explained by the model that assumes an equal probability of initiating 1D migration for all SIA clusters. Instead, there would be SIA clusters tightly bound with traps and those loosely bound, inducing dispersion larger than that of the simple model.
The plot at 300 K in figure 10(a) seems to consist of two regimes separated around 20 nm. This might be related to the experimental result that the 1D migration
distance tended to decrease at late stage of electron irradiation at 300 K (not shown). The decrease was not observed at 250 K. One interpretation is that impurity atoms were segregating into SIA clusters under electron irradiation at 300 K. A gradual increase in the local concentration of traps around SIA clusters would result in a curve instead of a line on the semi-logarithmic plot. In SUS316L and its model alloys, we observed decrease in the 1D migration distance and frequency of SIA clusters after annealing and short-term electron irradiation above 673 K; we proposed that segregation of
solute/impurity atoms into SIA clusters is responsible for the decrease [29]. Table 1 presents σ CT values estimated from the gradient of the
semi-logarithmic plot. From the average image size of SIA clusters that performed 1D migration, we estimated the number of atoms on the cluster plane (S) and that on the line dislocation (L). Applying these values to the cross section
€
σ , we show the trap concentration CT in Figure 11(a). When we assume the cross section to be the line dislocation with width of three atomic distances (
€
σ = 3L), the trap concentration CT around 300 K was close to the total concentration of impurity atoms: about 50 appm. This value is consistent with earlier experimentally obtained results using another HVEM device [10,11]. If the same cross section
€
σ = 3L is applied to lower temperatures, then the trap concentration CT increased by an order of magnitude between 250 K and 150 K.
In a strict sense, however, the cross section
€
σ is thought to increase at lower temperatures: the SIA clusters would be immobilized by a trap at a longer distance because of lower thermal energy kBT , where
€
kB is the Boltzmann’s constant. Taking an interstitial carbon atom for example, we estimated a possible increase in the cross section
€
σ at low temperatures. According to an atomistic simulation, the maximum binding energy is 0.65 eV for a carbon atom at a periphery of a hexagonal 61-SIA cluster [18]. From a detailed map of binding energy (Fig. 5 in Ref. [18]), we read that the annular region along the loop dislocation gives binding energy
€
Eb greater than 0.48 eV has width of about 1b, and that the width for
€
Eb > 0.24 eV is between 1.5b
and 2b. Turning to the strength of trapping, it will be represented by frequency νD of the thermal dissociation of SIA clusters from the trap through 1D migration as
νD=νexp − Eb+ E1D kBT , (2)
which includes lattice vibrational frequency
€
ν and the activation energy for 1D migration E1D (approximately 0.05 eV for SIA clusters of various sizes in iron [7]). Traps with Eb = 0.48 eV at 300 K and Eb=0.24 eV at 164 K give the equal frequency
νD=1.3
€
× 104 s-1
, assuming ν = 1013 s-1
in Equation (2). Consequently, if one regards 0.48 eV as a threshold binding energy for trapping (i.e., σ = L) at 300 K, then the cross section is σ = 1.5 − 2L at 164 K. The example suggests that the large difference in
σ CT between 250 K and 150 K is not explainable solely by the temperature dependence of the cross section
€
σ for the elastic interaction. Instead, the trap concentration CT increased greatly under electron irradiation below 250 K.
Finally, it is noteworthy that the real binding energy is expected to be greater than 0.48 eV at 300 K to account for stationary SIA clusters in the experimental time scale. It might be explained, for example, by another interatomic potential for
iron-carbon system giving maximum binding energy of around 1 eV [30], or by another assumption that the trap is not an isolated impurity but a vacancy–impurity complex for which the binding energy with an SIA cluster is greater than 1 eV [18–20]. However, an experimental report described that a single solute copper atom in iron has an apparent trapping effect around 300 K [12], although the maximum binding energy is as low as 0.12 eV by MS simulation [26,31]. The nature of traps and the trapping mechanism of SIA cluster remain unclear.
5.2 Accumulation of vacancies by irradiation at low temperatures
For low temperatures at which vacancies are not thermally mobile, electron irradiation accumulates vacancies at high concentrations. According to a simple reaction rate analysis of point defects under electron irradiation [32], the vacancy concentration in the steady state is
CV st = P ZIVMV ! " # $ % & 1 2 , (3) where €
P stands for the production rate of point defects (i.e., damage rate) and ZIV represents the number of reaction sites for mutual recombination between SIAs and vacancies. We assumed vacancy mobility MV as the sum of mobilities of thermal migration MVth and athermal migration MVath. The former is
MV th =νexp −EV m kBT " # $ % & ', (4)
where EVm stands for the activation energy for vacancy migration. The latter considers migration induced by collision of incident electrons to atoms surrounding the vacancy [33]. Figures 11(c) and 11(b) show the mobility and steady-state concentration of
vacancies CVst as a function of the irradiation temperature and the damage rate. For the estimation, we assumed ZIV= 84 , ν = 10
13 s-1
, and EVm = 0.57 eV [34] in Equations (3) and (4). In addition, the model for radiation-induced diffusion [35] gives MVath= 9.3 s-1
irrespective of irradiation temperature under irradiation with 1250 kV electrons at the damage rate of 0.01 dpa s-1
.
At 300 K with a damage rate of P = 10−2 s-1
, the steady-state concentration of vacancies CVst was 2 × 10⁻⁴, which was several times the total concentration of impurity atoms: 5 × 10⁻⁵
. With decreasing irradiation temperature, the vacancy concentration CVst increased to 2 × 10⁻³
at 250 K; and was saturated around 4 × 10⁻³
below 220 K. Next we describe the damage rate dependence of the vacancy concentration CVst. For high temperatures at which vacancies are thermally mobile ( MV≈ MV
th), Equation (3) shows that the vacancy concentration CVst is proportional to the square root of the damage rate
P1 2. In contrast, at vacancy-immobile low temperatures ( MV≈ MVath), the
concentration CVst is independent of the damage rate because both mobility MV and production rate
€
P are proportional to the damage rate.
In the following, we describe considerable ambiguities in the above estimation of vacancy concentrations at low temperatures.
1) The conventional reaction rate analysis shows that the mutual recombination and annihilation of point defects at specimen surfaces are dominant reactions that determine the steady-state concentration of point defects under electron irradiation with a high damage rate in thin foil specimens [32]. We must note that the analysis does not take account of migration of point defect clusters. Effect of 1D/3D migration of SIA clusters on the point defect kinetics under HVEM conditions has not been well understood. 2) The vacancy concentration might not reach the steady state in the irradiation for 100 s, depending on the damage rate, the vacancy mobility, and concentration of point defect sinks. We presented the time evolution of vacancy concentration in Figure 11(b), assuming the specimen surfaces as point defect sinks in the conventional rate equations [32].
3) Absolute value of the damage rate has uncertainties. The threshold energy for atomic displacement Ed in iron, determined from electrical resistivity changes due to electron irradiation, has anisotropy for the crystallographic orientation of electron incident direction: 17, 20, and > 30 eV, along <100>, <111>, and <110>, respectively [24]. We have used 20 eV irrespective of the beam incident direction in the course of our studies using HVEM [10–12]. On the other hand, ASTM standard recommends 40 eV as the threshold energy averaged over all orientations based on the results of MD simulations
[25]. If we change the threshold energy from 20 to 40 eV, the production rate of point defects is reduced into 0.26 times. The steady-state concentration of vacancies in Equation (3) is reduced into 0.5 times at high temperatures where vacancies are
thermally mobile. At the low temperatures, however, the decrease in the production rate does not affect the steady-state concentration but increases the time to reach the steady state.
4) Only a simple model is available for the athermal mobility of vacancies [35], where the neighboring atom of a vacancy which receives kinetic energy greater than the activation energy for vacancy migration EVm, always jumps into the vacant lattice site. However, the success of the vacancy jump will depend also on the direction of the momentum given to the atom with respect to the direction toward the vacancy. Furthermore, the model ignores the contribution of replacement collision sequence produced under electron irradiation to athermal mobility. The sequence transfers the momentum for a long distance along the atomic rows of low indices, which is expected to increase the mobility [36].
5) Electron irradiation induces local temperature rise of the specimen due to beam heating effect. Kiritani et al [37] evaluated the temperature rise of iron specimens from growth speed of interstitial-type dislocation loops under irradiation with 2 MV electrons. The temperature rise was 24 and 7 degrees at the center of electron beam having
Gaussian profile of 15 and 6 µm in diameter, respectively, with a peak intensity being fixed at 1.5 × 10²³
e m-2 s-1
; the temperature rise was almost proportional to the total beam current, not to the peak intensity. In the present experiments with 1.25 MV electrons, we obtained the maximum intensity 14 × 1023
e m-2 s-1
at the center of the beam focused to about 1.5 µm in diameter, and lower intensities by the beam defocused to larger diameter (without changing the total beam current). So we expect the local temperature rise less than 10 degrees with no strong damage rate dependence, although we did not examine experimentally the temperature rise in the present experimental conditions. Effect of the temperature rise was not included in the experimental results or discussions.
5.3. Interpretation of 1D migration under electron irradiation
At temperatures of 300 K and 250 K, impurity atoms act as traps for SIA clusters. Vacancies induced by electron irradiation are expected to have a negligible effect on 1D migration. The interpretation is supported by the following experimentally obtained results. 1) The distribution of 1D migration distance corresponded to that of free path of SIA clusters gliding through impurity atoms of random distribution.
Furthermore, the 1D migration distance is greater in iron of higher purity at 300 K [10]. 2) The 1D migration distance did not depend on the temperature or damage rate, which suggests negligible effects of vacancies on 1D migration because the vacancy
concentration in the steady state is higher than the impurity concentration and depends on the temperature and damage rate. A plausible reason for the negligible effect at vacancy-mobile temperature is that the elastic interaction induces the vacancy flow to cluster periphery and annihilation. The vacancies reduced their local concentration around SIA clusters to lose the trap capability. Turning to the frequency of 1D migration, impact with incident electrons is expected to induce detrapping of SIA clusters from impurity atoms to initiate 1D migration. This fact is supported by a 1D migration frequency proportional to the electron beam intensity.
At low temperatures where vacancies are not thermally mobile, the vacancy concentration exceeds 10-3
, except on the exact periphery of SIA clusters where the spontaneous annihilation occurs. The fluctuating interaction energy has large amplitude and short wavelength; it is expected to rule the 1D migration of clusters of several tens of SIAs or larger. That interpretation is consistent with the following experimentally obtained results. 1) The distance of most 1D migration was less than several nanometers, which is comparable to the mutual distance between neighboring valleys in the
fluctuating interaction energy. 2) The distance of 1D migration was virtually
independent of the temperature and damage rate. In the proposed model, distribution of the distance dp between peaks was insensitive to the vacancy concentration above the critical concentration. Moreover, the vacancy concentration in the steady state is
independent of the temperature and irradiation intensity.
Initiation of 1D migration at low temperatures is expected to result from changes of the vacancy distribution that occur under electron irradiation. SIA clusters are
trapped by valleys in the fluctuating interaction energy on their respective 1D migration tracks. But the microscopic distribution changes continuously from one random
distribution to another under electron irradiation because of the migration of vacancies resulting from impact with electrons. Also the stable position of SIA clusters changed on the track, and clusters execute 1D migration into a new stable position. The
mechanism is analogous to that of 1D migration proposed for alloys: 1D migration is induced by mixing of solute atoms in MD simulation [38]. The frequency of 1D migration, which is expected to be proportional to the damage rate, is consistent with experimentally obtained results.
Finally, we compare details of the temperature dependence of 1D migration distance between the experiments and the proposed model. With decreasing temperature
from 300 K, the steady-state concentration of vacancies CVst increased continuously and then saturated below 220 K (see Figure 11(b)). However, the experimental 1D migration distance decreased steeply between 250 K and 150 K. Consequently, the effect of vacancies is expected to exceed that of impurity atoms below 250 K. We note that the 1D migration distance continued to decrease below 220 K, where vacancies are not thermally mobile. In this respect, the model does not correspond directly to the experimentally obtained results. Reasons for the inconsistency are regarded as follows. 1) The vacancy mobility was extended to temperatures lower than 220 K around SIA clusters because the gradient in the interaction energy lowered the effective migration energy of vacancies. For example, MS method for a 61-SIA cluster shows that the migration energy decreased near the cluster periphery [15]. 2) Figure 8(a) presents the wide distribution in the energy difference Ep of local peaks in the total interaction energy. At lower temperatures, shallower valleys can also trap SIA clusters, which reduces the 1D migration distance. 3) SIAs as well as vacancies might retard 1D migration at low temperatures where SIAs are not thermally mobile, because MS
method reported interaction energies larger than 0.3 eV between a 19-SIA cluster and an SIA depending on the mutual distance and orientation [16]. If we treat SIAs similarly to vacancies described in Section 5.2 with parameters EIm = 0.30 eV and MIath = 5.0 s-1
, then SIAs are thermally immobile below around 120 K. Figure 11 presents mobility
MI and the steady-state concentration of SIAs [32] as
CI st = PMV ZIVMI 2 ! " # $ % & 1 2 . (5) 6. Conclusion
1) Using high-voltage electron microscopy, we conducted in-situ observations of 1D migration of SIA clusters in iron under electron irradiation at low temperatures from 300 K to 110 K. The damage rate dependence was examined in 0.01–0.002 dpa s-1
. 2) SIA clusters performed 1D migration under electron irradiation at all temperatures examined. The frequency of 1D migration was independent of the irradiation
temperature and was directly proportional to the damage rate, suggesting that 1D migration was induced by electron irradiation. In contrast, the 1D migration distance depended strongly on the temperature. Distribution of the distance ranged over 100 nm above 250 K, decreased steeply between 250 K and 150 K, and was less than 20 nm below 150 K. The distance did not depend on the damage rate at any temperature.
3) Distribution of the 1D migration distance above 250 K corresponded to that of the free path of SIA clusters gliding through impurity atoms, suggesting that impurity atoms act as traps of SIA clusters. In contrast, the steep decrease in 1D migration distance at low temperatures was not explained by the effect of impurity atoms.
4) We performed molecular statics simulations to examine the fluctuation in the total interaction energy between an SIA cluster and vacancies at concentration CV when the SIA cluster glided through vacancies of random distribution. The total interaction energy was described using superposition of the interaction energy between the cluster and individual vacancy, by analogy of interaction of solute atoms with SIA clusters. The average amplitude of the fluctuation was directly proportional to CV1 2. The amplitude of fluctuation ranged around 1 eV for vacancy concentration CV higher than 10
-3 . The distance between local peaks (from a hill to the next valley) ranged up to 5 nm and showed no dependence on CV.
5) We proposed that 1D migration of SIA clusters at low temperatures was ruled by interaction with vacancies that were thermally not mobile, and accumulated at high concentrations under electron irradiation. The SIA clusters are stationary at the position where the fluctuating interaction energy achieves a local minimum. Irradiation changes the microscopic distribution of vacancies through radiation-induced migration of vacancies, which causes cluster 1D migration into a new stable position.
Acknowledgements
We are grateful to Messrs. K. Ohkubo, T. Tanioka, R. Oota, and Y. Yamanouchi of the High Voltage Electron Microscopy Center at Hokkaido University for technical support in the electron irradiation experiments. A part of this work was performed at the Center for Computational Materials Science, Institute for Materials Research, Tohoku
University (Proposal No. 15S0407). This work was supported in part by the “Advanced Characterization Nanotechnology Platform Program (MEXT)” of the High Voltage Electron Microscope Laboratory at Hokkaido University, "Inter organization Atomic Energy Research Program" of the Japan Atomic Energy Agency, and Japan Society for the Promotion of Science (JSPS) KAKENHI (Grant No. 15K06663).
References
[1] A.J.E. Foreman, W.J. Phythian and C.A. English, Philos. Mag. A 66 (1992) p.671. [2] A.F. Calder and D.J. Bacon, J. Nucl. Mater. 207, 25 (1993) p.25.
[3] B.N. Singh and A.J.E. Foreman, Philos. Mag. A 66 (1992) p.975.
[5] B.D. Wirth, G.R. Odette, D. Maroudas, and G.E. Lucas, J. Nucl. Mater. 276 (2000) p.33.
[6] N. Soneda and T. Diaz de la Rubia, Philos. Mag. 81 (2001) p.331. [7] D.A. Terentyev, L. Malerba and M. Hou, Phys. Rev. B 75 (2007) p.104.
[8] M. Kiritani, Proc. Int. Conf. on High Voltage Electron Microscopy, Antwerp 1980 p.196.
[9] M. Kiritani, J. Nucl. Mater. 251 (1997) p.237.
[10] Y. Satoh, H. Matsui and T. Hamaoka, Phys. Rev. B 77 (2008) p.094135. [11] Y. Satoh and H. Matsui, Philos. Mag. 89 (2009) p.1489.
[12] T. Hamaoka, Y. Satoh and H. Matsui, J. Nucl. Mater. 433 (2013) p.180.
[13] K. Arakawa, K. Ono, M. Isshiki, K. Mimura, M. Uchikoshi, and H. Mori, Science 318 (2007) p.956.
[14] M. Pelfort, Yu.N. Osetsky and A. Serra, Philos. Mag. Lett. 81 (2001) p.803. [15] M.A. Puigvi, N. de Diego, A. Serra, Yu.N. Osetsky, D.J. Bacon, Philos. Mag 87 (2007) p.3501.
[16] N. Anento, A. Serra, J. Nucl. Mater 372 (2008) p.239.
[17] S.L. Dudarev, M.R. Gilbert, K. Arakawa, H. Mori, Z. Yao, M.L. Jenkins, and P.M. Derlet, Phys. Rev. B 81 (2010) p.224107.
[18] D. Terentyev, N. Anento, A. Serra, V. Jansson, H. Khater, and G. Bonny, J. Nucl. Mater. 408 (2011) p. 272.
[19] Y. Abe, T. Suzudo, S. Jitsukawa, T. Tsuru, and T. Tsukada, Fusion Sci. Technol. 62 (2012) p.139.
[20] N. Anento and A. Serra, J. Nucl. Mater. 440 (2013) p.236.
[21] T. Hayashi, K. Fukumoto and H. Matsui, J. Nucl. Mater. 307-311 (2002) p.993. [22] D.A. Terentyev, T.P.C. Klaver, P. Olsson, M.-C. Marinica, F. Williame, C. Domain, and L. Malerba, Phys. Rev. Lett. 100 (2008) p.145503.
[23] O.S. Oen, unclassified report ORNL-4897, USAEC, 1973.
[24] F. Maury, M. Biget, P. Vajda, A. Lucasson, P. Lucasson, Phys. Rev. B14 (1976) p.5303.
[25] K. Nordlund, J. Wallenius, L. Malerba, Nucl. Instr. and Meth. B 246 (2006) p.322. [26] Y. Satoh, H. Abe and T. Matsunaga, Philos. Mag. 93 (2013) p.1652.
[27] G.J. Ackland, M.I. Mendelev, D.J. Srolovitz, S. Han and A.V. Barashev, J. Phys.: Condens. Matter 16 (2004) p.S2629.
[28] The author (Y.S.) apologizes for the following errata in an earlier report [26]. In the upper scale of the plot in Figure 10(b), distances 2 and 4 nm should be shown respectively as 1 and 2 nm. On line 14 of page 1664, 1–4 nm should be shown as 0.5–2
nm. On line 26 of page 1674, 4 nm should be shown as 2 nm. These mistakes do not substantially affect the presented results or discussions.
[29] Y. Satoh, H. Abe Y. Matsukawa, T. Matsunaga, S. Kano, S. Arai, Y. Yamamoto, and N. Tanaka, Philos. Mag. 95 (2015) p.1587.
[30] K. Tapasa, A.V. Barashev, D.J. Bacon, and Yu.N. Osetsky, J. Nucl. Mater. 361 (2007) p.52.
[31] A.C. Arokiam, A.V. Barashev, D.J. Bacon, and Y.N. Osetsky, Philos. Mag. 87 (2007) p.925.
[32] M. Kiritani and H. Takata, J. Nucl. Mater. 69–70 (1978) p.277. [33] K. Urban and A. Seeger, Philos. Mag. 30 (1974) p.1395.
[34] T. Tabata, H. Fujita, H. Ishii, K. Igaki, and M. Isshiki, Scripta Metall. 14 (1981) p.1317.
[35] M. Kiritani, J. Phys. Soc. Jpn. 40 (1976) p.1035
[36] A. Tenenbaum and N.V. Doan, Philos. Mag. 35 (1977) p.379.
[37] M. Kiritani, K. Yoshida and H. Fujita, Proc. fifth int. conf. on high voltage electron microscopy, Kyoto, 1977, p.501.
Appendix A
This section presents an analytical model for fluctuation amplitude of total interaction energy between an SIA cluster and vacancies of random distribution, through a slight modification of the model proposed for solute–SIA cluster interaction [26].
Suppose an SIA cluster of radius rc and a vacancy located in the hexagonal shell of radius rh with the coordinate x (see Section 4.1 and Figure 6 for geometry of the calculation cell). We approximated the interaction energy as a sum of nrh
Gaussian functions frh(x) = prh, iexp −
(
x − "xrh, i)
2 αrh, i 2 # $ % &% ' ( % )% i=1 nrh∑
, (A1)with adoption of appropriate values for the peak energy p and interaction range
€
α(> 0). Suffixes rh and i imply that the parameter was defined for the hexagonal shell with radius
€
rh and the i th component of the sum. We assume that the interaction
energy frh(x) is common for all vacancies in the shell, and that the total interaction energy between the SIA cluster and vacancies is given by a superposition of interaction energy for individual vacancy. Then the variance of the total interaction energy with vacancies of random distribution at a concentration CV is
V[u] ≈ π1 2CV(1− CV) b
∑
rhσrh prh, iprh, jαrh, iαrh, j αrh, i 2 +αrh, j 2(
)
1 2 j=1 nrh∑
i=1 nrh∑
, (A2)where σrh is the number of atomic rows belonging to the shell, e.g., σ0 = 1, σ1= 6, σ2= 12,. We treated component Gaussian functions for a single vacancy as being mutually correlated in a shell, while we ignored the difference in their origins x!. The case for nrh = 1 corresponds to the previous form for solute–SIA cluster interaction [26].
The average amplitude of the fluctuation V[u]1 2
is directly proportional to
CV 1 2
1− CV
(
)
1 2, and is almost proportional to CV1 2 for CV<< 1 . The average amplitude V[u]1 2 is approximately proportional to the peak energy p of interaction, and thesquare root of the interaction cross section and interaction range σ1 2 α1 2.
Appendix B
interaction energy is fitted with Gaussian functions to estimate the fluctuation amplitude of total interaction energy between an SIA cluster and vacancies.
We formed a vacancy at various positions in the calculation cell containing an SIA cluster (see also Section 4.1), and relaxed under a fixed cell size. The interaction energy f between the SIA cluster and vacancy was estimated from the difference in the formation energy of the cell. The examined vacancy positions were on the center axis of the SIA cluster (rh= 0b), and in atomic rows at an edge of each hexagonal shell: broken circles in Figure 6 show the atomic rows examined for a 217-SIA cluster.
Symbols in Figure 12 show typical interaction energy f shown against the x
coordinate of the vacancy. A vacancy on the center axis (rh = 0b) showed attractive interaction denoted by negative energies. The magnitude of the energy had a peak around 0.1 eV for the vacancy located near the cluster plane, and decreased
monotonically with increasing distance from the plane. The peak energy was greater for atomic rows closer to periphery of the cluster: 0.15, 0.2, and 0.3 eV, respectively, for
rh = 5b, 6b and 7b . For the atomic row across the cluster periphery (rh = 8b), interaction energy f decreased by over 1 eV due to the recombination of the vacancy with the SIA cluster, as was reported in [14,15]. In atomic rows just outside the cluster (rh = 9b and 10b), the vacancy showed attractive interaction respectively at around 0.15 eV and 0.05 eV. In rows further outside (rh> 10b), the interaction had both
attractive and repulsive components with different ranges and peak energies (< 0.03 eV). Both components decayed with increasing radial distance rh. These results show that vacancies inside the cluster have large contribution to trapping of SIA clusters.
Then the interaction energies were fitted with Gaussian functions to estimate the fluctuation amplitude of superposed interaction energies according to Appendix A. First we fitted with single Gaussian function as in the previous report [26], but it was not satisfactory. For example, the Gaussian function fitted at short distances for rh = 6b decayed too fast at long distances, as was shown by dotted lines in Figure 12. For shells outside the cluster, the interaction had both attractive and repulsive components with different ranges. Then the interaction energy was fitted with sum of two Gaussian functions (i.e., nrh = 2 in Equation (A1)), as was shown by solid lines. The
parameters were determined by eye fit using spreadsheet on a personal computer. Also component Gaussian functions were shown for rh = 6b and 11b. In each shell, the origins x! of the two components did not always mutually correspond, but the mutual distances were not greater than 2b and 6b , respectively, for hexagonal shells inside and outside the cluster. We note that the decomposition of the interaction energy was not based on the physical meaning of the components.
Figure 13 depicts peak energy p and range α of each Gaussian component as a function of the shell radius rh. The parameters showed common variations among the three cluster radii rc, except that the attractive interaction inside the cluster (rh< rc) had
a higher peak energy for a smaller cluster: e.g., the peak energies p on the center axis (rh = 0b) were 0.1, 0.2, and 0.5 eV, respectively, for rc= 8b , 4b , and 2b . These results are consistent with those of a report of earlier studies [14–16]. The open symbols in Figure 13 are for atomic rows on the corner of hexagonal shells, which are shown with a box in Figure 6. The difference in the peak energy p was less than 0.1 eV between the edge and corner positions in each shell excepting on the cluster periphery and on the adjacent shells. This shows that assumption of common interaction energy for atomic rows in a shell will be good approximation. Parameters p and α were lacking for some shells, which we adopted as interpolating those shown in Figure 13.
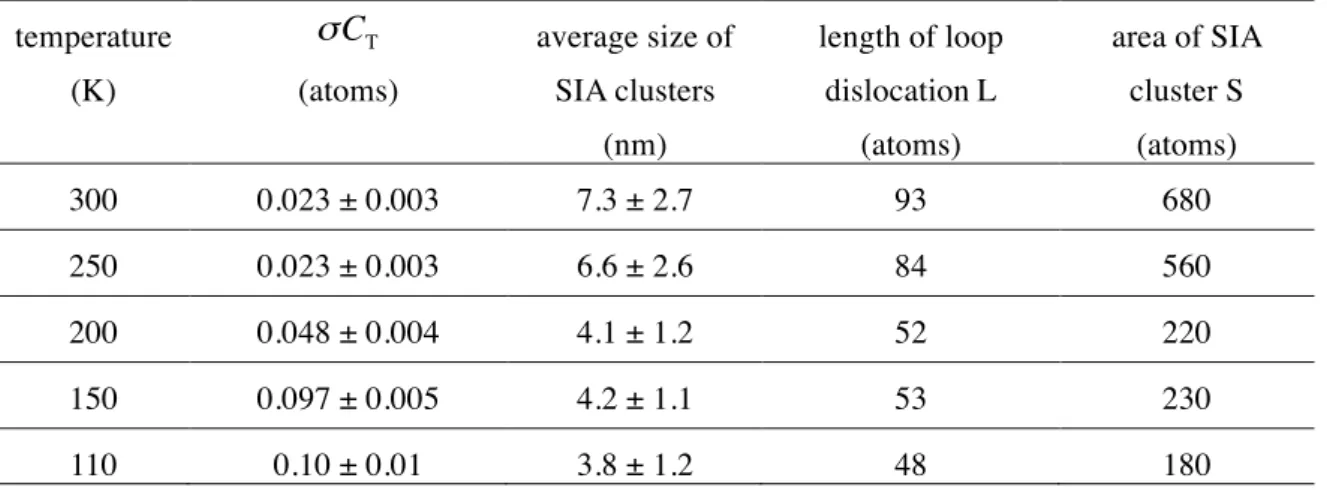
Table 1. Parameters used to estimate concentration CT of traps, and interaction cross-section σ between a SIA cluster and a trap. The standard deviation was shown for SIA cluster size.
temperature (K) σ CT (atoms) average size of SIA clusters (nm) length of loop dislocation L (atoms) area of SIA cluster S (atoms) 300 0.023 ± 0.003 7.3 ± 2.7 93 680 250 0.023 ± 0.003 6.6 ± 2.6 84 560 200 0.048 ± 0.004 4.1 ± 1.2 52 220 150 0.097 ± 0.005 4.2 ± 1.1 53 230 110 0.10 ± 0.01 3.8 ± 1.2 48 180
Figure 1. Time evolution of SIA clusters under electron irradiation at respective
temperatures. Observations were made along the direction near <111>: 1.4 × 1024 e m-2 s-1, 1250 kV.
Figure 2. Irradiation temperature dependence of time evolutions of (a) the number of observed SIA clusters and (b) 1D migration frequency under electron irradiation. Each symbol corresponds to an individual experimental run. 1.4 × 1024
e m-2 s-1
Figure 3. Damage rate dependence of the time evolutions of (a) the number of observed SIA clusters and (b) 1D migration frequency under electron irradiation at 250 K, 200 K, and 110 K, 1250 kV.
Figure 4. 1D migration frequency in the saturation shown against (a) the temperature of electron irradiation and (b) the damage rate, 1250 kV.
Figure 5. The distributions of 1D migration distance of SIA clusters. (a) Irradiation temperature dependence at a constant damage rate, and (b) damage rate dependence. 1250 kV.
Figure 6. SIA clusters in the calculation cell observed along the
€
x direction. Filled and open circles respectively correspond to atomic rows with and without the extra plane of a 217-SIA cluster ( rc= 8b ). Shaded hexagons show 61- and 19-SIA clusters.
Figure 7. Variation of total interaction energy (or self-energy) of a 217-SIA cluster gliding through vacancies of random distribution. Profiles were compared (a) for suppression of vacancy production among different shells, and (b) (c) among vacancy concentrations CV ranging from 10-4
to10-2
, with vacancies suppressed for rh= 7b, 8b and 9b. Results are shown at the common scale in (b), and are magnified for individual conditions in (c). Open and filled symbols in (c), respectively denote the positions of hills and valleys.
Figure 8. Histograms show distributions of (a) the energy difference Ep and (b) the mutual distance dp separating the neighboring local peaks (from a hill to the next valley) in the total interaction energy profile shown in Figure 7(b). Symbols and error bars in (b) show the average, and the upper and lower quartiles of the energy difference
Figure 9. Standard deviation of the total interaction energy V[u]1 2 as a function of vacancy concentration CV and radius rc of SIA cluster. Symbols and lines
respectively present results of MS calculation (distance 2000b), and the analytical model (given by Equation (A2)).
Figure 10. Semi-logarithmic plot of the distribution of 1D migration distance of SIA clusters shown in Figure 5. (a) Irradiation temperature dependence and (b) damage rate dependence, 1250kV. Error bars of fitted lines show the standard deviation of the counts expected by the proposed model.
Figure 11. (a) Temperature dependence of the trap concentration estimated from the experimental 1D migration distance and SIA cluster size. (b) Bold lines show steady-state concentrations of point defects given by Eqs. (3) and (5). Thin lines are point defect concentrations obtained as numerical solutions of conventional rate equations [32] for P = 10−2 s-1
and the permanent sink concentration Cs= 10 −4
. (c) Mobilities of point defects under electron irradiation, 1250 kV.
Figure 12. Interaction energy f between a 217-SIA cluster and a vacancy in the
atomic rows shown by broken circles in Figure 6. Negative energies denote attractive interaction. Symbols show the results of MS calculation. Solid lines show the sum functions in Eq. (A1). The component Gaussian function are shown for rh= 6b and
Figure 13. Peak energy p and range α of component Gaussian functions in Eq. (A1), as a function of the radial position rh of the vacancy and the cluster radius rc. Dotted lines and solid lines respectively show short-range and long-range components. Filled and open symbols respectively denote the atomic rows across the edge and corner of hexagonal shells. Shaded regions correspond to the shells where we suppressed vacancy production in Section 4.

![Figure 9. Standard deviation of the total interaction energy V[u] 1 2 as a function of vacancy concentration C V and radius r c of SIA cluster](https://thumb-ap.123doks.com/thumbv2/123deta/5919207.1051012/34.892.274.641.263.538/figure-standard-deviation-interaction-function-vacancy-concentration-cluster.webp)
