近畿大学学術情報リポジトリ
16
0
0
全文
(2) Kinki University English Journal No.3. Introduction In mainstream psychology, there have been rigorous attempts to discover how individuals view causes for success and failure, and how these different interpretations may affect future performance. Attribution Theory, developed primarily by Weiner (1979, 1985, 1986, 1992), is one of the most well recognized theories in this area. According to attribution theory, human beings are "motivated by a goal of understanding and mastering the environment and themselves" (Pintrich & Schunk, 1996), thus trying to figure out why things happen and why people do what they do. Especially, when we unexpectedly fail or succeed at a certain task, we often find ourselves searching for possible reasons for the unforeseen outcome. For example, when we mishit a ball when playing golf, we may blame the strong wind or light in our eyes, or lack of practice. In school contexts, students may blame their failures on their teachers or classmates behavior. As Figure 1 shows, those perceived causes of a certain behavior are influenced by two factors, an environmental factor and a personal factor. With the golf example above, a player might have learned that s/he was in fact looking up when hitting the ball (specific information), his/her partners did not hit well, either (specific norms), or the wind was actually very strong (situational features). In addition, the player is likely to have a variety of schemas and prior beliefs about their ability to play golf, that particular golf course, or playing golf in general. All of these environmental and personal factors may affect one's perception of the causes, such as ability and luck, of mishitting a ball.. Antecedent Conditions Environmental factors. Specific information Social norms Situational features Personal factors. Causal schemas Attributional bias Prior knowledge. Perceived ...... Causes Attributions for Ability Effort Luck Task difficulty Teacher Mood Health Fatigue, etc.. Causal Psychological ...... Dimensions ...... Consequences. Stability. Expectancy for success. Locus. Self-efficacy. Control. Affect. Figure 1. Overview of the general attributional model Material drawn from Weiner (1986, 1992). 32. Behavioral ...... Consequences. Choice Persistence Level of effort Achievement.
(3) University Students' Explanations for Failure and Success in Learning English as a Foreign Language (Mori). Furthermore, according to Weiner (1986, 1992), those perceived causes can be categorized into three dimensions, locus, stability and control. The locus dimension refers to whether the cause is internal or external to the individual whereas the stability dimension denotes whether the cause is stable or varying over time or according to the situation. On the other hand, the control dimension refers to how much control the individuals have over a cause. As Table 1 shows, ability, for instance, is considered internal, stable and uncontrollable as it is internal to the individual, usually fixed and beyond his/her control. Although effort is also deemed internal, it is regarded as unstable and controllable since the degree of effort the individual puts into it varies depending on a lot of factors, and is a personal responsibility.. Table 1. Dimensional classification scheme for causal attributions Attribution. Locus. Dimension Stability. Controllability. Ability Effort Strategy Interest Task difficulty Luck Family influence Teacher influence. Internal Internal Internal Internal External External External External. Stable Unstable Unstable Unstable Stable Unstable Stable Stable. Uncontrollable Controllable Controllable Controllable Uncontrollable Uncontrollable Uncontrollable Uncontrollable. From Vispoel and Austin (1995), based on Weiner (1979). Weiner (1992) argues that whether students' perceived attributions are internal or external, stable or unstable, and controllable or uncontrollable can result in certain behaviors. He further contends (1979, 1986) that internal attributions (ability and effort) produce greater changes in esteem-related affect than external attributions. In school settings, for example, it is not hard to imagine that students who exhibit internal control and believe that their doing well on a test depended on their own ability (internal) feel pride. On the other hand, controllable attributions are more closely connected with social-related affects such as guilt (we sometimes feel guilt when we fail because of something under our control) and shame (we may feel shame when we fail due to something that is not under our control) whereas stable attributions are more concerned with expectancy for success or failure. Despite the fact that the importance of attributions in school settings has been well documented and recognized, there has not been much research done attempting to uncover students' attributional patterns in the field of SLA. Furthermore, most of the. 33.
(4) Kinki University English Journal No.3. works conducted in this area have been small-scale qualitative studies (e.g., Williams & Burden, 1999; Williams, Burden, Poulet & Maun, 2004; Tse's, 2000; Williams, Burden & AI-Baharna, 2001; Ushioda, 2001; Kalaja, 2004; Heikinnen, 1999; and Isomottonen,. 2003). Because of the qualitative nature of this research, the number of attributions and attributional categories uncovered varies greatly, and there is little consistency in findings among those studies. Such a wide range of attributional categories does not help researchers investigate how these attributions are related to achievement behaviors, since the large number of variables serves only to obfuscate any significant correlations. Therefore, although recognizing the merits of qualitative inquiry in this area, the present study limited the number of attributions by using a quantitative technique, rather than following the general trend in attributional research in FLL. Specifically, this study attempted to investigate the following research questions:. 1. Are the dimensions proposed by attribution theory valid in a foreign language classroom setting? 2. Is there any relationship between attributional patterns and proficiency? 3. Is there any relationship between attributional patterns and teachers?. Methods Participants. The participants in the study were 522 first-year university students in 16 different required English classes taught by 16 different instructors (eight Japanese and eight native speakers of English). At this institute, all first year students take 2 English classes: English 1 with a focus on reading and writing, taught mainly by Japanese instructors; and Communicative English 1 with a focus on speaking and listening, taught by native English speaking instructors. English 1 meets twice a week and Communicative English 1 meets once a week, and the classes were coordinated in a way in which the two instructors could team teach the same students. All participants were non-English majors, and placed in their classes based on their performance on a placement test (TOEIC Bridge). Their proficiency varies greatly with a low score of 76 to a high score of 166 on the TOEIC Bridge and with a low score of 165 and a high score of 905 on the TOEIC.. 34.
(5) University Students' Explanations for Failure and Success in Learning English as a Foreign Language (Mori). Procedure. All first year students in this faculty were required to take the TOEIC at the end of the second semester (in December), which would be 20% of their grades for English 1. After they took the TOEIC and before the results came out, the participants answered the attribution questionnaire in their English 1 class. When answering the questionnaire, the students were instructed to think of their overall English learning experience over the last year. The questionnaire was completed within approximately 15 minutes. Although strict anonymity is recommended for this type of research, it was decided to have the students write their names on the survey in order to compare their attributional responses and their TOEIC scores. All the instructions were given in Japanese by their instructors.. Attribution Questionnaire. The questionnaire was developed mainly based on Attribution Theory and modified so that the content would match the contexts where the study was carried out (see Appendix for the English translation of the questionnaire). It was administered in Japanese and consisted of two parts. In the first part, the students were asked to rate the degree of their English improvement over the year on a five point Likert scale from "Declined" to "Improved," and also asked in which area they think their proficiency has declined or improved the most. In the second part, those who answered that their English proficiency has declined, slightly declined or not changed rated the 11 causes for their unsuccessful outcome on a six point Likert scale. However, those who answered that their English proficiency has slightly improved or improved rated the 11 causes for their successful outcome. Those 11 attributions were written based on previous research and the causal structure matrix (see Table 1).. Results Descriptive Statistics for Perceived Improvement and Attributions. In the questionnaire, the participants were first asked whether they thought their English proficiency had improved after one-year of instruction. For this question, almost 70% of them said their English proficiency had either declined or not changed. As Table 2 shows, the mean of 2.78 on a five point Likert scale also supports that trend.. 35.
(6) Kinki University English Journal No.3 Table 2.. Means and standard deviations of students' perceived improvement, and success and failure attributions. Perceived improvement Failure attributions Ability Effort Strategy Interest Teacher Task Difficulty Class Grade Preparation Likes Level Success attributions Ability Effort Strategy Interest Teacher Task Difficulty Class Grade Preparation Likes Level. N 521. Minimum 1. Maximum 5. Mean 2.78. Std. Deviation 1.12. 369 368 369 367 368 369 369 369 367 369 363. 1 1 1 1 1 1 1 1 1 1 1. 6 6 6 6 6 6 6 6 6 6 6. 3.11 4,66 4.06 3.21 2.18 2.80 2.15 2.97 3,90 2.93 2.46. 1.53 1.22 1.33 1.49 1.20 1.40 1.21 1.45 1.44 1.49 1.26. 154 153 153 152 152 153 153 152 153 152 149. 1 1 1 1 1 1 1 1 1 1 1. 6 6 5 6 6 6 6 6 6 6 6. 2.55 3.35 3.54 3.51 4.42 2.29 3.50 3.39 3.14 3.37 3.89. 1.26 1.23 1.16 1.41 1.16 1.30 1.41 1.33 1.27 1.43 1.33. Those who answered that their English proficiency had not changed or had declined were then asked to identify the reasons why their proficiency had not changed or declined whereas those who answered that their English proficiency had improved were also asked to identify the reasons for the positive outcome. Although in/appropriate use of strategy was chosen as a reason for both absences of improvement and improvement, the participants' responses to failure were just the polar opposite of their responses to success. In other words, they attributed internal attributions such as effort and preparation to failure while they attributed external attributions such as teacher influence, class atmosphere and class level to success (see Mori, 2008 for the detailed analyses).. Research Question One: Dimensions of Perceived Attributions. In order to investigate whether the dimensions proposed in attribution theory could be identified with the present data set, a principal components analysis was performed separately for failure and success. Principal components analysis is a statistical procedure used to determine the interrelationship among the variables and group. 36.
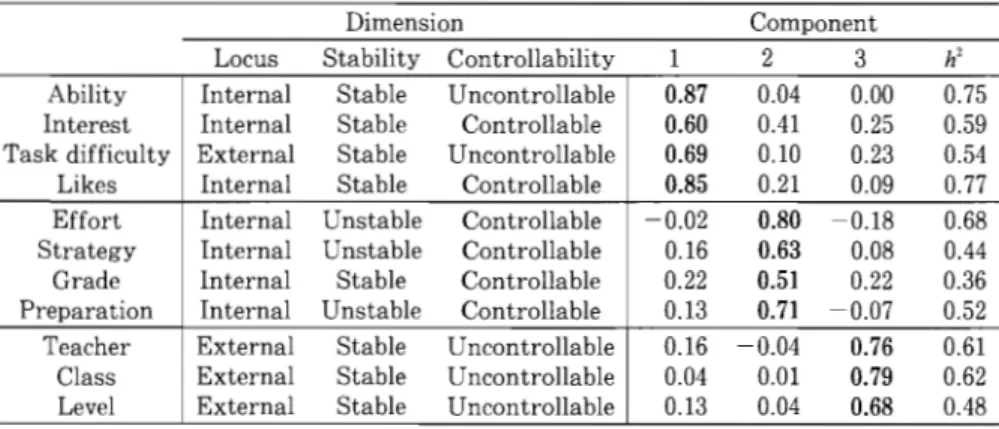
(7) University Students' Explanations for Failure and Success in Learning English as a Foreign Language (Mori). together the variables that are closely related to each other. Consequently, if the dimensions suggested by attribution theory actually exist, those attributions that are categorized as internal/unstable/controllable such as effort, strategy and preparation, for instance, should be lumped together as a result of this statistical analysis. The number of factors to be extracted was based on the following criteria: 1. Minimum eigenvalues of 1.0.. 2. Each factor contains individual items with a minimum loading of .45. 3. Eigenvalues appear before the decrease of eigenvalues level off on the scree plot. For both the failure and success analyses, after varimax rotation, a three-factor solution was chosen, which accounted for 57.7%, and 56.8% of the total variance respectively (see Tables 3 and 5). As Tables 4 and 6 show, a simple structure was achieved. The presence of a simple structure and small residual correlations indicates that the number of factors extracted was appropriate. The communalities shown to the right in these tables are the proportion of variance of each item due to the common factors. The fact that the communalities were largely homogenous with only three weak communalities «.45 for Strategy/Failure) also suggests that the present model is correct.. Table 3.. Principal components analysis summary for failure: Eigenvalues and percent of variance explained. Initial Eigenvalues Component 1 2 3 Table 4.. Ability Interest Task difficulty Likes Effort Strategy Grade Preparation Teacher Class Level. Locus Internal Internal External Internal Internal Internal Internal Internal External External External. Total 3.33 1.83 1.19. % of Variance Cumulative % 30.31 46.90 57.69. 30.31 16.59 10.79. Principal components results for failure (n=367). Dimension Stability Controllability Stable Uncontrollable Stable Controllable Stable Uncontrollable Stable Controllable Unstable Controllable Unstable Controllable Stable Controllable Unstable Controllable Stable Uncontrollable Stable Uncontrollable Stable Uncontrollable. 37. 0.87 0.60 0.69 0.85 -0.02 0.16 0.22 0.13 0.16 0.04 0.13. Component 2 3 0.04 0.00 0.41 0.25 0.10 0.23 0.21 0.09 0.80 -0.18 0.63 0.08 0.51 0.22 0.71 -0.07 -0.04 0.76 0.01 0.79 0.04 0.68. h'. 0.75 0.59 0.54 0.77 0.68 0.44 0.36 0.52 0.61 0.62 0.48.
(8) Kinki University English Journal No.3 Table 5.. Principal components analysis summary for success: Eigenvalues and percent of variance explained. Initial Eigenvalues Component 1 2 3. Total 3.25 1.68 1.32. % of Variance Cumulative % 29.51 15.27 11.97. 29.51 44.78 56.75. Table 6. Principal components results for success (n= 149). Effort Strategy Grade Preparation Ability Interest Likes Teacher Task difficulty Class Level. Locus Internal Internal Internal Internal Internal Internal Internal External External External External. Dimension Stability Controllability Unstable Controllable Unstable Controllable Stable Controllable Unstable Controllable Stable Uncontrollable Stable Controllable Stable Controllable Stable Uncontrollable Stable Uncontrollable Stable Uncontrollable Stable Uncontrollable. Component. 2 0.75 0.66 0.55 0.77 0.06 0.20 0.19 0.15 0.13 -0.04 0.27. 0.18 ~0.02. 0.31 0.11 0.85 0.57 0.78 0.19 0.44 0.21 0.00. 3 0.03 0.23 0.19 -0.09 0.00 0.40 0.10 0.74 -0.58 0.72 0.55. 0.73 0.61 0.50 0.54 0.61 0.55 0.58 0.44 0.63 0.67 0.38. As displayed in Tables 4 and 6, principal components analyses for failure and success show almost identical results. To be more specific, ability, interest in studying English and enjoyment of studying English loaded together on factor one for failure and factor two for success. Effort, study strategy, interest in getting a good grade, and preparation for class loaded together on factor two for failure and factor one for success. Moreover, teacher influence, class atmosphere and class level loaded on factor three for both failure and success. The only difference is that task difficulty loaded with ability, interest in studying English and enjoyment of studying English for failure while it loaded with teacher influence, class atmosphere and class level for success. Close examination of the variables for each factor reveals that variables loading on factor one for failure and factor two for success are ability/interest-related internal, stable and un/controllable attributions, variables loading on factor two for failure and factor one for success are effort-related internal/unstable/controllable attributions, and variables loading on factor three for failure and success are classrelated external/stable/uncontrollable attributions. Thus, these factors were labeled accordingly for the further analyses. This finding is almost totally in congruence with our previous study (Gobel & Mori, 2007).. 38.
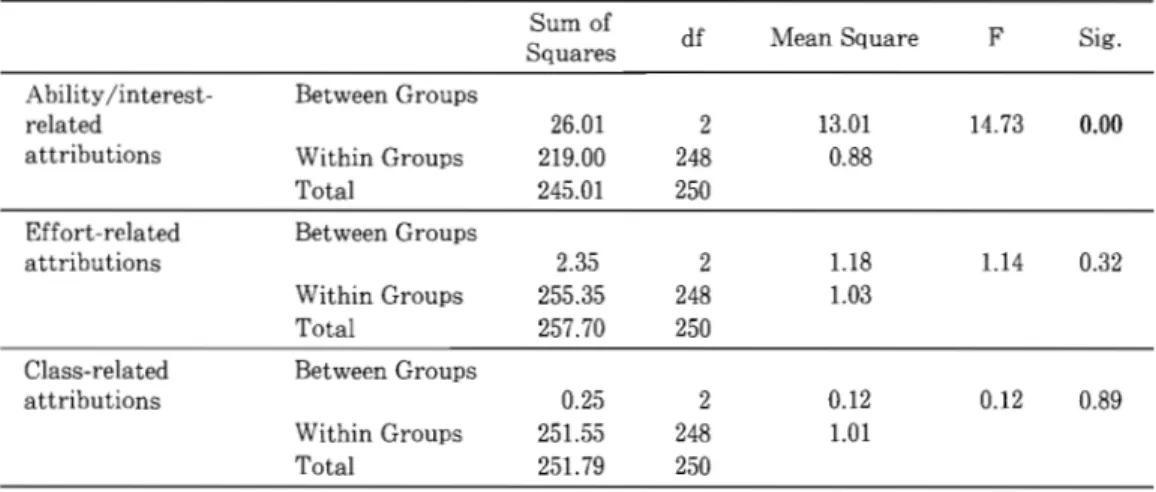
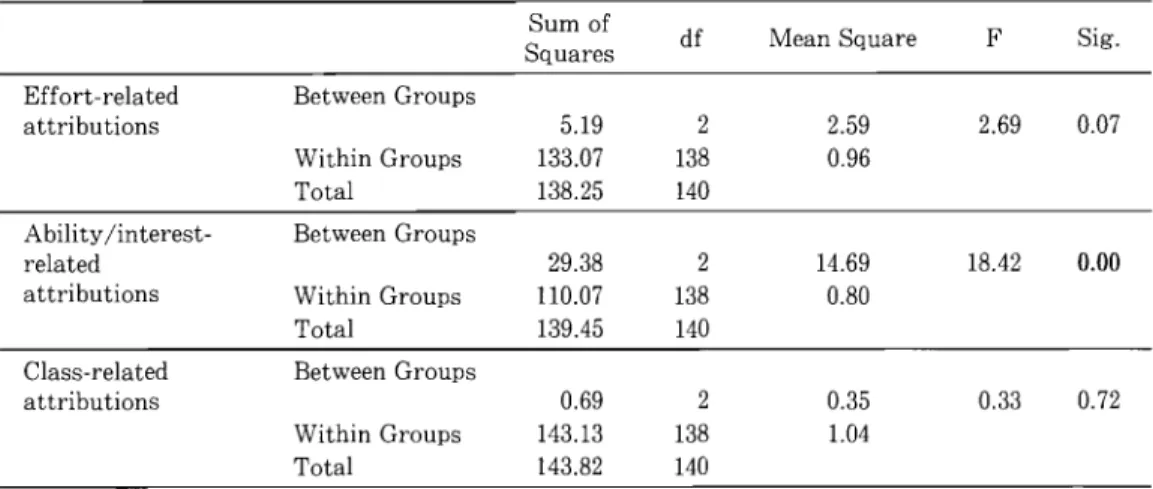
(9) University Students' Explanations for Failure and Success in Learning English as a Foreign Language (Mori). Research Question Two: Attribution and Proficiency. To examine whether factor scores for all the attribution factors differ significantly according to proficiency, ANOVA was performed on three failure attribution factors measured as factor scores as dependent variables: ability/interest-related attributions, effort-related attributions, and class-related attribution. The independent variable was proficiency levels. The participants were divided based on their TOEIC scores (Low = 165-310, Mid = 340-395, High = 435-905). Please note that the scores that fell outside of these ranges were removed so that the differences among the groups could be more distinct. The results of ANOV A suggest that of the three failure attribution factors, ability /interest-related (internal/stable/uncontrollable) attributions were significantly affected by proficiency, F (2,248) =26.01, p. < .00 (Table 7). What this means is. that the lower the proficiency is, the stronger tendency to blame lack of ability, lack of interest, difficulty of the task, and dislikes for absence of improvement. The results of ANOV A also indicate that ability /interest-related (internal/stable/uncontrollable) success attributions were significantly affected by proficiency as well, F (2, 138) = 29.38, p. < .00 (Table 8). This finding implies that students with higher. proficiency have greater propensity for attributing ability, interest, and enjoyment of studying English to proficiency improvement.. Table 7.. Analysis of variance offailure attributions with proficiency as the independent variable. Ability /interestrelated attributions Effort-related attributions. df. Mean Square. F. Sig.. 26.01 219.00 245.01. 2 248 250. 13.01 0.88. 14.73. 0.00. 2.35 255.35 257.70. 2 248 250. 1.18 1.03. 1.14. 0.32. 0.25 251.55 251. 79. 2 248 250. 0.12 1.01. 0.12. 0.89. Between Groups Within Groups Total Between Groups Within Groups Total. Class-related attributions. Sum of Squares. Between Groups Within Groups Total. 39.
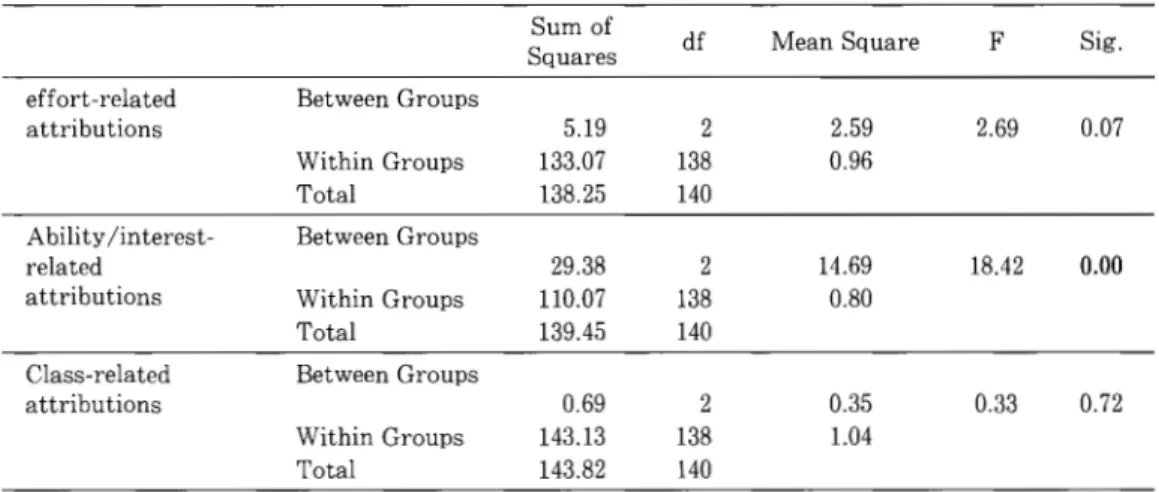
(10) Kinki University English Journal No.3 Table 8. Analysis of variance of success attributions with proficiency as the independent variable. Effort-related attributions. Sum of Squares. df. Mean Square. F. Sig.. 5.19 133.07 138.25. 2 138 140. 2.59 0.96. 2.69. 0.07. 29.38 110.07 139.45. 2 138 140. 14.69 0.80. 18.42. 0.00. 0.69 143.13 143.82. 2 138 140. 0.35 1.04. 0.33. 0.72. Between Groups Within Groups Total. Ability /interestrelated attributions. Between Groups. Class-rei a ted attributions. Between Groups. Within Groups Total. Within Groups Total. Research Question Three: Attribution and Teacher Factor. In order to investigate whether factor scores for all the attribution categories. differ significantly depending on the teacher, ANOV A was again performed on three failure attribution categories as dependent variables and teacher as independent variable. The results of ANOV A imply that ability/interest-related failure attributions were significantly affected by teacher factor, F (2, 332) =35.70, p. < .00 (Table 9). The. results of ANOV A also indicate that ability/interest-related success attributions were significantly influenced by teacher, F (2,138) = 29.38, p. < .00 (Table 10). These findings. suggest that students' ability /interest-related attributions vary depending on the teacher. Table 9. Analysis of variance offailure attributions with teacher as the independent variable. Ability /interestrelated attributions Effort-related attributions. df. Mean Square. F. Sig.. 35.70 306.75 342.45. 2 332 334. 17.85 0.92. 19.32. 0.00. 4.09 322.56 326.65. 2 332 334. 2.04 0.97. 2.10. 0.12. 1.17 324.07 325.24. 2 332 334. 0.59 0.98. 0.60. 0.55. Between Groups Within Groups Total Between Groups Within Groups Total. Class-related attributions. Sum of Squares. Between Groups Within Groups Total. 40.
(11) University Students' Explanations for Failure and Success in Learning English as a Foreign Language (Mori) Table 10. Analysis of variance of success attributions with teacher as the independent variable. effort-related attributions. Class-related attributions. df. Mean Square. F. Sig.. 5.19 133.07 138.25. 2 138 140. 2.59 0.96. 2.69. 0.07. 29.38 110.07 139.45. 2 138 140. 14.69 0.80. 18.42. 0.00. 0.69 143.13 143.82. 2 138 140. 0.35 1.04. 0.33. 0.72. Between Groups Within Groups Total. Ability /interestrelated attributions. Sum of Squares. Between Groups Within Groups Total Between Groups Within Groups Total. Discussion and Conclusion Dimensionality of Attributional Response. The results of factor analyses generally confirmed the bipolar dimensions of locus (internal-external), stability (stable-unstable) and control (controllableuncontrollable) for both success and failure, as hypothesized by Weiner (1986). Moreover, all of the internal/unstable/controllable attributions, namely effort, study strategy and preparation for class, emerged as one factor while all but one external/ stable/uncontrollable attributions emerged as one factor for both failure and success. The only unexpected result is that interest in studying English and enjoyment of studying English that are categorized as controllable loaded together with ability deemed as uncontrollable. It is interesting to note that the same result was found in our previous study (Gobel & Mori, 2007). A possible explanation is that their interest in and perceived enjoyment of studying English are so closely related to their perceived ability that they may consciously or unconsciously regard their interest or lack of interest as beyond their control. If that is the case, ability /interest-related attributions may be distinguishable from effort-related attributions in a sense that the former is stable and uncontrollable while the latter is unstable and controllable.. Failure and Success Attributions and their Relationship with Proficiency and Teacher. Glancing at the means of attributional ratings, one might notice that the participants tend to attribute internal/unstable/controllable factors such as effort, study strategy, and preparation to absence of improvement in their English ability whereas they tend to attribute external/stable/uncontrollable factors, especially teacher, to. 41.
(12) Kinki University English Journal No.3. improvement. These findings contradict widely recognized psychological phenomena referred to as a self-protective or self-enhancement bias. The self-protective bias refers to a tendency that individuals blame others when they fail while the self-enhancement bias is a tendency that they attribute internal factors such as effort and ability when they succeed. However, most of the studies supporting the existence of these biases were conducted in Western contexts, and the results of previous studies done in Asian countries mostly Japan (Heine & Lehman, 1995; Kitayama & Markus, 1995) all showed absence of self-protective and self-enhancement biases among Asians. Markus and Kitayama (1991) claim that this discrepancy is due to differences between two broadly different cultures: many Western cultures such as North America promoting independence and autonomy, and many non-Western cultures such as Japan emphasizing interdependence and connectedness among individuals. Although such a self-critical tendency is identified with students at all proficiency levels (Mori, 2008), the results of statistical analyses showed that lower proficiency groups have a stronger tendency to attribute ability /interest-related internal factors to absence of improvement than high proficiency group does. In contrast, when it comes to success, high proficiency group have a greater propensity to attribute ability /interest-related internal factor to improvement. What this means is while lower proficiency groups seem to feel that their English proficiency has not improved because they are not good at English, and they have little interest in studying English, the reverse is the case with high proficiency groups. If stable attributions are more closely linked to expectancy for success or failure, and controllable attributions are more strongly related with persistence than uncontrollable attributions, as Weiner (1992) claims, especially lower proficiency group's tendency to attribute lack of ability, which is considered stable and uncontrollable, is problematic. However, the findings of this study also suggest that students' tendency to blame lack of ability and interest may diminish depending on the teacher. If this is true, we should constantly remind ourselves to introduce materials that are manageable and interesting so that students, especially less proficient students, have a change to boost their confidence.. References Gobel, P., & Mori, S. (2007). Success and failure in the EFL classroom: Exploring students' attributional beliefs in language learning. In L. Roberts, A. Gurel., S. Tatar., & L. Marti (Eds.), EUROSLA Yearbook Vol. 7 (pp. 149-170). Amsterdam: John 42.
(13) University Students' Explanations for Failure and Success in Learning English as a Foreign Language (Mori). Benjamins Publishing Company. Heikkinen, A. (1999). A discourse analysis of success and failure accounts in learning English as a foreign language. Unpublished MA thesis, University of Jyvaskyla, Jyvaskyla, Finland. Available at http://selene.lib.jyu.fi:8080/gradu/g/1570.pdf. Heine, S. J., & Lehman, D. R. (1995). Cultural variation in unrealistic optimism: Does the West feel more invulnerable than the East? Journal of Personality and Social Psychology 68, 595-607.. Isomottonen, A. (2003). A discursive study of hard-of-hearing learners' explanations for failure and success in learning English as a foreign language. Unpublished MA thesis, University of Jyvaskyla, Jyvaskyla, Finland. Available at http://selene.lib.jyu.fi:8080/gradu/g/0000417.pdf. Kalaja, P. (2004). So maybe Freddie (Mercury) and his band mates really are to blame: Explaining success (or failure) in learning EF1. In K. Makinen., P. Kaikkonen., & V. Kohonen (Eds.), Future perspectives inforeign language education (pp. 123-32). Oulu: Oulu University Press. Kitayama, S., & Markus, H. R. (1995). Construal of self as cultural frame: Implications for internationalizing psychology. In N. R. Goldberger., & J. B. Veroff (Eds.), The culture and psychology reader (pp. 366-383). New York: New York University Press. Markus, H. D., & Kitayama, S. (1991). Culture and self: Implications for cognition, emotion, and motivation. Psychological Review 98, 224-253. Mori, S. (2008 forthcoming). Who is to blame?: University students' perception of lack of improvement in their English ability. The JACET Journal, 47. Pintrich, 1., & Schunk, H. (1996). Motivation in education: Theory, research, and applications. Englewood Cliffs, NJ: Prentice Hall. Tse, 1. (2000). Student perceptions of foreign language study: A qualitative analysis of foreign language autobiographies. The Modern Language Journal 84(1), 69-84. Ushioda, E. (2001). Language learning at university: Exploring the role of motivational thinking. In Z. Dornyei., & R. Schmidt (Eds.), Motivation and second language acquisition (pp. 171-184). Honolulu: University of Hawai'i. Second Language Teaching. and Curriculum Center. Weiner, B. (1979). A theory of motivation for some classroom experiences. Journal of Educational Psychology 71, 3-25.. Weiner, B. (1985). Human motivation. New York: Springer-Verlag.. 43.
(14) Kinki University English Journal No.3. Weiner, B. (1986). An attributional theory o/motivation and emotion. New York: SpringerVerlag. Weiner, B. (1992). Human motivation: Metaphors, theories and research. Newbury Park, CA: Sage. Williams, M., & Burden, R. (1999). Students' developing conceptions of themselves as language learners. Modern Language Journal 83, 193-20l. Williams, M., Burden, R., & AI-Baharna, S. (2001). Making sense of success and failure: The role of the individual in motivation theory. In Z. Dbrnyei., & R. Schmidt (Eds.), Motivation and second language acquisition (pp. 171-184). Honolulu: University of Hawaii. Second Language Teaching and Curriculum Center. Williams, M., Burden, R., Poulet, G., & Maun, 1. (2004). Learners' perceptions of their successes and failures in foreign language learning. Language Learning Journal 30, 1929. Appendix A Translation. 0/ the Attribution Questionnaire. [lJ Do you think your English ability has improved over the past year? A declined. B slightly declined. D slightly improved. E improved. C not changed. [2J In what area do you think your ability has declined the most? Choose only one. A vocabulary. B grammar. C Listening. E Speaking. F Writing. G None of the above. DReading. [3J In what area do you think your ability has improved the most? Choose only one. A vocabulary. B grammar. C Listening. E Speaking. F Writing. G None of the above. DReading. If you answered your English ability has declined or not changed (choosing A, B,. or C for Question [1] above), please answer the following questions [4] to [14]. If you answered your English ability has improved (choosing D or E for Question [1] above), go on to the reverse side:. Why do you think your English ability has declined or not changed? Look at the 44.
(15) University Students' Explanations for Failure and Success in Learning English as a Foreign Language (Mori). following list of reasons, read each statement and mark the letter to indicate the extent to which you agree or disagree with each statement. A Strongly disagree. B Disagree. C Somewhat disagree. D Somewhat agree. E Agree. F Strongly agree. [4] My English ability has declined/not changed because I have weak skills in English. [5] My English ability has declined/not changed because I didn't try very hard. [6] My English ability has declined/not changed because I used wrong study or practice methods. [7] My English ability has declined/not changed because I had no interest in studying English. [8] My English ability has declined/not changed because the teacher's instruction was inappropriate. [9] My English ability has declined/not changed because English is difficult. [10] My English ability has declined/not changed because didn't like the atmosphere of the class. [11] My English ability has declined/not changed because I had no interest in getting a good grade. [12] My English ability has declined/not changed because I was ill-prepared for class. [13] My English ability has declined/not changed because I don't like English. [14] My English ability has declined/not changed because the level of the class was inappropriate.. If you answered your English ability has improved (choosing D or E for Question [1] above), please answer the following questions [15] to [25]:. Why do you think your English ability has improved? Look at the following list of reasons, read each statement and mark the letter to indicate the extent to which you agree or disagree with each statement. A Strongly disagree. B Disagree. C Somewhat disagree. D Somewhat agree. E Agree. F Strongly agree. [15] My English ability has improved because I have strong skills in English. [16] My English ability has improved because I tried very hard.. 45.
(16) Kinki University English Journal No.3. [17J My English ability has improved because I used the right study or practice methods. [18J My English ability has improved because I had interest in studying English. [19J My English ability has improved because the teacher's instruction was appropriate. [20J My English ability has improved because English is easy. [21J My English ability has improved because I liked the atmosphere of the class. [22J My English ability has improved because I had interest in getting a good grade. [23J My English ability has improved because I was well-prepared for class. [24J My English ability has improved because I like English. [25J My English ability has improved because the level of the class was appropriate.. 46.
(17)
図


+5

関連したドキュメント
東京大学 大学院情報理工学系研究科 数理情報学専攻. [email protected]
情報理工学研究科 情報・通信工学専攻. 2012/7/12
By incorporating the chemotherapy into a previous model describing the interaction of the im- mune system with the human immunodeficiency virus HIV, this paper proposes a novel
理工学部・情報理工学部・生命科学部・薬学部 AO 英語基準入学試験【4 月入学】 国際関係学部・グローバル教養学部・情報理工学部 AO
• The Business Succession Guidelines (formulated by the Study Group for Revitalization of Business Focusing on Business Succession in March 2015) will be revised during FY2019 to
関谷 直也 東京大学大学院情報学環総合防災情報研究センター准教授 小宮山 庄一 危機管理室⻑. 岩田 直子
[r]
