Search for top squarks in events with one lepton
in pp collisions at
! = 13 TeV
13 TeV
Search for top squarks in events with one lepton
in pp collisions at
p
s = 13 TeV
Tatsuya Mori
Department of Physics, Faculty of Science & Graduate School of Science, The University of Tokyo
Abstract
This thesis presents the results of a search for the top squark (stop), the supersymmetric partner of the top quark, in events with one lepton. The search uses the datasets of the 2015 and
2016 LHC pp collisions atps = 13 TeV recorded by the ATLAS detector, which amount to an
integrated luminosity of 28.0 fb 1. The analysis targets a direct pair production of stops where
each stop decays into the top quark and the lightest neutralino (˜t1! t ˜01), the W boson from one
of the two top quarks decays to an electron or muon (either directly or via a ⌧ lepton), and the W boson from the other top quark decays hadronically. Since the signal event topology highly depends on the mass di↵erence between the stop and the lightest neutralino, three analyses are performed which are optimized to Boosted, Resolved, and Diagonal topologies of the signal
events. In Boosted topology ( m(˜t1, ˜01)& 3mt), top quarks are highly boosted so that bqq0 from
hadronic top decay forms one large-R jet. In Resolved topology ( m(˜t1, ˜01)⇠ 2mt), the hadronic
top decay products are not merged into one large-R jet but resolved into three smaller-radius
jets because pT of top quark is relatively medium. In Diagonal topology ( m(˜t1, ˜01) ⇠ mt),
the behavior of hadronic top decay is the same as Resolved region but ˜01 and t from ˜t1 decay
are nearly collinear with respect to ˜t1 momentum. The detector signature of the signal events
is similar to that of a top quark pair produced in association with large missing transverse momentum, which is highly suppressed by dedicated variables in Boosted and Resolved analyses and precisely estimated by a 2-dimensional shape fit in Diagonal analysis.
No significant excess from the Standard Model background-only hypothesis is observed, and exclusion limits on a plane of stop and lightest neutralino masses are set at 95% confidence level. The results extend the ATLAS and the CMS exclusion limits for stop pair production
model obtained with data of 13.2 fb 1. The Resolved result doesn’t newly exclude but enlarges
the expected CLscontour up to (m˜t1, m˜01)⇠ (700 800, 400) GeV. The Boosted result newly
excludes the ˜t1! t ˜01model with the m˜t1. 980 GeV for m˜01 . 300 GeV and (m˜t1, m˜01) = (900,
350) GeV. The Diagonal result is reinterpreted to set exclusion limits on the model where stop
decays to bottom quark, W -boson, and lightest neutralino (˜t1 ! bW ˜01), and newly excludes
the ˜t1 ! t ˜01 and ˜t1! bW ˜01 models with 200 GeV < m˜0
1 < 240 GeV and (m˜t1, m˜01)⇠ (430,
Contents
1 Introduction 4
1.1 The Standard Model 4
1.2 Hierarchy Problem 5 1.3 Supersymmetry 6 1.4 Top Squark 9 1.5 Neutralino 10 1.6 Stop Search 11 1.6.1 Boosted 13 1.6.2 Resolved 14 1.6.3 Diagonal 14 2 ATLAS Experiment 16
2.1 Large Hadron Collider 16
2.2 ATLAS Detector 18
2.2.1 Inner Detector 20
2.2.2 Electromagnetic Calorimeter and Hadronic Calorimeter 22
2.2.3 Muon Spectrometer 28
2.3 Trigger and Data Acquisition 30
3 Data and Monte Carlo Samples 31
3.1 Data and Trigger 31
3.2 Monte Carlo Samples 33
3.2.1 Signal 33 3.2.2 t¯t 34 3.2.3 Single Top 34 3.2.4 W/Z+jets 35 3.2.5 t¯t + W/Z 35 3.2.6 t¯t + 35 3.2.7 Diboson 36
4 Physics Object Definition 37
4.1 Primary Vertex 38
4.2 Electron 38
4.3 Muon 38
4.4 Photon 39
4.5 Jet 39
4.7 Overlap Removal 40
4.8 Large-Radius Jet 41
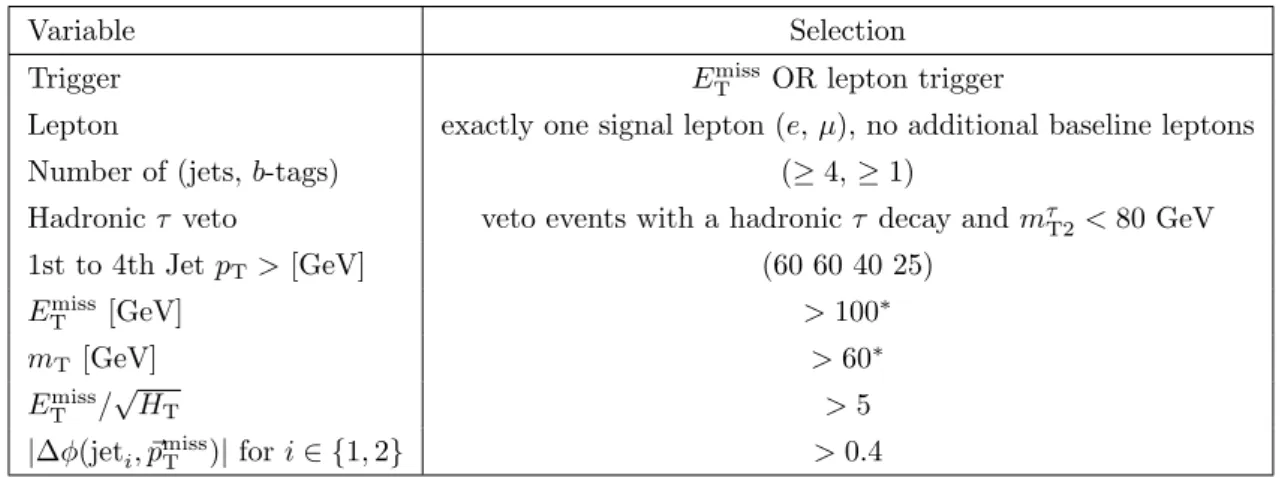
5 Event Selection 42
5.1 Event Preselection 42
5.1.1 Stransverse Mass 42
5.2 Resolved Signal Region 46
5.3 Boosted Signal Region 51
5.4 Diagonal Base Event Selection 55
6 Background Estimation 57
6.1 Resolved and Boosted Control Regions 58
6.2 Resolved and Boosted Control Regions For t¯t + Z 73
6.3 Resolved and Boosted Validation Regions 76
6.4 2-D Shape Fit for Diagonal 85
7 Hypothesis Test Procedures 89
7.1 Hypothesis Test for New Particle Search 89
7.2 Binned Maximum Likelihood Fit 90
7.3 Model Parameterization 91
7.4 Profile Likelihood Ratio as Test Statistic 95
8 Systematic Uncertainties 96 8.1 Experimental Sources 97 8.2 t¯t 101 8.3 Single Top 101 8.4 W +jets 102 8.5 Diboson 102 8.6 t¯t + V 102 8.7 Signal 103 9 Results 104
9.1 Results for Resolved and Boosted 104
9.2 Results from Diagonal 113
9.3 Combined Results 129
9.4 Future Prospects 132
10 Conclusion 134
Appendix
137
A Validation Fit for Diagonal 137
B Asymptotic Formulae for Hypothesis Test 153
D Upgrading Trigger Readout of LAr Calorimeter 166
D.1 Supercell 166
D.2 New High-End Electronics for Supercell Toward Phase-I Upgrade 167
D.3 Demonstrator System 169
Chapter 1
Introduction
The final goal of elementary particle physics is to discovery an ultimate law of nature that is the origin of all physics phenomena in the universe. As one of the steps, elementary particle physi-cists have constructed the Standard Model (SM), successfully describing physics of elementary particles in a high energy scale called electroweak scale (around W /Z-boson mass, 100 GeV). However, the SM is not perfect and has many problems. One of the most important problems is ‘hierarchy problem’, which points out why the electroweak scale is much di↵erent from the grand
unification theory (GUT) scale (1016 GeV) or Planck scale (1019GeV). The di↵erence results in
an extremely large quantum correction to the Higgs mass. The other problem is that there is no appropriate candidate for dark matter in the SM. Furthermore, the grand unification cannot be derived from the SM.
These problems can be solved by introducing ‘supersymmetry’, one of the most compelling extension of the SM. If supersymmetry is true, there should be superpartner of top quark named top squarks (or stops). Since the stop mass is the most important key to solve the hierarchy prob-lem, searching for stop could be a powerful test of supersymmetry. Furthermore, if the hierarchy
problem is solved by supersymmetry, then stop mass is predicted⇠ 1 TeV at maximum, which
is small enough to be searched for in the LHC-ATLAS experiment. This thesis presents a search
for top squarks (stops) using pp-collisions data of 28.0 fb 1in the LHC-ATLAS experiment.
In this Chapter1, the SM and supersymmetry are briefly overviewed to support the following
sections where motivations of stop search and outline of the analysis are introduced.
1.1
The Standard Model
The Standard Model (SM) [1] is essentially based on three types of elementary particles (leptons,
quarks, and gauge-bosons). Figure1.1and1.2show all the particles and possible interactions in
the SM. Interaction of fermions (leptons or quarks) via photon, W /Z-boson and gluon are called electromagnetic, weak and strong interaction, respectively.
The electrically neutral part of the SM Higgs field is a complex scalar with a classical
potential: V = 1 2µ 2 | |2+1 4 | | 4. (1.1)
Figure1.3illustrates the global Higgs potential before/after electroweek spontaneous symmetry
Figure 1.1: All particles described in the Standard Model [1]. In each block for each particle, its mass, spin, and electro-charge are shown.
Higgs field or vacuum expectation value (VEV, v) is considered zero (left of Figure 1.3), and
below the high energy threshold, the EWSB happens and then v!q µ2
, experimentally known
as approximately 246 GeV (right of Figure1.3)1. After the EWSB, the transformation from the
global to the local Higgs field (H) is denoted by = v+Hp
2 , and then a mass term of the local
Higgs field can be expressed with , v or µ:
m2
H
2 H
2= v2H2= µ2H2 (1.2)
1.2
Hierarchy Problem
In the SM, each fermion that couples to the Higgs field has a Yukawa coupling f. The interaction
term between fermion and Higgs is denoted by:
LYukawa= ff Hf¯
where f is the Dirac Field. The mass of a fermion after the EWSB is deduced to:
mf =
v p
2 f (1.3)
Equation1.3means that the Higgs boson is most likely to couple to the heaviest fermion, namely
top quark, with t⇠ 1. Then if one considers the loop-correction to the Higgs mass shown in
Figure 1.4(a) and the following Equation 1.4, the most significant correction comes from top
quark: m2 H = | f|2 8⇡2 ⇤ 2 UV+ .... (1.4)
where ⇤UV is an ultraviolet momentum cuto↵ used to regulate the loop integral, which should
be interpreted as at least the threshold of energy scale above which the SM is not valid and new physics appears.
1The mass of W -boson, M
W, after the EWSB can be expressed by2 sin ✓vew, where e
2 4⇡ ⇠ 1 137and cos ✓w= MW MZ.
Figure 1.2: Possible interactions between particles in the SM [1].
The problem is that if ⇤UV is at the order of the grand unification energy scale 1016 GeV,
where electromagnetic, weak, and strong forces are unified into one force, this quantum correction
to m2
H is some 24 orders of magnitude larger than the value of m2H = (125 GeV)2. This is
called ‘hierarchy problem’ [2–6]. The hierarchy problem is just for the Higgs boson mass. Indeed
the quantum corrections to fermion and gauge boson masses do not have the quadratic term of
⇤UV because of symmetries.
In addition, since the Higgs mass is a parameter determined only through measurement at least in the SM, the problem can be also interpreted as a criterion that a future theory of particle physics, where the Higgs mass will be calculable, must be constructed without any excessive fine-tunings of the Higgs mass.
1.3
Supersymmetry
SM Particle Type Particle Symbol Spin R-Parity Superpartner Symbol Spin R-parity
Fermions Quark q 1 2 +1 Squark q˜ 0 -1 Lepton ` 1 2 +1 Slepton `˜ 0 -1 Bosons W W 1 +1 Wino W˜ 1 2 -1 B B 1 +1 Bino B˜ 1 2 -1 Gluon g 1 +1 Gluino ˜g 1 2 -1
Higgs bosons Higgs Hu, Hd 0 +1 Higgsino H˜u, ˜Hd 12 -1
Table 1.1: The SM particles and their superpartners introduced by the supersymmetry. Symbol, Spin and R-Parity of each particle are shown.
Figure 1.3: Illustration of the Higgs potential. The left/right figure shows the Higgs potential before/after electroweek spontaneous symmetry breaking (EWSB) and the center shows the
transition. The parameters are > 0 and µ2> 0 before the EWSB, and > 0 and µ2< 0 after
the EWSB.
Figure 1.4: Feynman diagrams for loop correction to the Higgs mass m2H from a fermion (a) and
the correction from a scalar (b)
Supersymmetry (SUSY) or Supersymmetric Standard Model [6–12] is a well motivated
ex-tension of the SM that provides a natural solution [13,14] to the hierarchy problem.
The supersymmetry assumes that there exists a symmetry between fermions and bosons by introducing an operator Q carrying spin angular momentum 1/2 that transforms from a bosonic state into a fermionic state, and vice versa such as:
Q|Bosoni = |Fermioni , Q |Fermioni = |Bosoni (1.5)
A minimal incorporation of the supersymmetry into the SM requires that there should exist
su-persymmetric partner (superpartner) particles to each of the SM particles as shown in Table1.1,
respectively. The superpartner of fermion is a scalar particle with spin 0 (Sfermion), and the
superpartner of boson is a fermion particle with spin 1
2 (Bosino). Each superpartner particle
has the same mass as its partner unless the supersymmetry be broken. Each sfermion also has
the same multiplet structure of its partner, SU (3)C⌦ SU(2)L⌦ U(1)Y, so there are also
left-and right-hleft-anded spinors for each sfermion. This extension of fermion multiplet is called ‘chiral
supermultiplet’ and summarized in Table1.2.
Furthermore, the couplings of fermion and sfermion to the Higgs are assumed to be exactly
the same, namely S =| f|2, where S is a Yukawa coupling constant for sfermion. Therefore,
the Feynman diagram of the loop correction from the sfermion to the Higgs mass is described as
shown in Figure1.4(b) and the correction is denoted by:
m2H = 2⇥ S 16⇡2⇤ 2 UV 2m2Sln (⇤UV/mS)... , (1.6)
Names Spinor Notation spin 0 spin 1/2 SU (3)C, SU (2)L, U (1)Y squarks, quarks Q ⇣u˜L d˜L ⌘ (uL dL) 3, 2, 16 (⇥3 families) u¯ u˜⇤R u†R 3, 1,¯ 23 ¯ d d˜⇤R d†R 3, 1,¯ 1 3 sleptons, leptons L (˜⌫L e˜L) (⌫L eL) 1, 2, 12 (⇥3 families) e¯ e˜⇤ R e†R (1, 1, 1)
Table 1.2: Chiral supermultiplet and notation of left- and right-handed spinors for each fermion and each sfermion.
where mS is mass of a sfermion. A remarkable thing is that the correction is positive2 and
completely cancels the huge loop correction from fermion to the Higgs mass in Equation 1.4.
However, since the sfermion cancellation also leaves its own logarithmic correction proportional
to m2
S (the second term in Equation 1.6), the mass of the sfermion with the largest Yukawa
coupling must be, at most, at the order of⇠ 1 TeV so that m2
H does not become too large.
This series of extensions of the SM is called Minimal Supersymmetric Standard Model (MSSM) and its logic or property to solve the hierarchy problem is called ‘naturalness’.
In the MSSM, baryon number and lepton number get no longer conserved by all of the renormalizable couplings, but this conservation breaking must be very small in order not to
conflict with the experimental upper limit on the proton life time [15]. To solve this, the MSSM
requires that ‘R-parity’ should be conserved in the MSSM interactions. The R-parity is defined by:
PR= ( 1)3(B L)+2s (1.7)
where B and L are baryon and lepton number and s is spin, respectively. As shown in Table1.1,
PR = +1 for the SM particles and PR = 1 for the superpartners. If R-parity conservation is
true, this provides three important phenomenological consequences [16]:
• The lightest sparticle (LSP) with PR = 1 must be stable. If the LSP is electrically
neutral, it interacts only weakly with ordinary matter. Then the LSP can be an attractive
candidate for the ‘Dark Matter’ [17,18].
• Each sparticle except for the LSP must eventually decay into a state that contains an odd number of LSPs (usually just one).
• In collider experiments, sparticles can only be produced in even numbers at one collision (usually two at one collision).
In addition to naturalness and dark matter, ‘gauge coupling unification’ is also one of the theoretical motivations of the MSSM. By introducing the supersymmetric particles, it modifies the energy dependence of the three running coupling constants, making possible their perfect
convergence at the scale of grand unification theory (GUT), ⇤GUT ⇠ 1016 GeV [6, 19–21].
Figure1.5shows the three running coupling constants in the SM and MSSM.
2This is due to a spin-statistics theorem meaning that fermions will have a negative contribution and bosons
Figure 1.5: Two-loop renormalization group evolution of the inverse gauge couplings ↵ 1
a (Q) in
the SM (dashed lines) and the MSSM (solid lines) [6]. The dependency on the threshold energy of
transition from the SM to the MSSM is indicated by blue line (500 GeV) and red line (1.5 TeV).
1.4
Top Squark
Up to the present time, a superpartner particle that has the same mass as its normal partner has not been discovered, hence the supersymmetry breaking must occur so that superpartner particles get heavier than their normal partners.
Unlike the light-flavor squarks in the first and second generation, the stop has a non-negligible
left-right mixing due to its large Yukawa coupling [22]3. The left-right mixing is described by a
hermitian 2⇥ 2 mass matrix:
L˜tM = (˜t⇤L, ˜t⇤R) M2 ˜ tLL M 2 ˜ tLR M2 ˜ tRL M 2 ˜ tRR ! ˜ tL ˜ tR ! , (1.8) with M˜t2LL = M 2 ˜ Q3+ (T 3 t Qtsin2✓W) cos 2 m2Z+ m2t M˜t2RR = M 2 ˜ t + Qtsin 2✓ Wcos 2 m2Z+ m2t M˜t2RL= (M 2 ˜ tLR) ⇤= m t ⇣ A˜t µ⇤(tan ) 2T 3 t ⌘ (1.9)
where mt, Qt and Tt3 are the mass, electric charge and weak isospin of top quark, respectively.
✓W denotes the weak mixing angle, tan = vu/vd with vu (vd) being the vacuum expectation
value of the Higgs field H0
u(Hd0). MQ˜3is the mass of left-handed squark spinor of third generation
( ˜Q3=
⇣ ˜ tL, ˜bL
⌘
), and M˜t is the mass of right-handed spinor of stop. At˜is a trilinear coupling
constant of stop. In case parameters µ and At˜are complex, the o↵-diagonal elements Mt˜2RL =
(M2
˜
tLR)
⇤ are also complex with a phase of
˜ t= arg h M˜t2RL i = arghAt µ⇤(tan ) 2T 3 t i . (1.10)
Finally, the stops in the mass eigenstates are written such as ˜ t1= ei ˜tcos ✓˜t˜tL+ sin ✓t˜˜tR ˜ t2= sin ✓˜t˜tL+ e i ˜tcos ✓˜t˜tR (1.11) where cos ✓˜t= M2 ˜ tLR r M2 ˜ tLR 2 +⇣m2 ˜ t1 M 2 ˜ tLL ⌘2, sin ✓˜t= M2 ˜ tLL m 2 ˜ t1 r M2 ˜ tLR 2 +⇣m2 ˜ t1 M 2 ˜ tLL ⌘2. (1.12)
Then the mass eigenvalues can be deduced to: m2˜t1,2= 1 2 ⇣ M˜t2LL+ M 2 ˜ tRR ⌘ ⌥r⇣M2 ˜ tLL M 2 ˜ tRR ⌘2 + 4 M2 ˜ tLR 2! (1.13) where mt˜1 < mt˜2.
1.5
Neutralino
The higgsinos and electroweak gauginos mix each other because of the e↵ects of the EWSB. The
neutral higgsinos ( ˜H0
u and ˜Hd0) and the neutral gauginos ( ˜B, ˜W0) are combined to form four
mass eigenstates called ‘neutralinos’. The neutralino mass eigenstates are denoted by ˜01,2,3,4.
By convention, they are labeled in ascending order; m˜0
1 < m˜02 < m˜03 < m˜04. The lightest
neutralino ˜01is usually assumed to be the LSP or the dark matter candidate.
In the gauge-eigenstate basis 0 = ( ˜B, ˜W0, ˜H0
d, ˜Hu0), the neutralino mass term of the
La-grangian is Lneutralino mass= 1 2( 0)TM ˜0 0+ c.c., (1.14) where M˜0 = 0 B B B B @ M1 0 c sWmZ s sWmZ 0 M2 c cWmZ s cWmZ c sWmZ c cWmZ 0 µ s sWmZ s cWmZ µ 0 1 C C C C A. (1.15)
M1and M2are bino and wino mass, µ is higgsino mass, and s = sin , c = cos , sW = sin ✓W,
and cW = cos ✓W. The mass matrix M˜0 can be diagonalized by a unitary matrix N to obtain
mass eigenstates: ˜0i= Nij 0 j (1.16) so that N⇤M˜0N 1= 0 B B B B @ m˜0 1 0 0 0 0 m˜0 2 0 0 0 0 m˜0 3 0 0 0 0 m˜0 4 1 C C C C A (1.17)
has real positive values on the diagonal. Although ˜01 (and ˜02, ˜03, ˜04) is basically a mixture of
˜
B, ˜W0, ˜H0
d, ˜Hu0, ˜
0
1 could be in a pure state, such as:
• Pure Bino: M1⌧ M2, µ =) ˜01⇡ ˜B • Pure Wino: M2⌧ M1, µ =) ˜01⇡ ˜W0 • Pure Higgsino: µ ⌧ M1, M2=) ˜01⇡ ⇣ ˜ Hu0± ˜H 0 d ⌘ p 2
1.6
Stop Search
This thesis aims at searching for the lighter stop (˜t1). As described in Section1.3, if the
natu-ralness is true, the sfermion with the largest Yukawa coupling, namely stop, must have the mass
of the order of ⇠ 1 TeV [23, 24]. This mass range can be explored sufficiently in the LHC, a
hadron collider providing pp collisions atps = 13 TeV. Stops can be produced through strong
interactions and therefore can be produced in pp collisions. Because of the R-parity conservation, two stops are directly produced at one collision.
(a) stop two-body decay (˜t1! t ˜ 0
1) (b) stop three-body decay (˜t1! bW ˜01)
Figure 1.6: Feynman diagram of the direct pair production of ˜t1 particles and their two types
of decays, ˜t1 ! t ˜01 (a) and ˜t1 ! bW ˜01 (b). For simplicity, no distinction is made between
particles and antiparticles. The ˜t1 ! t ˜
0
1 and ˜t1 ! bW ˜
0
1 decay modes can be allowed if
m˜t1 m˜01 ⌘ m(˜t1, ˜
0
1) > mtand mt> m(˜t1, ˜01) > mW, respectively.
The stop can decay into a variety of final states, depending on the SUSY particle mass spectrum, in particular on the masses of the stop and lightest neutralino. The analysis presented
in this thesis targets ˜t1 ! t ˜01 decay mode illustrated in Figure 1.6(a) where m˜t1 m˜01 ⌘
m(˜t1, ˜01) > mt, and focuses on the events with one lepton, where each ˜t1 decays as ˜t1! t ˜01,
the W boson from one of the two top quarks decays to an electron or muon (either directly or via a ⌧ lepton) and the W boson from the other top quark decays hadronically. The final state can
be denoted by ˜t1˜t1 ! [bqq ˜01][b`⌫ ˜01] (with no distinction between particles and antiparticles).
Thus, the dominant SM background events are: • t¯t
• a top quark and a W boson (single top, W t) • t¯t+ Z(! ⌫ ¯⌫)
• W bosons and jets (W +jets) • two bosons (diboson)
In the analysis, the contribution of multijet events is found to be negligible from an data-driven
sensitive to ˜t1! bW ˜01 decay mode shown in Figure1.6(b) where mt> m(˜t1, ˜01) > mW, the
results are also interpreted in the ˜t1! bW ˜
0
1decay mode scenario.
The signal kinematic topology highly depends on the model parameter m(˜t1, ˜01), therefore
there are three analyses individually optimized to three types of kinematic topologies, Boosted
( m(˜t1, ˜ 0 1)& 3mt), Resolved ( m(˜t1, ˜ 0 1)⇠ 2mt), and Diagonal ( m(˜t1, ˜ 0 1)⇠ mt). Figure1.7
and1.8illustrate the three topologies and territories of the three topologies in a (mt˜1, m˜01) plane.
For a scenario of m(˜t1, ˜01)& 3mt, the topology would be Boosted (Figure 1.7(a)), where the
three jets from the t decay forms one large-R jet and a significantly large missing transverse energy
(Emiss
T ) arises from the two ˜
0
1’s with very high pT. For a scenario of m(˜t1, ˜01) ⇠ 2mt, the
topology would be Resolved (Figure1.7(b)), where the three jets are not merged into one large-R
jet but resolved and a large Emiss
T arises from the two ˜
0
1’s. For a scenario of m(˜t1, ˜01)⇠ mt,
the topology would be Diagonal (Figure1.7(c)), where the three jets are resolved and ˜01 and t
from ˜t1decay are nearly collinear with respect to ˜t1 momentum. The latter tendency results in
a large cancellation of Emiss
T contributions from the two ˜
0
1’s.
In a preceding study using the data of 13.2 fb 1, which uses events with one lepton in the
final state, there were some excesses of CLb = 2.2 3.3 in several signal regions which are
somewhat kinematically overlapped with each other [27]. The search in this thesis covers a part of
the phase spaces with the excesses. For this reason, Resolved and Boosted analyses in this thesis
are similar to those of Ref. [27]. The originality in this thesis is that a new analysis is developed
and performed to search a stop mass region, named Diagonal, which is very important to solve the hierarchy problem naturally. The key technique newly developed for Diagonal analysis is a background estimation using ‘2-dimensional shape fit’, which greatly expands the search region of Diagonal. In the following sections, Boosted, Resolved, and Diagonal analysis strategies are outlined.
(a) Boosted ( m(˜t1, ˜01)& 3mt)
(b) Resolved ( m(˜t1, ˜ 0 1)⇠ 2mt) (c) Diagonal ( m(˜t1, ˜ 0 1)⇠ mt)
Figure 1.7: Illustration of three types of the signal kinematic topologies, Boosted, Resolved, and
Diagonal, categorized by m(˜t1, ˜
0
1). The dashed lines indicate particles completely invisible to
Figure 1.8: Illustration of all the mass points used in the analysis with categorization of the signal
kinematic topologies. The red circle and the blue cross indicate the decay modes, ˜t1! t ˜01 and
˜
t1! bW ˜
0
1, respectively. The red and blue dashed lines are the boundaries of the decay modes.
The cyan, purple, and orange regions are generally Diagonal, Resolved, and Boosted topology, respectively. The benchmark mass points to optimize Diagonal, Resolved, and Boosted analyses are indicated by cyan, purple, and orange stars, respectively.
1.6.1
Boosted
Boosted analysis aims at signal events with m(˜t1, ˜01) & 3mt as indicated by the orange
re-gion in Figure 1.8. The benchmark mass point to optimize Boosted analysis is (m˜t1, m˜01) =
(1000, 1) GeV.
In Boosted region, as shown in Figure1.7(a), top quarks are highly boosted so that bqq0 from
hadronic top decay forms one large-R jet. If one approximates its R by R of W and b from
top decay, then it can be written as the following equation;
R⇡2mp t
T , (1.18)
where pT is for top quark. In Boosted region, the top quark pT can be approximately deduced
to pT⇠ m2 ˜ t1 m 2 t
2m˜t1 , hence pT in Boosted region is typically more than⇠ 300 GeV and therefore
R of the large-R jet is less than ⇠ 1.2. Figure 1.9 shows distribution of R between the W
and b from top quark decay as a function of the top quark pT and indicates that R for top
quarks with pT= 300 GeV is mostly less than 1.2. From this fact and an optimization study, a
reclustering jet algorithm is used in Boosted analysis that reconstructs large-R jets from small-R
jets using anti-kT algorithm with a jet radius parameter R = 1.2 [28]. Section4.8describes the
algorithm in detail.
transverse energy (Emiss
T , see Section 4.6) than Resolved and Diagonal topologies and the SM
events. The dominant background remaining after a large Emiss
T requirement is t¯t and t¯t + Z(⌫⌫)
event.
Figure 1.9: R between the W and b from top quark decay as a function of the top quark
pT [29]. The distributions in every pTbins are normalized to 1. the color coding corresponds to
the fraction of considered top quarks at a pT bin. The distribution corresponds to the particle
information at the generator level after the emission of initial and final state radiation and are
obtained from t¯t decays in pp collisions atps = 8 TeV simulated using Powheg +Pythia.
1.6.2
Resolved
Resolved analysis aims at signal events with m(˜t1, ˜01) ⇠ 2mt as indicated by the purple
re-gion in Figure 1.8. The benchmark mass point to optimize Resolved analysis is (m˜t1, m˜01) =
(600, 300) GeV.
In Resolved region, as shown in Figure1.7(b), the hadronic top decay products are not merged
into one large-R jet but resolved into three smaller-radius jets because pTof top quark is relatively
medium. Since the ˜01’s pT is also relatively medium, Resolved topology tends to provide larger
Emiss
T than Diagonal topology and the SM events. The dominant background remaining after
a large ETmiss requirement is t¯t ! [b`⌫][b`lost⌫] event where `lost is a lost lepton due to outside
acceptance, and thus contributes to increase Emiss
T . Section 5.2describes an event selection to
suppress the t¯t! [b`⌫][b`lost⌫] event and the other backgrounds.
1.6.3
Diagonal
Diagonal analysis aims at signal events with m(˜t1, ˜01)⇠ mt as indicated by the cyan region
in Figure 1.8. In Figure 1.8, m(˜t1, ˜01) = mtop is equivalent to the red dashed line of the
transition from ˜t1! t ˜01 to ˜t1 ! bW ˜01 decay mode, and thus it is called ‘(top-mass) diagonal
˜
t1! t ˜01 event topology, although the analysis is optimized just only to ˜t1! t ˜01 scenario. The
benchmark mass point to optimize Diagonal analysis is (mt˜1, m˜01) = (400, 200) GeV.
In the region near the diagonal line, as shown in Figure1.7(c), the behavior of hadronic top
decay is the same as Resolved region. Figure 1.7(c) also indicates that ˜01 and t from ˜t1 decay
are nearly collinear with respect to ˜t1momentum, because momenta of t and ˜
0
1 at the center of
mass system of ˜t1 ! t ˜01 are nearly 0. In addition, since ˜t1 pair is produced typically
back-to-back, the directions of the two ˜01’s also tend to be almost back-to-back. This results in a large
cancellation of Emiss
T contributions from the two ˜
0
1’s, and therefore Diagonal topology tends to
provide a little bit larger Emiss
T than the SM events4.
Since the di↵erence between Diagonal topology and t¯t event topology is smaller than Boosted
and Resolved, the dominant background is t¯t event and it is very challenging to suppress them
by event selection. For this reason, Diagonal analysis exploits a 2-dimensional (Emiss
T ,mT) shape
fit that provides a precise background estimation, which is described in Section6.4.
In the following chapters, the Boosted, Resolved, and Diagonal analyses are described in
detail. Chapter2introduces outlines of the LHC and the ATLAS detector. Chapter3describes
dataset and Monte Carlo samples used in the analyses. Chapter 4 defines physics objects and
Chapter 5 defines event selections using the physics objects. Chapter 6 describes background
estimations. Chapter7introduces hypothesis test procedures used to provide quantitative results
of stop search. Chapter8describes systematic uncertainties used in the background estimations.
Chapter9 presents the stop search results. Chapter10is the conclusion of this thesis.
4 If there is an initial or final state radiation from pp! ˜t
1˜t1 process, the two ˜01’s are not in back-to-back
state and then a relatively large Emiss
Chapter 2
ATLAS Experiment
2.1
Large Hadron Collider
The Large Hadron Collider (LHC) [30] at the European Organization for Nuclear research
(CERN) is a circular proton-proton (pp) collider. It is located in a tunnel with a 27 km cir-cumference at a depth below ground of between 45 m (around lake Geneva) - 170 m (at the foot of the Jura mountains), which was excavated in the 1980s. In 8.33 T magnetic fields provided by superconducting dipole electromagnets, the proton beams circulate in opposite direction in two separate beam pipes in an ultra-high vacuum. Before being injected into the LHC, proton beams
pass through a chain of pre-accelerators shown in Figure2.1. First of all, the hydrogen atoms
Figure 2.1: The CERN accelerator complex [31]. The LHC is the last ring (dark blue line) in a
complex chain of particle accelerators.
with valence electrons stripped o↵ are accelerated in the linear accelerator 2 (LINAC2) up to 50 MeV, and are injected afterwards into the Proton Synchrotron Booster (PSB). This first circular pre-accelerator increases the energy of the protons up to 1.4 GeV. After that, the protons are
accelerated to 25 GeV in the Proton Synchrotron (PS) and then injected into the Super Proton Synchrotron (SPS), where they are accelerated up to 450 GeV and then piped to the LHC. At the LHC, the protons are further accelerated up to the maximum achievable energy and are then collided at each of the four interaction points where the four main LHC experiments are hosted, the ATLAS, CMS, ALICE and LHCb experiments.
In the physics runs from 2010 to 2012 (Run-1), the center of mass energy of pp collisions ps
was 7-8 TeV. From 2015, LHC started with approximately 2 times higher energyps = 13 TeV
(Run-2). Figure2.2shows the peak and average instantaneous luminosity as a function of date in
2016. The max peak instantaneous luminosity in 2016 was 13.7⇥1033cm 2s 1. The frequency of
the bunch crossing is 40 MHz (in other words, the time between colliding bunches is 25 ns). The
number of average interactions per bunch crossing is measured as shown in Figure2.3. Since the
instantaneous luminosity gradually increased during 2016, the number of the average interactions in 2016 is larger than 2015.
Figure 2.2: Peak and average instantaneous luminosity as a function of date in 2016.
Figure 2.3: Observed number of the
aver-age interactions per bunch crossing. The
2015 dataset (3.2 fb 1) and the 2016 dataset
(33.3 fb 1) are shown in the plot (amount to
2.2
ATLAS Detector
ATLAS (A Toroidal LHC ApparatuS) detector [32] is a multipurpose particle physics detector
with nearly 4⇡ coverage in solid angle at the collision point.
In the ATLAS experiment, a right-handed coordinate system where the reference point is set at the nominal interaction point in the center of the detector and the z-axis is set along the beam pipe. The x-axis is set to point from the interaction point to the center of the LHC ring, and the y-axis points upward vertically. Cylindrical coordinates (r, ) are also used in the x-y
plane, where is the azimuthal angle around the z-axis. The pseudorapidity is defined using the
polar angle ✓ as ⌘ = ln tan(✓/2). and ⌘ are also used to measure angular distance defined as
R⌘p( ⌘)2+ ( )2.
From inside to outside, particles traverse the inner detector (tracking of charged particles), the electromagnetic calorimeter (measuring energies of electron and photon), the hadronic calorime-ter (measuring energies of hadrons), and the muon spectromecalorime-ter (identifying muon and measuring
its momentum) as illustrated in Figure2.4and2.5.
Figure 2.4: Cut-away view of the ATLAS detector [32]. The dimensions of the detector are 25 m
Figure 2.5: Illustration of particle detection in the sub-detectors of the ATLAS detector in R- cut-away view. From inside to outside, particles traverse the inner tracking detector, the electromagnetic calorimeter, the hadronic calorimeter, and the muon spectrometer. Trajectories indicated by dashed lines are invisible to the sub-detectors. For example, photons are invisible to the inner tracking detector but visible to the electromagnetic calorimeter. Neutrinos are invisible to all the sub-detectors.
2.2.1
Inner Detector
Figure 2.6: R- cross-sectional view of barrel part of the ATLAS inner detector, including the
new insertable B-layer (IBL) [33]. The distances to the interaction point are also shown.
Approximately 1000 particles are produced from the collision point every 25 ns within|⌘| <
2.5, and make a very high track density in the detector. The inner detector (ID) is designed to achieve robust track-pattern recognition and precision measurements of tracks and vertices.
Figure 2.6 and 2.7 show the R- sectional view of the ID barrel part and the R-z
cross-sectional view of the ID, respectively. The ID is immersed in a uniform 2 T magnetic field generated by the central solenoid, which extends over a length of 5.3 m with a diameter of 2.5 m. The ID consists of 4 discrete sub-detectors, from inside to outside, silicon pixel detector (Pixel), semi-conductor tracker (SCT), and transition radiation tracker (TRT).
The precision tracking detectors (Pixel and SCT) cover the region |⌘| < 2.5. In the barrel
region, Pixel and SCT are arranged on concentric cylinders around the beam axis. In the end-cap regions, Pixel and SCT are located on disks perpendicular to the beam axis.
The Pixel achieves the high granularity around the vertex region. The Pixel layers are located such that each track typically crosses four pixel layers. The innermost layer, named insertable
B-layer (IBL) [33], consists of 14 staves equipped with planar and 3D silicon pixel sensor technology
that are arranged in turbine-like fashion. The pixel size of the IBL is 50⇥ 250 µm2 in
R-⇥ z.
The pixel sensors in the three outer layers have a minimum pixel size of 50⇥ 400 µm2 in
R-⇥ z. The intrinsic accuracies in the barrel are 10 µm (R- ) and 115 µm (z) and in the disks are 10 µm (R- ) and 115 µm (R).
For the SCT, eight strip layers are crossed by each track and reconstruct four space points. In the barrel region, the SCT uses small-angle (40 mrad) stereo strips and locate one set of strips
Figure 2.7: R-z cross-sectional view of the layout of the ATLAS Inner Detector for Run-2 [34]. The top panel shows the whole Inner Detector, whereas the bottom panel shows a magnified view of the Pixel detector region.
in each layer parallel to the beam axis in order to measure R- coordinates. The layers consist of two 6.4 cm long daisy-chained sensors with a strip pitch of 80 µm. In the end-cap region, the SCT has a set of strips running radially and a set of (40 mrad) stereo strips. The average pitch of the strips is approximately 80 µm. The intrinsic accuracies in the barrel are 17 µm (R- ) and 580 µm (z) and in the disks are 17 µm (R- ) and 580 µm (R).
The TRT provides typically 36 hits per track by its 4 mm diameter straw tubes and covers |⌘| < 2.0. The TRT only provides R- information and the intrinsic accuracy is 130 µm per straw. In the barrel region, the straws are 144 cm long and are parallel to the beam axis. In the end-cap region, the straws are 37 cm long and are arranged radially in wheels. The combination of the Pixel and the SCT with the TRT gives very robust pattern recognition and very high precision in both R- and z coordinates. The TRT contribute significantly to the momentum measurement because of the large number of measurements and the longer measured track length. In order to identify electron, the tracking measurements in the ID system are also used with the precision measurements of the electromagnetic calorimeter. The electron identification capabilities are enhanced by the detection of transition-radiation photons in the xenon-based gas mixture of the TRT straw tubes. The Pixel and SCT also allow impact parameter measurements and vertexing for b-jet and ⌧ lepton tagging. The performance of secondary vertex measurement is enhanced by the innermost layer of the Pixel at a radius of 33.5 mm.
2.2.2
Electromagnetic Calorimeter and Hadronic Calorimeter
Figure 2.8: A cut-away view of the ATLAS calorimeter [35].
Figure2.8shows a cut-away view of the calorimeters. These calorimeters cover the range|⌘|
< 4.9, using di↵erent techniques suited to the various requirements of the physics processes of interest and of the radiation environment over this large ⌘-range. Over the ⌘ region matched
to the inner detector,|⌘| < 2.5, the fine granularity of the electromagnetic (EM) calorimeter is
ideally suited for precision measurements of electrons and photons. The coarser granularity of the rest of the calorimeter is enough to satisfy the physics requirements for jet reconstruction
and missing transverse energy measurements. Table 2.1 shows granularity versus |⌘| of all the
calorimeters.
Calorimeters are required to stop electromagnetic and hadronic showers in themselves, and suppress punch-through into the muon system. The total thickness of the EM calorimeter is at
least 22 radiation lengths (X0) in the barrel and at least 24 X0in the end-caps. The approximate
9.7 nuclear interaction lengths ( ) of hadronic calorimeter in the barrel (10 in the end-caps)
are adequate to provide good resolution for high energy jets, E/E = 50%/pE/GeV 3%.
The total thickness (including 1.3 from the outer support) is 11 at|⌘| = 0 and is enough to
reduce punch-through of jets significantly (although muons can pass). This thickness also ensures a good missing transverse energy measurement, which is important for many physics analyses
especially for SUSY particle searches. Figure2.9and2.10summarize radiation and interaction
lengths of the ATLAS calorimeters.
The ATLAS Calorimeter consists of 4 types of calorimeters: Liquid Argon (LAr) Calorimeter
It is a lead-LAr detector with accordion-shaped kapton electrodes and lead absorber plates.
EM Calorimeter Barrel End-cap Granularity ⌘⇥ versus|⌘| Presampler 0.025⇥ 0.1 |⌘| < 1.52 0.025⇥ 0.1 1.5 <|⌘| < 1.8 Calorimeter 1st layer 0.025/8⇥ 0.1 |⌘| < 1.40 0.050⇥ 0.1 1.375 <|⌘| < 1.425 0.025⇥ 0.025 1.40 <|⌘| < 1.475 0.025⇥ 0.1 1.425 <|⌘| < 1.5 0.025/8⇥ 0.1 1.5 <|⌘| < 1.8 0.025/6⇥ 0.1 1.8 <|⌘| < 2.0 0.025/4⇥ 0.1 2.0 <|⌘| < 2.4 0.025⇥ 0.1 2.4 <|⌘| < 2.5 0.1⇥ 0.1 2.5 <|⌘| < 3.2 Calorimeter 2nd layer 0.025⇥ 0.025 |⌘| < 1.40 0.050⇥ 0.025 1.375 <|⌘| < 1.425 0.075⇥ 0.025 1.40 <|⌘| < 1.475 0.025⇥ 0.025 1.425 <|⌘| < 2.5 0.1⇥ 0.1 2.5 <|⌘| < 3.2 Calorimeter 3rd layer 0.050⇥ 0.025 |⌘| < 1.35 0.050⇥ 0.025 1.5 <|⌘| < 2.5
LAr Hadronic End-cap (HEC)
Granularity ⌘⇥ versus|⌘|
Calorimeter 1st layer 0.1⇥ 0.1 1.5 <|⌘| < 2.5
Calorimeter 2nd layer 0.1⇥ 0.1 1.5 <|⌘| < 2.5
Calorimeter 3rd layer 0.2⇥ 0.2 2.5 <|⌘| < 3.2
Calorimeter 4th layer 0.2⇥ 0.2 2.5 <|⌘| < 3.2
LAr Forward Calorimeter (FCal)
Granularity x⇥ y (cm) versus |⌘|
Calorimeter 1st layer 3.0⇥ 2.6 3.15 <|⌘| < 4.30
⇠ four times finer 3.10 <|⌘| < 3.15
4.30 <|⌘| < 4.83
Calorimeter 2nd layer 3.3⇥ 4.2 3.24 <|⌘| < 4.50
⇠ four times finer 3.20 <|⌘| < 3.24
4.50 <|⌘| < 4.81
Calorimeter 3rd layer 5.4⇥ 4.7 3.32 <|⌘| < 4.60
⇠ four times finer 3.29 <|⌘| < 3.32
4.60 <|⌘| < 4.75
Scintillator Tile Calorimeter
Granularity ⌘⇥ versus|⌘|
Barrel Extended Barrel
Calorimeter 1st layer 0.1⇥ 0.1 |⌘| < 1.0 0.1⇥ 0.1 0.8 <|⌘| < 1.7
Calorimeter 2nd layer 0.1⇥ 0.1 |⌘| < 1.0 0.1⇥ 0.1 0.8 <|⌘| < 1.7
Calorimeter 3rd layer 0.2⇥ 0.1 |⌘| < 1.0 0.2⇥ 0.1 0.8 <|⌘| < 1.7
Pseudorapidity 0 0.5 1 1.5 2 2.5 3 0 X 0 2 4 6 8 10 12 Pseudorapidity 0 0.5 1 1.5 2 2.5 3 0 X 0 2 4 6 8 10 12 Before accordion Before presampler Pseudorapidity 1.4 1.45 1.5 1.55 1.6 1.65 1.7 0 X 0 5 10 15 20 25 30 35 40 45 Pseudorapidity 1.4 1.45 1.5 1.55 1.6 1.65 1.7 0 X 0 5 10 15 20 25 30 35 40 45 End-cap accordion
Before end-cap accordion Before end-cap presampler Before scintillator
Barrel accordion Before barrel accordion Before barrel presampler
Pseudorapidity 0 0.2 0.4 0.6 0.8 1 1.2 1.4 0 X 0 5 10 15 20 25 30 35 40 Pseudorapidity 0 0.2 0.4 0.6 0.8 1 1.2 1.4 0 X 0 5 10 15 20 25 30 35 40 Layer 3 Layer 2 Layer 1 Before accordion Pseudorapidity 1.6 1.8 2 2.2 2.4 2.6 2.8 3 3.2 0 X 0 5 10 15 20 25 30 35 40 45 Pseudorapidity 1.6 1.8 2 2.2 2.4 2.6 2.8 3 3.2 0 X 0 5 10 15 20 25 30 35 40 45 Layer 3 Layer 2 Layer 1 Before accordion
Figure 2.9: Cumulative amounts of material in front of and in the electromagnetic calorimeters,
in units of radiation length X0, as a function of|⌘|. The top left-hand plot shows separately the
total amount of material in front of the presampler layer and in front of the accordion for the full ⌘-coverage. The top right-hand plot shows the details of the crack region between the barrel and endcap cryostats. The two bottom figures show the thicknesses of each accordion layer as well as the amount of material in front of the accordion, for the barrel (left) and end-cap (right) part, respectively.
lead thickness in the absorber plates has been optimized as a function of ⌘ in terms of EM calorimeter performance in energy resolution. The EM calorimeter is divided into a barrel
part (|⌘| < 1.475) and two end-cap components (1.375 < |⌘| < 3.2). The barrel calorimeter
consists of two identical half-barrels, separated by a small gap (4 mm) at z = 0. Each end-cap calorimeter is mechanically divided into two coaxial wheels; an outer wheel covering the
region 1.375 <|⌘| < 2.5, and an inner wheel covering the region 2.5 < |⌘| < 3.2. Over the
region devoted to precision physics (|⌘| < 2.5), the EM calorimeter is segmented in three
sections in depth. Furthermore, in the region of |⌘| < 1.8, a presampler detector is used
to correct for the energy lost by electrons and photons upstream of the calorimeter. The presampler consists of only an active LAr layer of thickness 1.1 cm (0.5 cm) in the barrel
(end-cap) region. Figure 2.11and 2.12show a module in the barrel and the
accordion-shaped structure. With Run-1 full datasets, the energy resolution for electron and photon
has been studied and is shown in Figure 2.13.
Tile Calorimeter
It is a hadronic calorimeter located just outside the EM calorimeter envelope. Its barrel
covers the region |⌘| < 1.0, and its two extended barrels 0.8 < |⌘| < 1.7. It is a
0
0.5
1
1.5
2
2.5
3
3.5
4
4.5
5
0
2
4
6
8
10
12
14
16
18
20
Pseudorapidity
0
0.5
1
1.5
2
2.5
3
3.5
4
4.5
5
Interaction lengths
0
2
4
6
8
10
12
14
16
18
20
EM calo
Tile1
Tile2
Tile3
HEC0
HEC1
HEC2
HEC3
FCal1
FCal2
FCal3
Figure 2.10: Cumulative amount of material, in units of interaction length, as a function of |⌘|.
The total amount of material in front of the electromagnetic calorimeters and in front of the first
active layer of the muon spectrometer (up to |⌘| < 3.0) are also shown (dusty yellow and light
blue respectively).
Figure 2.14 shows structure of a barrel module of the tile calorimeter. The barrel and
extended barrels are divided azimuthally into 64 modules. Radially, the tile calorimeter extends from an inner radius of 2.28 m to an outer radius of 4.25 m. It is segmented in depth in three layers, approximately 1.5, 4.1 and 1.8 nuclear interaction lengths ( ) for the
barrel and 1.5, 2.6, and 3.3 for the extended barrel. The total detector thickness at the
outer edge of the tile-instrumented region is 9.7 at|⌘| = 0.
LAr Hadronic End-cap Calorimeter (HEC)
It consists of two independent wheels per end-cap located behind the end-cap
electromag-netic calorimeter. The HEC covers the range 1.5 <|⌘| < 3.2.
LAr Forward Calorimeter (FCal)
It covers 3.1 <|⌘| < 4.9. In order to reduce the amount of neutrons in the inner detector
cavity, the front face of the FCal is 1.2 m behind the EM calorimeter front face as shown
in Figure 2.15. This severely limits the depth of the calorimeter and therefore calls for a
high-density design. The FCal is approximately 10 interaction lengths deep, and consists of three modules in each end-cap; the first, made of copper, is optimized for electromag-netic measurements, while the other two, made of tungsten, measure mainly the energy of
hadronic interactions. As shown in Figure 2.16, each module consists of a metal matrix,
with regularly spaced longitudinal channels filled with the electrode structure consisting of concentric rods and tubes parallel to the beam axis. The LAr in the gap between the rod and the tube is the sensitive medium.
Figure 2.11: Sketch of a barrel module in the LAr calorimeter where the di↵erent layers are clearly
visi-ble with the accordion-shaped kapton electrodes [36].
The granularity in ⌘⇥ of the cells of each of the
three layers is also shown.
Figure 2.12: Accordion structure of the barrel [36].
The top figure is a view of a small sector of the barrel calorimeter in R- plane.
(a) Energy resolution for electron (b) Energy resolution for photon
Photomultiplier
Wavelength-shifting fibre Scintillator Steel
Source tubes
Figure 2.14: Sketch of a barrel module of the tile calorimeter.
450 500 550 400 350 600 650 60 50 40 30 20 10 0 R (cm) z (cm) EMEC HEC (back) Pump
FCal 1 FCal 2 FCal 3
(EM) (Had) (Had) (front)
HEC
Moderator shielding shielding plug LAr Calorimeter
Figure 2.15: A schematic diagram showing the three FCal modules located in the end-cap cryostat. The material in front of the FCal and the shielding plug behind it are also shown. The black regions are structural parts of the cryostat. For clarity, the vertical scale is enlarged in the diagram.
R LAr gap Beam-pipe Warm wall Super-insulation Cold wall
Figure 2.16: Electrode structure of the FCal 1st layer with the matrix of copper plates and the copper tubes and rods with the LAr gap
for the electrodes. The Moliere radius, RM, is
2.2.3
Muon Spectrometer
Figure 2.17: Cut-away view of the ATLAS muon system.
The Muon Spectrometer (MS) is the outermost and largest part of the ATLAS detector
as shown in Figure 2.17. The MS is based on the magnetic deflection of muon tracks in the
large superconducting air-core toroid magnets and consists of separate trigger and high-precision
tracking chambers. Figure2.18shows geometry of the air-core toroid magnets. The use of air-core
toroid magnets can minimize the degradation of resolution due to multiple scattering. Figure2.19
shows a R-z cross-sectional view of the MS. For|⌘| < 1.4, magnetic bending is provided by the
large barrel toroid. For 1.6 <|⌘| < 2.7, muon tracks are bent by two smaller end-cap magnets
which are inserted into both ends of the barrel toroid. The range of 1.4 <|⌘| < 1.6 is usually
referred to as the transition region where magnetic deflection is provided by a combination of barrel and end-cap fields and the field is mostly orthogonal to the muon trajectories.
For |⌘| < 2.7, a precision measurement of the track coordinates is provided by Monitored
Drift Tubes (MDT’s). The mechanical separation in the drift tubes of each sense wire from its
neighbors assures a robust and reliable operation. For 2.0 <|⌘| < 2.7, Cathode Strip Chambers
(CSC’s) are used, which are multiwire proportional chambers with cathodes segmented into strips with higher granularity.
The trigger system of the MS covers the pseudorapidity range|⌘| < 2.4. As trigger chambers,
Resistive Plate Chambers (RPC’s) are used in the barrel and Thin Gap Chambers (TGC’s) are used in the end-cap regions. The trigger chambers provide bunch-crossing identification, provide
Figure 2.18: Geometry of air-core toroid magnets. The Tile calorimeter steel is also shown as a reference. The eight barrel toroid coils and the end-cap coils inserted into both ends of the barrel toroid are visible.
Figure 2.19: R-z cross-sectional view of the muon system. Infinite-momentum muons would propagate along straight trajectories which are illustrated by the dashed lines and typically traverse three muon stations.
2.3
Trigger and Data Acquisition
pp collisions in the LHC produce too many events to record all of them, most of which are
not interesting in physics analyses, for example, low pT multi-jet events. The cross section of
these events is about 100 mb while that of new physics events is typically at the order of 1 fb. Therefore, by using a two-level trigger system, the only interesting events are recorded as many
as possible with rejecting unimportant events. Figure2.20shows a schematic of the trigger and
data acquisition (TDAQ) system. The first level is a hardware-based system named ‘Level 1
Trigger (L1)’ and uses information of the calorimeter1 and the the muon spectrometer to reduce
the accepted rate to 100 kHz. The second level is a software-based system named ‘High Level Trigger (HLT)’ that reduces the rate of event records to 1 kHz. There are many types of triggers
for several physics purposes [38], which are called ”trigger menus”. The trigger menu must be
changed depending on the instantaneous luminosity.
Figure 2.20: The ATLAS trigger and data acquisition (TDAQ) system in Run-2 [39]. New
features with respect to the Run-1 system are indicated with orange boxes.
1 There is a long-term project of upgrading trigger readout of the calorimeter, which is aimed at
‘High-Luminosity LHC (HL-LHC)’ that will start from 2024 with an ultimate peak instantaneous luminosity ofL ⇠
Chapter 3
Data and Monte Carlo Samples
This chapter introduces datasets and Monte Carlo (MC) samples used in the analysis. Thedatasets are described in Section3.1with the detail of triggers used in the analysis. MC samples
are used to model events of the SM background and signal processes in ATLAS. The MC samples
are summarized in Section3.2.
3.1
Data and Trigger
In this thesis, ATLAS data collected in proton-proton (pp) collisions at a center-of-mass energy of
ps = 13 TeV in 2015 and 2016 are used. The data is required to have been recorded in the state
of stable beam and stable detector operation with no issue. In 2016, data taking has continued
until 26 October and finally amounts to 33.3 fb 1. In this thesis, the 2015 data (3.2 fb 1) and
the data taken until 9 September in 2016 (24.8 fb 1) are used, and therefore the total amount
is 28.0 fb 1.
Resolved and Boosted analyses use events recorded by a Emiss
T trigger that accepts events with
an Emiss
T threshold at trigger level 80 GeV for the 2015 dataset and 100 and 110 GeV for an
early and a late part of 2016 dataset, respectively1.
Diagonal analysis uses events recorded by the same Emiss
T trigger as the Resolved and Boosted
case, three single-electron triggers, or two single-muon triggers. If Emiss
T reconstructed at the
o✏ine level (see Section 4.6) is larger than 200 GeV, the Emiss
T trigger and the single-electron
and the single-muon triggers are considered; otherwise only those lepton triggers are considered.
The three single-electron triggers record an event if an electron has pTat the trigger level larger
than 24, 60, and 120 GeV for the 2015 dataset and 26, 60, and 140 GeV for the 2016 dataset.
The two single-muon triggers record an event if a muon has pT at the trigger level larger than
20 and 50 GeV for the 2015 dataset and 26 and 50 GeV for the 2016 dataset. The
single-electron and single-muon triggers with lower pT threshold impose tighter electron and muon
quality requirements. Table3.1summarizes the trigger configurations for Resolved, Boosted, and
Diagonal.
1As the instantaneous luminosity increases, pileup events increase so that trigger thresholds must be tighten
Trigger Threshold 2015 early-2016 late-2016 For Resolved, Boosted, and Diagonal
MET 80 GeV
100 GeV 110 GeV
For Diagonal Only
Single Electron 24 GeV + Medium ID
26 GeV + Tight ID + Loose Isolation 60 GeV + Medium ID
120 GeV + Loose ID 140 GeV + Loose ID
Single Muon 20 GeV + Loose Isolation
26 GeV + Medium Isolation 50 GeV
Table 3.1: Trigger configurations for Resolved, Boosted, and Diagonal. For Diagonal, events are
recorded by the Emiss
T or the single-lepton triggers, and the ETmiss triggers are used only when
o✏ine Emiss
T > 200 GeV; otherwise single-lepton triggers are used only. The single-electron and
single-muon triggers with lower pT threshold impose tighter electron and muon quality and/or
3.2
Monte Carlo Samples
The nominal MC samples used in this analysis are summarized in Table 3.2. All samples,
except for the signal and t¯t + sample, are processed with the full simulation of the ATLAS
detector [40] based on Geant4 [41]. The signal samples and the t¯t + sample are processed
with a fast simulation [42] of the ATLAS detector, where a parameterized shower simulation is
used for the calorimeter and other parts are the same as the full simulation.
The signal, t¯t + W/Z (for Resolved and Boosted), and t¯t + sample that are generated at
leading order (LO), while other samples and t¯t + W/Z (for Diagonal) are generated at
next-to-leading order (NLO). To simulate these events more realistically, additional radiations are generated by Pythia 8 in the parton showering process.
All samples are produced with varying the number of minimum-bias events following the expected pileup distributions, where the minimum-bias events simulated from Pythia 8 are added to a hard-scattering simulated event to account for pileup from multiple pp interactions in the same or nearby bunch crossings. Then, the number of average interactions per bunch crossing is reweighted to match the distributions in data. In addition, all the MC samples are reweighted to account for small di↵erences in the efficiencies of physics-object reconstruction and identification with respect to those measured in data.
The detail of the nominal MC sample is described in the following sections, while the setups
to estimate and model the impact of theoretical uncertainties are discussed in Chapter8.
Process ME generator ME decay, PS, and UE Cross-section
PDF Hadronization tune order
t¯t Powheg-Box v2 CT10 Pythia 6 P2012 NNLO+NNLL [43–48]
Single top Powheg-Box v1/v2 CT10 Pythia 6 P2012 NNLO+NNLL [49–51]
W/Z+jets Sherpa 2.2 NNPDF3.0 NNLO Sherpa Sherpa NNLO [52]
Diboson Sherpa 2.1.1 CT10 Sherpa Sherpa NLO
t¯t + W/Z MG5 aMC@NLO 2.2.2 NNPDF2.3 Pythia 8 A14 NLO [53]
t¯t + MG5 aMC@NLO 2.2.3 CTEQ6L1 Pythia 8 A14 NLO [53]
Signal MG5 aMC@NLO 2.2.2 NNPDF2.3 Pythia 8 A14 NLO+NLL [54]
Table 3.2: Summary of setups of the nominal MC samples. All the MC samples are normalized
to the highest-order (in ↵S) cross section available as indicated in the last column.
3.2.1
Signal
The signal samples are based on a simplified model [55,56], assuming that the branching ratio of
˜
t1! t ˜01is 100%. The ˜01 is taken to be a pure bino as a benchmark model. The signal samples
are generated at LO with MG5 aMC@NLO 2.2.2 [53] as a matrix element (ME) generator of
pp ! ˜t1˜t1 process, accompanied by NNPDF2.3 [57] PDF (Parton Distribution Function) set
along with the A14 [58] set of underlying-event tuned parameters (UE tune). For decay, parton
shower (PS), and hadronization, Pythia 8 [59] generator is used. Since the kinematics of signal
events highly depend on the masses of ˜t1 and ˜01, the signal samples are generated in a grid
across the plane of ˜t1 and ˜01masses (from (m˜t1, m˜01) = (200,12) GeV to (1000,600) GeV) with
a spacing of 50 GeV for most of the plane. The grid spacing around the ‘Diagonal’ region where
m˜t1 approaches mt+ m˜01 is finer. All the mass points produced are shown in Figure 1.8. The
produced samples are normalized to the cross sections at NLO also including resummation of
Figure 3.1: NLO and NLL cross section of the signal event as a function of m˜t1 [54], to which all
signal samples are normalized. The cross section just only depends on m˜t1 and not depend on
either m˜0
1 or decay mode (˜t1! t ˜
0
1 or ˜t1! bW ˜01). The band indicates theoretical uncertainty
taken from an envelopment of systematic error on PDF sets and factorization and renormalization
scales, as described in [60].
3.2.2
t¯
t
t¯t samples are generated at NLO with Powheg-Box v2 [61–65] as ME generator, accompanied
by CT10 [66] NLO PDF set along with the P2012 [67] set of UE-tuned parameters. For PS and
hadronization, Pythia 6 [68] generator is used. The cross section is normalized to the cross
section at NNLO and NNLL, 831.78 pb [43–48]. More details can be seen in [69].
3.2.3
Single Top
Figure3.2shows 3 types of single top events, s-channel, t-channel, and W t associated production.
Single top samples are produced with the same generator combination as t¯t sample, except that
ME generator for electroweak t-channel single top events is Powheg-Box v1 generator instead of Powheg-Box v2 generator. The cross section is normalized to the cross section at NNLO and NNLL, 145.45 pb (s-channel: 3.35 pb, t-channel: 70.43 pb, W t associated production:
71.67 pb) [49–51]. More details can be seen in [69]. The dominant remaining process after event
Figure 3.2: Feynman diagrams of s-channel (a), t-channel (b), and W t associated production (c) of single top events.
3.2.4
W/Z+jets
W/Z+jets samples are generated at NLO by Sherpa 2.2 [70] ME generator along with Comix [71]
and OpenLoops [72] ME generators. For W/Z+jets samples, a simplified scale setting
prescrip-tion in the multi-parton matrix elements is used to improve the event generaprescrip-tion speed. A theory-based re-weighting of the jet multiplicity distribution is applied event by event that is
derived from event generation with a strict scale prescription [73]. The PDF set is NNPDF 3.0
NNLO [74] along with the default UE tune provided by the authors of Sherpa. Sherpa is also
used as decay, PS, and hadronization generator [75]. The cross sections are normalized to the
cross sections at NNLO, 60180.48 pb and 17662.80 pb for W +jets and Z+jets, respectively [52].
More details can be seen in [76]. Since Z+jets process provides two leptons, it can be highly
reduced by requiring exact one lepton. Therefore, mainly W +jets remains after event selections.
3.2.5
t¯
t + W/Z
Figure 3.3(a)-3.3(d) shows t¯t + W/Z events. t¯t + W/Z samples are generated with at LO for
Resolved and Boosted and at NLO for Diagonal. with MG5 aMC@NLO 2.2.2 [53] as ME
generator, accompanied by NNPDF2.3 [57] PDF set along with the A14 [58] set of UE tune.
For decay, PS, and hadronization, Pythia 8 [59] generator is used. For LO samples, the cross
sections is normalized to the cross sections at NLO, 0.61 pb and 0.87 pb for t¯t +W and t¯t +Z,
respectively [53]. More details can be seen in [77]. The dominant remaining process after event
selections is t¯t + Z(! ⌫ ¯⌫) channel (its NLO cross section produced by its branching ratio is
0.17 pb) because its event topology is similar to the signal.
3.2.6
t¯
t +
t¯t + samples are generated at LO with the same configuration as t¯t + W/Z samples except
that MG5 aMC@NLO 2.2.3 and CTEQ6L1 [78] LO PDF set are used. The cross section is
normalized to the cross sections at NLO, 4.38 pb [53]. More details can be seen in [69]. t¯t +
events are used to estimate t¯t + Z(! ⌫⌫) background by regarding as the Z ! ⌫ ¯⌫ branch
shown in Figure3.3(b)-3.3(d)2. The detail and the systematic uncertainty of the estimation are
described in Section6.2and Section8.6.
¯ u t ¯ t d W − u ℓ ¯ ν (a) t¯t + W ¯ u t ¯ t u ¯ ν ν Z u (b) t¯t + Z(! ⌫ ¯⌫) (1/3) g g ¯ t t Z ν ¯ ν (c) t¯t + Z(! ⌫ ¯⌫) (2/3) g g ¯ t t Z ν ¯ ν (d) t¯t + Z(! ⌫ ¯⌫) (3/3)
Figure 3.3: Feynman diagrams of t¯t + W (! `⌫) (a), t¯t+ Z(! ⌫ ¯⌫) (b)-(d).
3.2.7
Diboson
Diboson samples (W W , W Z, ZZ) are generated at NLO by Sherpa 2.1.1 [70] ME generator
along with Comix [71] and OpenLoops [72] ME generators. The o↵-shell bosons are also
con-sidered in the generation. The PDF set is CT10 [66] NLO PDF set along with the UE tune
provided by authors of Sherpa. Sherpa is also used as PS and hadronization generator [75].
The cross section at NLO provided by the generator, 136.78 pb, is used. More details can be
Chapter 4
Physics Object Definition
This chapter introduces definition of physics objects, which is commonly used in Boosted, Re-solved, and Diagonal analyses. In this thesis, ‘physics object’ means a reconstructed particle (or a reconstructed 4-momentum) with a label like electron, muon, photon, jet, b-jet, ⌧-jet, etc. Since the reconstruction and the labeling are based on measurements with a limited detector accep-tance in a high-density environment, for example, an electron in a signal event is sometimes not reconstructed due to outside acceptance or a b from W decay is sometimes labeled as not b-jet but jet due to a limitation of b-tagging algorithm. These e↵ects are not negligible and therefore considered in the definitions of physics objects and event selections.
In the analysis, electrons and muons from W -boson decay must be reconstructed and labeled correctly, but electrons and muons from the other sources not. For example, leptons from c/b-jet are not important. To distinguish them, generally the former is called isolated lepton and the latter is called non-isolated lepton. To pick up only isolated ones, electron and muon definitions
in the analysis include ‘isolation’ requirement [80] as described in Section4.2 and4.3.
In the labeling of physics objects, there are two levels called baseline and signal. The signal-level physics objects are defined by the tighter requirements than baseline-signal-level physics objects, thus the efficiency of baseline-level labeling is higher than signal-level labeling, but the fake rate of signal-level labeling is lower than baseline-level labeling. Therefore, baseline objects are used to compute the missing transverse momentum and to apply a second-lepton veto to suppress
events with t¯t dileptonic event. Because of the reliability of signal-level labeling, signal objects
are mostly used in the event selection.
Since there is no priority among all the labeling (identification) algorithms by default, some-times physics objects could have more than one label. To avoid physics objects to have more
than one label, an overlap removal procedure described in Section4.7is applied just after all the
reconstruction and the labeling. All baseline and signal objects are also required to survive the overlap removal procedure.
Section 4.1 introduces the definition of a primary vertex, which is used for definitions of
the other physics objects. Section 4.2-4.6 introduce the definitions of electron, muon, photon,
jet, and missing transverse momentum. Section 4.7 describes the overlap removal procedure.
4.1
Primary Vertex
The primary vertex is defined by a reconstructed vertex with the highestPi2TpT2i, where T is
a set of all tracks used to reconstruct the vertex. Furthermore, the primary vertex is required to
have at least two tracks with pT> 400 MeV. In order to confirm that there is at least one hard
pp collision in an event, all events are required to have at least one primary vertex. The primary vertex is also used as a reference point of impact parameters of electron and muon candidates.
4.2
Electron
Electron candidates are reconstructed from electromagnetic calorimeter cell clusters that are matched to tracks reconstructed in the ID system. Baseline electrons are required to have
pT > 7 GeV, |⌘| < 2.47, and satisfy ‘VeryLoose’ likelihood identification criteria described
in [81].
Signal electrons in Resolved and Boosted are required to pass all baseline requirements and
have pT > 25 GeV, satisfy ‘Loose’ likelihood identification criteria [81], and have impact
pa-rameters with respect to the reconstructed primary vertex along the beam axis (z0) and in
the transverse plane (d0) that satisfy |z0sin ✓| < 0.5 mm and |d0|/ d0 < 5, where d0 is the
uncertainty of d0. Furthermore, the signal electrons in Resolved and Boosted must pass
‘Loose-TrackOnly’ isolation criteria. The LooseTrackOnly isolation criteria use track-based information
to obtain a 99% efficiency that is independent of pT. These values are estimated from Z ! ``
MC samples and confirmed in data [80].
Signal electrons in Diagonal are required to pass all baseline requirements and also have
pT > 27 GeV, satisfy ‘Tight’ likelihood identification criteria [81], and have the same impact
parameter requirements as the signal electrons in Resolved and Boosted. Furthermore, the signal electrons in Diagonal must pass ‘GradientLoose’ isolation criteria. The GradientLoose isolation criteria use both caloriemter-cell and track-based information to obtain a 95(99)% efficiency
at pT = 25(60) GeV. These values are estimated from Z ! `` MC samples and confirmed in
data [80].
The reason why the signal electrons in Diagonal are more tightly defined than Resolved and Boosted is that single electron triggers are used in Diagonal strategy and not used in Resolved or Boosted. Therefore, a little bit tighter definition is required to use the triggers introduced in
Section3.1.
4.3
Muon
Typically, a muon is reconstructed from a track reconstructed by combining two tracks in the ID and the MS. In order to improve the muon reconstruction efficiency, a track in the ID matched to a track segment in the MS, a track in the MS not matched to any tracks in the ID, or a track in the ID matched to an energy deposit in the calorimeter compatible with a minimum-ionizing
particle (referred to as calo-tagged muon) [82] is also used to reconstruct a muon. Baseline muons
are required to have pT> 6 GeV, |⌘| < 2.6, and satisfy ‘Loose’ identification criteria described
in [82].
![Figure 1.5: Two-loop renormalization group evolution of the inverse gauge couplings ↵ a 1 (Q) in the SM (dashed lines) and the MSSM (solid lines) [6]](https://thumb-ap.123doks.com/thumbv2/123deta/8494099.922249/13.892.231.670.104.461/figure-renormalization-group-evolution-inverse-gauge-couplings-dashed.webp)
![Figure 2.1: The CERN accelerator complex [31]. The LHC is the last ring (dark blue line) in a complex chain of particle accelerators.](https://thumb-ap.123doks.com/thumbv2/123deta/8494099.922249/20.892.205.700.627.985/figure-cern-accelerator-complex-complex-chain-particle-accelerators.webp)
![Figure 2.7: R-z cross-sectional view of the layout of the ATLAS Inner Detector for Run-2 [34].](https://thumb-ap.123doks.com/thumbv2/123deta/8494099.922249/25.892.162.726.117.517/figure-cross-sectional-view-layout-atlas-inner-detector.webp)
![Figure 2.8: A cut-away view of the ATLAS calorimeter [35].](https://thumb-ap.123doks.com/thumbv2/123deta/8494099.922249/26.892.147.742.170.545/figure-cut-away-view-atlas-calorimeter.webp)
![Figure 2.20: The ATLAS trigger and data acquisition (TDAQ) system in Run-2 [39]. New features with respect to the Run-1 system are indicated with orange boxes.](https://thumb-ap.123doks.com/thumbv2/123deta/8494099.922249/34.892.142.752.418.739/figure-atlas-trigger-acquisition-features-respect-indicated-orange.webp)
![Figure 5.1: Illustration of of m ⌧ T2 (left) and am T2 (right) variables, which are used to discriminate against t ¯t ! [b`⌫][b⌧ h ⌫ ] event (left) and t ¯t ! [b`⌫][b` lost ⌫] where ` lost is an undetected (lost) lepton or ⌧ h due to outside acceptance](https://thumb-ap.123doks.com/thumbv2/123deta/8494099.922249/48.892.151.703.115.356/figure-illustration-variables-discriminate-undetected-lepton-outside-acceptance.webp)


![Figure 7.1: Comparison of the four interpolation options implemented in HistFactory [116] for four di↵erent models (a)-(d)](https://thumb-ap.123doks.com/thumbv2/123deta/8494099.922249/97.892.225.670.314.772/figure-comparison-interpolation-options-implemented-histfactory-erent-models.webp)
