幌満かんらん岩中の輝石-スピネル集合体の歪解析
著者
澤口 隆
雑誌名
東洋大学紀要, 自然科学篇
号
55
ページ
1-16
発行年
2011-03
URL
http://id.nii.ac.jp/1060/00000122/
Creative Commons : 表示 - 非営利 - 改変禁止 http://creativecommons.org/licenses/by-nc-nd/3.0/deed.jaAbstract
In order to understand the difference of type of lithologic layering in the Horoman peridotite complex, this paper examines a three-dimensional strain analysis of pyroxene-spinel seams in the Horoman peridotites. The Equigranular and Internal Shear Zones have suffered 19 % of thinning normal to the foliation relative to the Porphyroclastic and Basal Shear Zones. Although this is consistent to that deformation overprinting history of the Harman peridotites, estimated thinning ratio of 19 % is not adequate to explain the difference of the lithological thickness of the Upper and Lower Zones. It requires fur ther understandings of strain partitioning between peridotites and gabbros.
Keywords: Horoman peridotite complex, strain analysis, pyroxene-spinel seam, lithologic layering
1. Introduction
An orogenic peridotite massif, which formerly composed upper mantle and exposes as a large-scale fragment on the earth’s surface, is one of the best samples to understand processes of melt segregation and their transport in the upper mantle. The Horoman peridotite complex, Hokkaido, northern Japan is well known to have a symmetric layered structure consisting of peridotites and magmatic rocks (Komatsu and Nochi, 1966, Niida, 1984, Obata and Nagahara, 1987, Takahashi, 1991). Many researchers have discussed the origin of the lithologic layering and mantle processes recorded in the Horoman peridotites (Niida, 1984, Obata and Nagahara, 1987, Takahashi, 1991, 1992, Takazawa, 1992, 1996, 1999, Morishita, 1999, Toramaru, 1997, Toramaru et al., 2001). Toramaru (1997) and Toramaru et al. (2001) examined symmetric pattern of the gabbro bands and explained such scale-invariant lithologic layering of the Horoman peridotite complex with the stretching and bending during deformation (or stream line mixing).
In order to understand the difference of the type of lithologic layering and its relation to mantle processes, we should compare the state of strain of the peridotite itself and the
Strain Analysis of Ellipsoidal Pyroxene-Spinel Seams in
the Horoman Peridotites
Takashi S
AWAGUCHI*2 Takashi SAWAGUCHI
thickness of layering. This paper shows a result of three-dimensional strain analysis of pyroxene-spinel seams in the Horoman peridotites.
2. Geological background
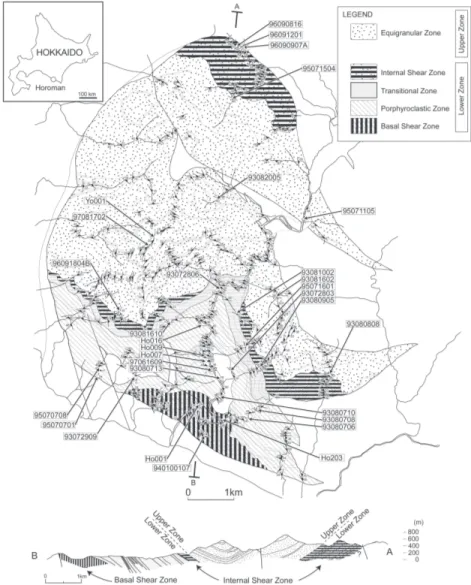
The Horoman peridotite complex is one of the Alpine-type peridotite massifs located at the southwestern margin of the Hidaka metamorphic belt, Hokkaido, Japan, and exposed over 8 × 10 km in size (Fig. 1). A characteristic lithologic layering, which consists of plagioclase-lherzolite, spinel-plagioclase-lherzolite, harzburgite and dunite, with subsidiary pyroxenite and mafic
layers, is thought to be almost parallel to foliation (Niida, 1974). Foliation and lineation of the peridotites are defined by lenticular shapes of fine-grained seams consisting of spinel + orthopyroxene + clinopyroxene in spinel lherzolite and of spinel + plagioclase + olivine in plagioclase lherzolite, arrangement of spinel grains and elongated or thopyroxene porphyroclasts.
The complex is divided into the Upper Zone and the Lower Zone on the basis of the rock composition and thickness of layered structure (Komatsu and Nochi, 1966, Niida, 1974). The Upper Zone exhibits a conspicuous layered structure consisting of thin (a few mm to tens of meter) compositional layers with sharp layer boundaries. The Lower Zone has thick (several tens or hundreds of meter) layered structure and is characterized by a gradual compositional layering. Cyclic layering which starts from harzburgite in the center through spinel lherzolite to plagioclase lherzolite at both extremities were recognized at least four times in the Lower Zone along the Horoman River (Niida, 1974). Total thickness of compositional layering is about 3.7 km; 1 km for the Upper Zone and 2.7 km for the Lower Zone (Sawaguchi, 2001, 2004).
From the structural analysis of deformation microstructures, the massif can be divided into fi ve structural units parallel to the lithological layering as follows; (1) Equigranular Zone, (2) Internal Shear Zone, (3) Transitional Zone, (4) Porphyroclastic Zone and (5) Basal Shear Zone (Fig. 1. Sawaguchi, 2004). Two large-scale ductile shear zones can be recognized by different pattern of grain-size reduction of olivine at the middle horizon and basal part. Each shear zone is called the Internal Shear Zone and the Basal Shear Zone, respectively.
The Upper Zone (Lithologic classifi cation) almost corresponds to the Equigranular Zone (structural classifi cation), and the Lower Zone corresponds to the other 4 zones (Internal Shear Zone, Transitional Zone, Porphyroclastic and Basal Shear Zone). A top-to-the-south ductile deformation had overprinted only on the Equigranular and Internal Shear Zones (Sawaguchi, 2004).
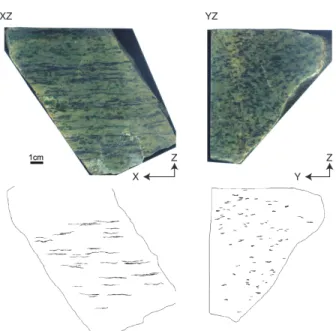
Foliation and lineation in the Horoman peridotite are clearly recognized by the lenticular shape of the fi ne-grained seam consisting of spinel + orthopyroxene + clinopyroxene in spinel lherzolite and of spinel + plagioclase + olivine in plagioclase lherzolite in both Upper and Lower Zones (Fig. 2). These seams are thought to be formed by sub-solidus reaction of pyrope garnet + olivine (Takahashi and Arai, 1987, Ozawa and Takahashi, 1995). Because pyroxene + spinel seam in symplectite-bearing spinel lherzolite frequently includes several pyroxene-spinel symplectite (garnet pseudomorph), it is apparent that the ellipsoidal shape of the seam does not represent the state of strain in the peridotite. However, structural elements (foliation and lineation) defi ned by the ellipsoidal seam correspond to the lattice preferred orientation of olivine. This implies that principle axes of strain for the ellipsoidal seam have close relation to the bulk-strain in the peridotite. Strain analysis of ellipsoidal seams is benefi cial to compare differences of the strain state between the Upper and Lower Zones.
4 Takashi SAWAGUCHI
3. Methods
Hand-specimen samples of the symplectite-bearing spinel lherzolite (and some plagioclase lherzolite) were collected from all structural units covering the whole massif area, and polished on the surface with #800 carborundum. The XZ (foliation normal, lineation parallel) and YZ (foliation normal, lineation normal) polished sections were directly scanned on an image-scanner attached with a Macintosh-computer in order to obtain digital photo-images. Obtained photo-images were opened with the Adobe-Photoshop application and the pyroxene-spinel seams were traced on the other layer. The traced-image was individually saved as an 8-bit TIFF fi le. Strain analyses of the seam on XZ and YZ planes were made by NIH-Image application. Best-fit ellipses for distinct particles (seams) were calculated by “Analyze Particles” command. “Ellipse major axis, Ellipse minor axis, and Angle” were
selected as parameters to be measured.
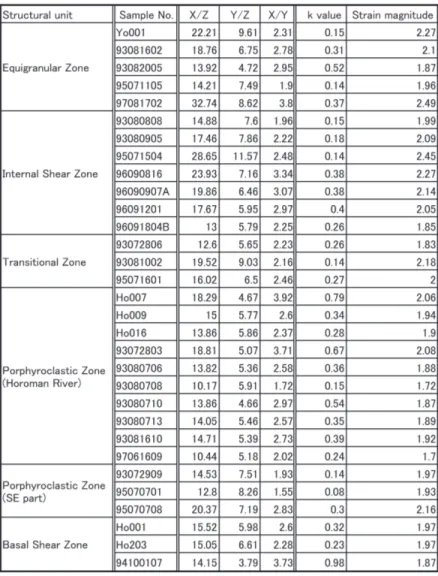
Major and minor axes of each seam on the XZ and YZ plane plot on the graph of X-Z and Y-Z relationships. Average ratio X/Z and Y/Z were obtained by least squares method. The X/ Y ratio is mathematically calculated as X/Y=(X/Z)/(Y/Z). A strain state is represented on the Flinn diagram (Flinn, 1962). A strain-state parameter, value of k is,
k b a 1 1 =
where a=X/Y and b=Y/Z.
The line k=1 characterizes all plane strain ellipsoids. The region for which 0 ≤ k<1 and 1<k ≤∞ show constrictional and fl attening strain, respectively.
The distance of a data point from the origin (1:1) is indicative of the overall strain. The magnitude of the overall strain is expressed as,
fs / / / ln ln lnX Y X Z Y Z 3 2 2 2 = ^ h +^ h ^ h
6 Takashi SAWAGUCHI
4. Results
4.1 Equigranular Zone
Five samples from the Equigranular Zone were measured. The ratio X/Z disperses ranging 13 ~ 33. The ratio Y/Z exceeds 6 except one sample and the highest ratio is 9.6. All
Fig. 3. Axial ratios of pyroxene-spinel seams in the Equigranular Zone. Solid diagonal lines were obtained
sample plot in the fi eld of fl attening (Fig. 3, Table 1). The value of k ranges 0.14 ~ 0.52. The strain magnitude parameter fs ranges 1.87 ~ 2.49.
4.2 Internal Shear Zone
Seven samples from the Internal Shear Zone are measured. The ratio X/Z disperses ranging 13 ~ 29. The ratio Y/Z exceed almost 6 and the highest ratio is 11.57. All sample plot in the field of flattening (Fig. 4, Table 1). The value of k ranges 0.14 ~ 0.38. The strain
Fig. 4. Axial ratios of pyroxene-spinel seams in the Internal Shear Zone. Solid diagonal lines were obtained
8 Takashi SAWAGUCHI
magnitude parameter fs ranges 1.85 ~ 2.45.
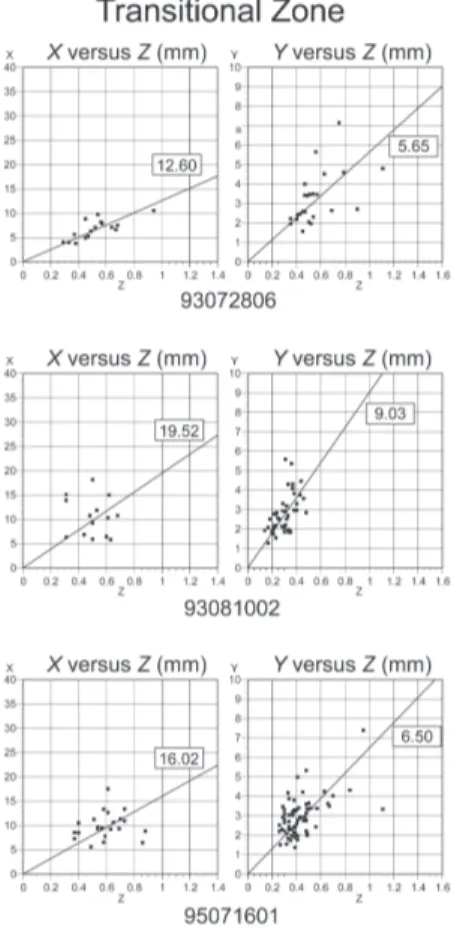
4.3 Transitional Zone
Three samples from the Transitional Zone are measured. The ratio X/Z ranges 12 ~ 20. The ratio Y/Z ranges 5 ~ 9. All sample plot in the fi eld of fl attening (Fig. 5, Table 1). The value of k ranges 0.14 ~ 0.27. The strain magnitude parameter fs ranges 1.83 ~ 2.18.
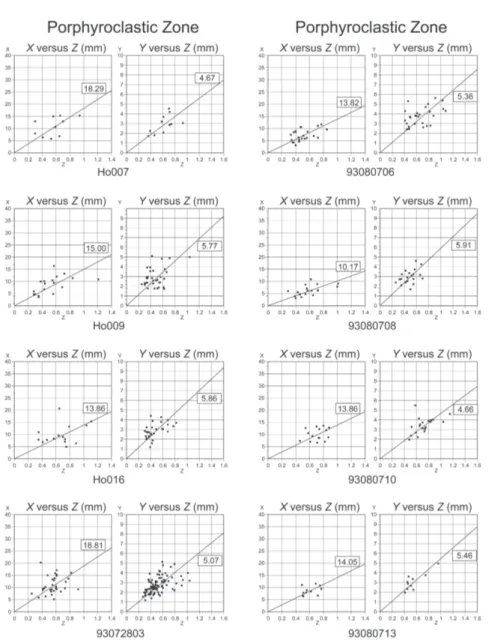
4.4 Porphyroclastic Zone
Thirteen samples from the Porphyroclastic Zone are measured. Since three samples at the southwestern part of the Horoman peridotite complex shows a different tendency, it is separately described from the samples in the Horoman River part.
Horoman River part : The ratio X/Z ranges 10 ~ 19. The ratio Y/Z are lower than 6. All sample plot in the fi eld of fl attening (Fig. 6, Table 1). The value of k ranges 0.15 ~ 0.79. The strain magnitude parameter fs ranges 1.72 ~ 2.08.
Fig. 5. Axial ratios of pyroxene-spinel seams in the Internal Shear Zone. Solid diagonal lines were obtained
Southeastern part : The ratio X/Z ranges 12 ~ 21. The ratio Y/Z exceeds 7. All sample plot in the field of flattening (Fig. 6, Table 1). The value of k ranges 0.08 ~ 0.30. The strain magnitude parameter fs ranges 1.93 ~ 2.16.
Fig. 6. Axial ratios of pyroxene-spinel seams in the Porphyroclastic Zone. Solid diagonal lines were
10 Takashi SAWAGUCHI
4.5 Basal Shear Zone
Three samples from the Basal Shear Zone are measured. The ratio X/Z ranges 14 ~ 15. The ratio Y/Z ranges 3 ~ 7. All sample plot in the fi eld of fl attening (Fig. 7, Table 1). The value of k ranges 0.23 ~ 0.98. The strain magnitude parameter fs ranges 1.87 ~ 1.97.
5. Discussion
5.1. Difference of strain in each structural unit
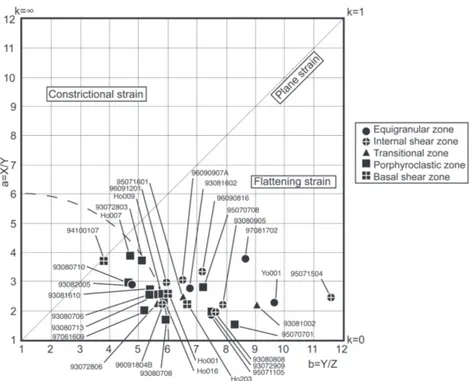
Strain state and magnitude are clearly represented on a Flinn diagram. The ellipsoidal seams from the all structural units plot in the fi eld of fl attening strain (Fig. 8). Most samples shows strong fl attening strain (k < 0.6), whereas some samples in the Porphyroclastic Zone and the Basal Shear Zone show more or less plane strain (0.6 < k < 1.0). The most important features recognized in the Flinn diagram is that the seams in the Equigranular Zone and the
Fig. 7. Axial ratios of pyroxene-spinel seams in the Basal Shear Zone. Solid diagonal lines were obtained
by least square method.
Fig. 8. Flinn diagram representing strain state derived from the pyroxene-spinel seams. Note that seams in
the Equigranular Zone and the Internal Shear Zone plot relatively far from the origin (1:1) than that in the Porphyroclastic Zone and the Basal Shear Zone.
12 Takashi SAWAGUCHI
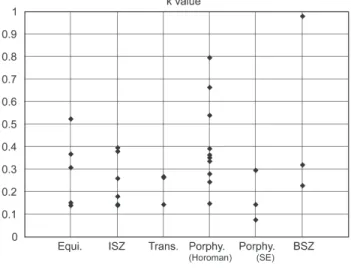
Internal Shear Zone plot relatively far from the origin (1:1) than those in the Porphyroclastic Zone and the Basal Shear Zone. There is no apparent difference recognized between the Equigranular Zone and the Internal Shear Zone, neither between the Porphyroclastic Zone and the Basal Shear Zone. The strain magnitude parameters in the Equigranular Zone and the Internal Shear Zone are also higher than those in the Porphyroclastic Zone and the Basal Shear Zone (Fig. 9). These features suggest that the magnitude of overall deformation is larger in the Equigranular Zone and the Internal Shear Zone than the Porphyroclastic Zone and the Basal Shear Zone. It is consistent to the conclusion that the deformation in the Equigranular Zone and the Internal Shear Zone had overprinted on the Porphyroclastic Zone (Sawaguchi, 2004).
The representative axial ratio (X:Y:Z) can be calculated from the least square fitting method on the graph-plots (Y/Z versus X/Y, and X/Z versus X/Y). The group of the Equigranular Zone and the Internal Shear Zone shows X:Y:Z = 29.67:11.00:1, and that of the Porphyroclastic Zone and the Basal Shear Zone shows X:Y:Z = 22.46:7.69:1. This also implies the larger strain in the Equigranular Zone and the Internal Shear Zone.
5.2 Estimation of thinning ratio
Here we assume the ellipsoidal seam in the Equigranular Zone and the Internal Shear Zone was equivalent to that in the Porphyroclastic Zone and the Basal Shear Zone before the overprinting of deformation, and estimate an increment of strain due to the overprinting of deformation. Since no chemical reaction is inferred between seams and olivine matrix except initial breakdown of pyrope garnet reacted with olivine (Takahashi and Arai, 1987, Obata et al., 1997), the volume must be unchanged during the deformation. The representative axial ratio X:Y:Z in the group of the Equigranular Zone and the Internal Shear Zone is converted to 24.03:9.00:0.81 by volume-constant assumption (Fig. 10). The extensions along each principal strain axes are; ex= (ΔX/X) = ((24.03-22.46)/22.46) = 7 %, ey= (ΔY/Y) =
((9.00-7.69)/7.69) = 17 %, ez= (ΔZ/Z) = ((0.81-1)/1) = -19 %. Thus thinning ratio normal to the
Fig. 10. Schematic illustration for representative strain ellipsoid in the Porphyroclastic / Basal Shear Zones
14 Takashi SAWAGUCHI
foliation (ez) is 19 %. The thickest dunite layer of the SDW suite at the Upper/Lower Zone
boundary can be pursued from the west (Otsukifushi-zawa River) to the east (Sarushunai-zawa River) in the complex, and thickness varies from 15 m at the Horoman River to 8.6 m at the Taki-no-sawa River (Takahashi, 1997). The SDW layer in the Taki-no-sawa River section underwent the overprinting of deformation in the Internal Shear Zone (Sawaguchi, 2001). This thinning ratio about 42 % ((8.6-15)/15) inferred from the geological observation is twice as large as that inferred from the strain analysis of the ellipsoidal seam. The reason for the difference in estimation is, (i) obser vational errors because of averaging the strain in different samples, (ii) more competent seam refl ect less strain than the overall strain, (iii) dif ference of strain state between the Equigranular / Internal Shear Zones and the Porphyroclastic / Basal Shear Zones prior to the later overprinting of deformation.
Thinning ratio inferred here shows only the increment of strain due to the overprinting of deformation in the Equigranular Zone and the Internal Shear Zone. The discriminated difference between the Upper zone and the Lower Zone is in the thickness of lithologic layering (Niida, 1974). Since the Upper Zone has been overprinted of the later southward deformation whereas the Lower Zone has not, the difference in the thickness of lithologic layering might be responsible for the thinning of the Upper Zone due to the overprinting southward deformation. However the 19 % of thinning ratio is not enough to explain the difference in the thickness of the lithologic layering. Total thinning ratio of the Upper Zone must be much higher than 19 %. The thinning ratio of 19 % inferred from the strain analysis of the ellipsoidal seam is a minimum estimation for thinning of the lithologic layering in the Upper Zone.
6. Conclusions
Although the strain analysis of ellipsoidal pyroxene-spinel seams is consistent to that the Horoman peridotites from the Equigranular and Internal Shear Zones were overprinted by a top-to-the-south deformation, estimated thinning ratio of 19 % is not adequate to explain the difference of the litho logical thickness between the Upper and Lower Zones. It requires further understandings of strain partitioning between the peridotites and gabbros.
Acknowledgement
I would like to express my gratitude to Prof. Takagi of Waseda University for his guidance throughout the work.
References
London, Quart. Jour., 118, 385-433.
Komatsu, M. and Nochi, M. (1966) Ultrabasic rocks in Hidaka metamorphic belt, Hokkaido, Japan. I. Mode of occurrence of the Horoman ultlabasic rocks. Earth Sci., 87, 21-29. * Morishita, T. (1999) Evolution of the Horoman Peridotite Complex and its implications for
the origin of heterogeneous mantle. Ph.D. dissertation, Kanazawa Univ., 182 p.
Niida, K. (1974) Structure of the Horoman ultramafi c mass of the Hidaka metamorphic belt in Hokkaido, Japan. Jour. Geol. Soc. Japan, 80, 31-44.
Niida, K. (1984) Petrology of the Horoman ultramafi c rocks. Jour. Fac. Sci. Hokkaido Univ.
Ser.IV, 21, 61-81.
Obata, M. and Nagahara, N. (1987) Layering of alpine-type peridotite and the segregation of partial melt in the upper mantle. Journal of Geophysical Research 92, 3467-3474.
Obata, M., Morishita, R. and Tanaka, K. (1997) The microstructure of pyroxene-spinel symplectite from the Horoman peridotite and its formation processes. Mem. Geol. Soc.
Japan, no. 47, 163-171. **
Ozawa, K. and Takahashi, N. (1995) P-T history of a mantle diapir : the Horoman peridotite complex, Hokkaido, northern Japan. Contrib. Mineral. Petrol., 120, 223-248.
Sawaguchi, T. (2001) Structural petrology of the Horoman peridotites: deformation history and exhumation processes of the alpine-type peridotite massif. Ph.D. dissertation Waseda
Univ.,193 p.
Sawaguchi, T. (2004) Deformation histor y and exhumation processes of the Horoman Peridotite Complex, Hokkaido, Japan. Tectonophysics, 379, 109-126.
Takahashi, N. (1991) Origin of three peridotite suites from Horoman peridotite complex, Hokkaido, Japan; melt segregation and solidification process in the upper mantle. Jour.
Assoc. Mineral. Petrol. Econ. Geol., 86, 199-215.
Takahashi, N. (1992) Evidence for melt segregation toward fractures in the Horoman mantle peridotite complex. Nature, 359, 52-55.
Takahashi, N. (1997) Incipient melting of mantle peridotites observed in the Horoman and Nikanbetsu Peridotite Complexes, Hokkaido, northern Japan. Jour. Miner. Petrol. Econ.
Geol., 92, 1-24.
Takahashi, N. and Arai, S. (1989) Textural and chemical features of chromatin spinel-pyroxene symplectites in the Horoman peridotites, Hokkaido, Japan. Sci. Rep. Inst.Geosci.
Univ. Tsukuba Sec.B 10, 45-55.
Takazawa, E. et al. (1992) Geochemical evidence for melt migration and reaction in the upper mantle. Nature, 359, 55-58.
Takazawa, E. et al. (1996) Evolution of the Horoman Peridotite (Hokkaido, Japan): Implications from pyroxene compositions. Chem. Geol., 134, 3-26.
Takazawa, E. et al. (1999) Whole rock compositional variations in an upper mantle peridotite (Horoman, Hokkaido, Japan): Are they consistent with a partial melting process? Geochim.
16 Takashi SAWAGUCHI
Toramaru, A. (1997) Origin of layered structure of the Horoman ultramafi c complex. Mem.
Geol. Soc. Japan, 47, p.185-192.
Toramaru, A. et al. (2001) Model of layering formation in a mantle peridotite (Horoman, Hokkaido, Japan), Earth Planet. Sci. Lett., 185 299-313.
* In Japanese
** In Japanese with English abstract