Significance of serum N-glycan profiling as a diagnostic biomarker in
urothelial carcinoma
(血清N-glycan profilingの尿路上皮癌診断バイオマーカーとしての有用性)
申請者 弘前大学大学院医学研究科
腫瘍制御科学領域
泌尿器腫瘍学教育研究分野
氏 名 及 川 真 亮
指導教授 大 山 力
Abstract
Background: The clinical diagnosis of urothelial carcinoma (UC) relies on invasive methods
in patients with hematuria. Although more sensitive and noninvasive screening methods are required, a specific serum biomarker for UC is lacking.
Objective: To examine whether the serum glycan-based biomarkers can be applied to detecting UC.
Design, setting, and participants: Between April 1994 and June 2016, serum N-glycan
concentrations were retrospectively measured in 212 patients with UC before treatment (UC group) and 212 pair-matched controls (VLT group) using glycoblotting and mass spectrometry.
Outcome measurements and statistical analysis: N-glycan levels were compared between
the groups using receiver operating characteristic (ROC) curves to select candidate N-glycans.
We created an N-glycan score based on the combination of candidate N-glycans. The specificity and sensitivity of the candidate N-glycan score were evaluated using ROC curves.
Results and limitations: The N-glycan score was calculated using six N-glycans (m/z 1566,
1687, 1769, 1871, 2011, 2337) that were significantly associated with UC. The median
N-glycan score was significantly higher in the UC group than in the VLT group (5.0 vs. 1.0, P
< 0.001). The N-glycan score correctly classified urothelial carcinoma patients with a
sensitivity, and specificity, and area under the curve of 93%, 81%, and 0.95, respectively. The
limitations of our study included its retrospective nature and non-clinical setting.
Conclusion: Serum N-glycan content has the potential to be a specific and sensitive novel
serum biomarker that may improve the accuracy of detection for UC and reduce unnecessary invasive screening. Validation of this test in a large-scale prospective study is needed.
Patient summary
Combination of serum N-glycan (N-glycan score) is a novel serum marker for urothelial carcinoma that is expressed by 93% of patients and thus is far more sensitive than classic urine cytology. Validation in a large patient cohort is needed.
Introduction
Urothelial carcinoma (UC), including upper tract urothelial carcinoma (UTUC) and bladder carcinoma (BC), has become a common tumor worldwide, and the incidence of UC has increased steadily in recent years [1]. The major symptom of UC is gross or microscopic hematuria. Because it is difficult to visualize small tumors via imaging modalities (such as an ultrasound or computed tomography), patients with hematuria must undergo cystoscopy to rule out urothelial cancer. However, the sensitivity of these invasive methods is limited, especially in UTUC, resulting in under-detection in patients at high risk for cancer or
over-investigation in patients at low risk for cancer. Although more sensitive and noninvasive screening methods are required to improve current clinical practice, a specific serum
biomarker for UC is lacking.
Glycosylation is one of the most common post-epigenetic modifications, and it is estimated to occur in more than 70% of proteins [2]. Glycans are known to have crucial roles in molecular recognition and cell-to-cell interactions, and disorder of the glycan system is related to diseases, especially cancers [3]. Although several glycomics studies have been reported for UC, the data were obtained using cell lines or cancer specimens [4–6]. Recently, our group established a chemo-selective glycan enrichment technology called glycoblotting to purify oligosaccharides from a crude glycoprotein mixture [7] and revealed that serum N-glycomics is promising for screening for diagnostic and prognostic markers for renal cell
carcinoma and castration-resistant prostate cancer [8, 9]. N-glycomics has been also a promising prognostic tool in patients undergoing hemodialysis [10]. However, glycan-based serum biomarkers for UC have not yet been established, and only a few studies with small sample sizes addressed the potential for glycan-based biomarkers in UC [11]. In the present study, we examined serum N-glycans in patients with UC using glycoblotting and evaluated whether serum N-glycan profiling can be applied to the detection of UC.
Materials and Methods
This study was performed in accordance with the ethical standards of the Declaration of Helsinki and approved by the institutional ethics committee of Hirosaki University
Graduate School of Medicine (authorization number, 2015-144). Written or verbal informed consent was obtained from all serum donors.
Between March 2007 and Sep 2015, we treated 1264 patients with UC at Hirosaki University Hospital and Tsugaru General Hospital. Of these, serum samples were obtained from 278 patients (BC: n = 230, UTUC: n = 48) before treatment and stored at −80°C. All tumors were staged according to the 2009 tumor-node-metastasis classification [12]. Control samples were obtained from community-dwelling volunteers in Akita University Hospital, Hirosaki University Hospital, and the health maintenance program of the Iwaki Health
Promotion Project. In total, our serum bank comprised 358 volunteers, and samples were stored at −80°C. Because of the retrospective nature of this study, the backgrounds of patients,
particularly concerning age and sex, were significantly different between the groups. We used the propensity score matching strategy to adjust for patient background and guarantee the validity of serum N-glycan comparisons between patients with UC and volunteers. Propensity scores were calculated using logistic analysis, and the data used in the analyses included age and sex. Finally, 212 patients with UC (UC group) and 212 pair-matched volunteers (VLT group) were enrolled in the present study. We compared N-glycan concentrations (µM) to
detect the presence of UC in the VLT and UC groups and select candidate N-glycans using the area under the curve (AUC), and optimal cutoff values were determined using receiver operating characteristic (ROC) curves. Candidate N-glycans were selected when the concentration was higher or lower than the cutoff value. Based on positive decision, we created an N-glycan score by adding the number of positive candidate N-glycans. The diagnostic accuracy of the N-glycan score was evaluated by ROC curve analysis. The glycan symbol in the present study followed the instructions of the symbol nomenclature for glycan representation [13].
Glycoblotting and Mass Spectrometry
Serum N-glycan analysis was performed as described previously using SweetBlot™
(System Instruments, Hachijo, Japan) [7]. Briefly, 10 µL of serum samples containing 40 pmol of the internal standard disialo-galactosylated bi-antennary N-glycan, which contains amidated sialic acids (A2 amide glycans) (Table S1), were reduced and alkylated using DTT and iodoacetamide (Wako Pure Chemical Industries, Osaka, Japan), respectively. The resulting mixture was then trypsinized and heat-inactivated. After cooling to room
temperature, peptide N-glycanase F (New England BioLabs, Ipswich, MA, USA) was added to the mixture to release total serum N-glycans. After incubating for 360 min at 37°C, 20 µL of the resulting mixture was equivalent to 2.5 µL of serum. An aliquot of each pretreated
sample was mixed with 500 µL of BlotGlyco H beads (Sumitomo Bakelite, Co., Tokyo, Japan) to capture glycans via stable hydrazone bonds on a MultiScreen Solvinert® filter plate (Merck Millipore, Billerica, MA, USA). Then, acetyl capping of unreacted hydrazide
functional groups on the beads and methyl esterification of sialic acid carboxyl groups, which exist in the terminal of the captured glycans, were performed sequentially; then, serial washes were performed before each step, as described previously [8–11]. The captured N-glycans were labeled with benzyloxiamine (BOA, Sigma-Aldrich, St. Louis, MO, USA) by
transamination and eluted in 150 µL of water. The BOA-labeled glycans were detected using matrix-assisted laser desorption/ionization-time of flight (MALDI-TOF) mass spectrometry (Ultraflex 3 TOF/TOF mass spectrometer, Bruker Daltonics, Bremen, Germany). The compositions and structures of glycans were predicted using the GlycoMod Tool
(http://br.expasy.org/tools/glcomod). The quantitative reproducibility test of SweetBlot was performed as described previously [11].
Statistical analysis
Statistical analyses of clinical data were performed using SPSS v. 22.0 (IBM Corporation, Armonk, NY, USA) and GraphPad Prism v. 5.03 (GraphPad Software, San Diego, CA, USA). Categorical variables were reported as percentages and compared using Fisher’s exact test. Quantitative data were expressed as medians with 25th and 75th quartiles
(Q1, Q3). Differences between the groups were statistically compared using Student’s t-test for normally distributed data or the Mann–Whitney U-test for non-normally distributed data.
Differences among three groups were statistically compared using ANOVA (Kruskal-Wallis
test). The optimal cutoff values of the intensity of N-glycans for UC detection were calculated using the formula (1 − sensitivity)2+ (1 − specificity)2 with the ROC curve. Independent
factors influencing a UC diagnosis were identified by multivariate analyses using a logistic regression model. Odds ratio with 95% confidence intervals (95% CIs) were calculated after concurrently adjusting for potential confounders.
Results
We selected 212 patients with UC and 212 pair-matched volunteers as control subjects from our database (Fig. 1A). The backgrounds of the pair-matched subjects are shown in Table 1. There were no significant differences between the VLT and UC groups regarding age, sex, and comorbidities. Most patients (n = 177, 83%) in the UC group experienced BC, and half of the patients (n = 114, 54%) had non-invasive disease. The smoking rate was significantly higher in the UC group (124/166, 75%) compared with the VLT group (41/94, 44%) (P < 0.001).
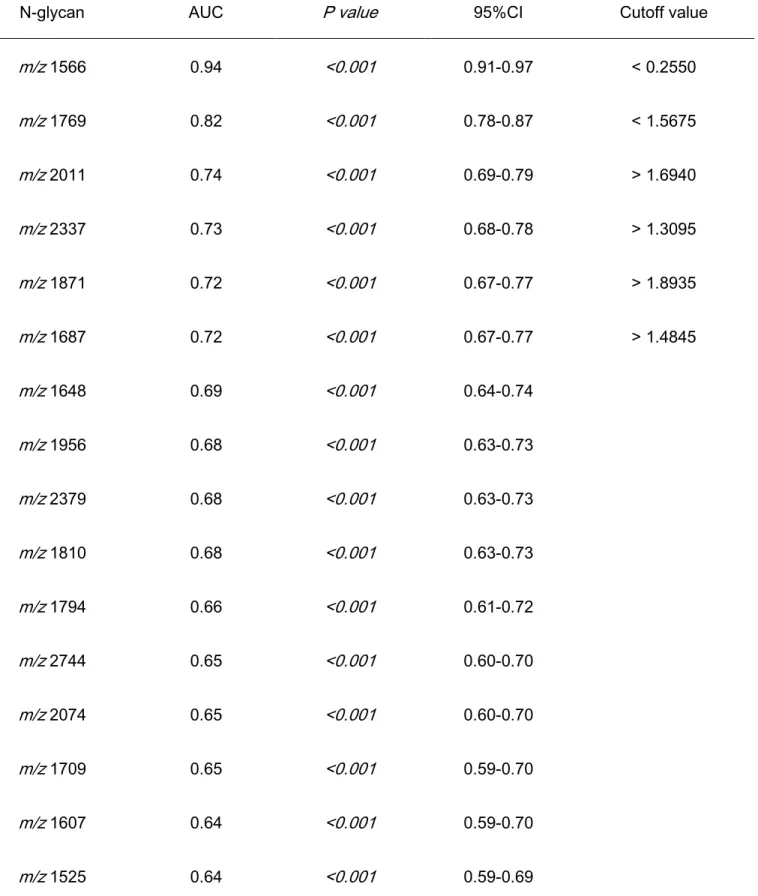
Serum N-glycomics performed using the glycoblotting method and mass spectrometry identified 70 types of BOA-labeled N-glycans in all serum samples. After quantitative reproducibility tests, statistical analysis performed using 36 types of N-glycans (Table S1) revealed good quantitative reproducibility among the samples. Of those, we selected six N-glycans (m/z 1566, 1687, 1769, 1871, 2011, 2337) that had AUCs exceeding 0.70 according to ROC curve analysis (Fig. 1B). Unselected N-glycans with AUCs of 0.65–
0.70 are shown in Supplemental Figure 1 (Fig. S1). Table 2 presents the AUCs and optimal cutoff values for the six selected N-glycans. The levels of N-glycans of the mannose type (m/z 1687, 2011), hybrid type with terminal sialylation (m/z 1871), and complex type with tri- or tetra-antennary glycans (m/z 2337) were significantly increased in the sera of patients with UC, whereas those of the hybrid type (m/z 1566) and complex type with bi-antennary glycans
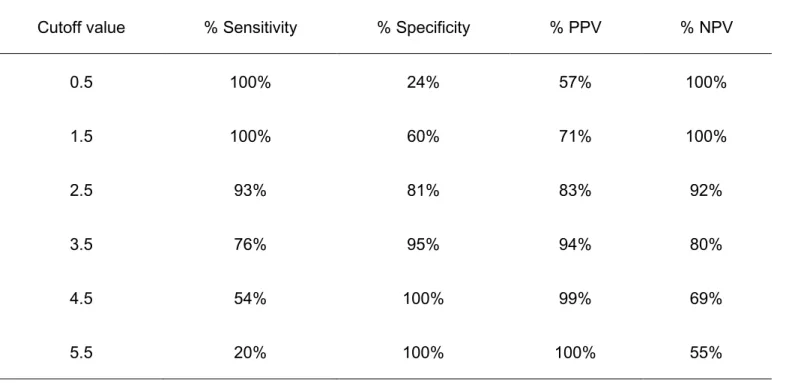
(m/z 1769) were significantly decreased (Fig. 2A). Representative schematics for the six selected N-glycans are shown in Fig. 2B. The optimal cutoff values for the six N-glycans were calculated by ROC curve analysis (Table 2). We regarded the N-glycan as positive when its concentration was higher (m/z 1687, 1871, 2011, and 2337) or lower (m/z 1566 and 1769) than the cutoff value. The total number of positive UC-associated N-glycans was compared between the VLT and UC groups. The median N-glycan score was significantly higher in the UC group than in the VLT group (5.0 vs. 1.0, P < 0.001) (Fig. 3A). There were no significant differences in N-glycan scores between patients with BC or UTUC (Fig. 3B), between those with low grade non-muscle invasive bladder cancer (NMIBC), high grade NMIBC, and muscle invasive bladder cancer (MIBC) (Fig. 3C), or between patients based on the classification of urine cytology (Fig. 3D). The bar plots of N-glycan scores illustrated that patients with UC had higher N-glycan scores (Fig. 3E, red bars) than the volunteers (blue bars). The predictive value of the N-glycan score for UC was significant with an AUC of 0.95 (95% CI = 0.93–0.97, P < 0.001) (Fig. 3F). The optimal cutoff value was defined as 2.5 points with a sensitivity and specificity of 93% and 81%, respectively (Table 3).
Discussion
Quantitative N-glycan analysis is expected to be a useful tool for diagnosing diseases [3]. However, the crucial limitation of structural and functional glycan analysis is the
time-consuming multistep process needed to purify small amounts of glycans from highly complicated mixtures. Therefore, we used a recently established technology of
high-throughput, quantitative N-glycomics. Several studies have been reported using this method in renal cell carcinoma [10], prostate cancer [9], pancreatic cancer [14], and hepatocellular carcinoma [15]. However, only one study [11] investigated the use of serum N-glycans as diagnostic markers for UC. To the best of our knowledge, this is the second and
largest report to demonstrate the clinical significance of serum N-glycan profiling as a diagnostic tool for UC.
In the present study, we identified that a combination of six UC-related N-glycans (N-glycan score) has the potential to predict UC with 93% sensitivity and 81% specificity.
Our results also suggested that its predictive accuracy was not related to the classification of urine cytology, suggesting a higher predictive value for cytology-negative subjects.
Meanwhile, advanced disease was not significantly associated with the N-glycan score. It remains possible that the expression pattern of serum N-glycans might be different between diagnosis and prognosis, as observed in renal cell carcinoma analyses. Currently, serum N-glycan analysis for tumor stage and prognosis in patients with UC is under investigation.
Our next study will address these issues.
The potential role of N-glycans for diagnosing bladder cancer was reported in a previous study [11]. The authors reported that the levels of highly branched, sialylated N-glycans (m/z 2890, 3560, 3865) were increased in the sera of patients with bladder cancer.
The AUCs of m/z 2890, 3560, and 3865 in the previous study were all 0.71. N-glycans m/z 2890 (AUC = 0.61, P < 0.001) and 3865 (AUC = 0.62, P < 0.001) were significantly related to UC in the present study, but m/z 3560 (AUC = 0.53, P = 0.380) was not selected as a UC-related N-glycan. Potential explanations for the discrepant results include the small sample size and age difference between the groups in the previous study. Another is the unknown mechanism for the formation of serum N-glycans. Because the difference between m/z 3560 and m/z 3865 is only one terminal sialic acid (Fig. S1), we might be observing
similar events in the formation of serum N-glycans in patients with UC. Because our understanding of serum N-glycans is not sufficient, further study is necessary to clarify the mechanism of serum N-glycan production.
Our data illustrated that few terminal-sialylated N-glycans were selected in patients with UC. In the prostate cancer analysis, tri- and tetra-antennary complex glycans with terminal sialylation were related to castration-resistant prostate cancer [9]. Fucosylated, highly branched, and sialylated N-glycans are closely related to the detection and prognosis of renal cell carcinoma [10]. At present, it remains unclear why these specific types of
N-glycans are observed in the sera in patients with specific types of cancers. We hypothesize
that carrier proteins may play a key role in aberrant N-glycosylation. Because
immunoglobulin is an N-glycosylated protein in serum [2], N-glycan modification might be reflected in changes in the N-glycosylation of immunoglobulins. It is well known that the glycosylation of immunoglobulin has a critical role in the development of diseases. The overproduction of aberrantly glycosylated IgA1 has a key role in the development of IgA nephropathy [16]. A recent report suggested that antibody-mediated rejection after kidney transplantation is closely associated with the levels of sialylated IgG antibodies [17]. From these observations, glycosylated immunoglobulins have a potential to change their glycans due to cancer immunoreactions. Our unpublished data suggested that BOA-labeled N-glycan levels are below the measurement limit when we exclude the globulin fraction from sera. This result indicates that immunoglobulins are among the potential carrier proteins in sera. The other possibility is the presence of free N-glycans in serum. A recent study demonstrated that the levels of di-sialylated free N-glycans were increased in the sera of patients with
hepatocellular carcinoma [18]. The authors compared sialylated free N-glycan levels between normal controls (n = 10) and patients with hepatocellular carcinoma (n = 10) and found a significant increase in the amount of free N-glycans in patients with hepatocellular carcinoma.
From this observation, they hypothesized that the origin of sialylated free N-glycans might be the liver because serum glycoproteins are produced by the liver. Their results suggested that
liver-delivered free N-glycans may play a role in sera. However, in their result, the amount of di-sialylated free N-glycans was 100 fold lower (pmol/mL) than our results. This suggests that our high-throughput N-glycan analysis detects both free N-glycans and glycoproteins in serum. Although the origin and clinical implications of serum N-glycans remain unclear, our ongoing study should address these issues.
The limitations of the present study were its relatively small sample size,
retrospective nature, selection bias, non-clinical setting, and lack of data on hematuria. In addition, the usefulness of regular follow-up for detecting recurrence remains unclear.
Because urine cytology is not reliable in patients with early-stage urothelial carcinoma, a large-scale prospective validation study in a natural cohort of patients with hematuria is necessary. We can detect serum N-glycans from all samples by our N-glycan analysis.
However, 7% of serum N-glycans showed zero value. Our future study should address the clinical significance of zero value of serum N-glycans. Despite these limitations, the strength of this study was that it is the largest report to assess the implications of serum N-glycan analysis in UC detection. Using a serum-based analysis, we demonstrated an independent association between serum N-glycans and the presence of UC. Our findings may assist to recognize people at high risk for UC, especially UTUC, which may permit further inspection in patients with hematuria.
Conclusions
In conclusion, serum N-glycan profiles acquired by glycoblotting and MALDI-TOF mass spectrometry may represent a potential biomarker for the presence of UC. These analyses may be useful for identifying patients at high risk for UC using a serum-based examination. Future large-scale prospective validation studies may determine the clinical significance of these carbohydrate biomarkers for UC detection.
Acknowledgments: We thank Yukie Nishizawa and Yuki Fujita for their invaluable help with
the data and sample collection.
Figure legends
Fig. 1 Patient and N-glycan selection
Two hundred twelve patients with urothelial carcinoma (UC) were pair-matched for age and sex with the same number of healthy volunteers. Propensity scores were calculated using logistic analysis (A). UC-related N-glycans were selected on the basis of area under the curve values greater than 0.70. A total of six N-glycans were selected as potential biomarkers (B).
Fig. 2 The difference in N-glycan concentration between the groups
N-glycan concentrations were compared between the groups (A). The levels of m/z
1566 and 1769 N-glycans were significantly decreased in the urothelial carcinoma (UC) group. Those of other N-glycans were significantly increased in the UC group. Error bars show 95% confidence intervals. Schematics of the glycans significantly related to UC detection (area under the curve > 0.70) are shown (B). N-glycans of the high mannose (m/z 1687, 2011), hybrid (m/z 1566, 1871), and complex types (m/z 1769, 2337) were selected in the present study.
Fig. 3 The predictive accuracy of the N-glycan score for urothelial carcinoma (UC)
We regarded an N-glycan as positive when its concentration was higher or lower than the cutoff value. A total number of positive UC-associated N-glycans was defined as the N-glycan score. N-glycan scores were significantly higher in patients with UC (A). There was
no significant difference in the N-glycan score between the bladder carcinoma (BC) and upper tract urothelial carcinoma (UTUC) subgroups and (B), between those with low grade non-muscle invasive bladder cancer (NMIBC), high grade NMIBC, and muscle invasive bladder cancer (MIBC) (C). No relationship was observed between the N-glycan score and urine cytology classification (D). Higher N-glycan scores were observed in patients with UC than in the volunteers (E). The diagnostic accuracy of the N-glycan score was evaluated by receiver operating characteristic curve analysis (F).
Fig. S1 Urothelial carcinoma (UC)-related N-glycans
We summarized N-glycans that were significantly related to UC. Complex-type N-glycans were detected as the predominant N-glycan type followed by the high mannose-
type.
References
[1] Antoni S, Ferlay J, Soerjomataram I, Znaor A, Jemal A, Bray F. Bladder Cancer Incidence and Mortality: A Global Overview and Recent Trends. Eur Urol. 2016.
[2] Apweiler R, Hermjakob H, Sharon N. On the frequency of protein glycosylation, as deduced from analysis of the SWISS-PROT database. Biochim Biophys Acta. 1999;1473:4–
8.
[3] Hakomori S. Glycosylation defining cancer malignancy: new wine in an old bottle.
Proceedings of the National Academy of Sciences of the United States of America.
2002;99:10231–3.
[4] Takahashi T, Hagisawa S, Yoshikawa K, Tezuka F, Kaku M, Ohyama C. Predictive value of N-acetylglucosaminyltransferase-V for superficial bladder cancer recurrence. J Urol.
2006;175:90–3; discussion 3.
[5] Ishimura H, Takahashi T, Nakagawa H, Nishimura S, Arai Y, Horikawa Y, et al.
N-acetylglucosaminyltransferase V and beta1-6 branching N-linked oligosaccharides are associated with good prognosis of patients with bladder cancer. Clinical cancer research: an official journal of the American Association for Cancer Research. 2006;12:2506–11.
[6] Yang G, Tan Z, Lu W, Guo J, Yu H, Yu J, et al. Quantitative glycome analysis of N-glycan
patterns in bladder cancer vs normal bladder cells using an integrated strategy. J Proteome Res. 2015;14:639–53.
[7] Nishimura S, Niikura K, Kurogochi M, Matsushita T, Fumoto M, Hinou H, et al.
High-throughput protein glycomics: combined use of chemoselective glycoblotting and MALDI-TOF/TOF mass spectrometry. Angew Chem Int Ed Engl. 2004;44:91–6.
[8] Hatakeyama S, Amano M, Tobisawa Y, Yoneyama T, Tsuchiya N, Habuchi T, et al. Serum N-glycan alteration associated with renal cell carcinoma detected by high throughput glycan analysis. J Urol. 2014;191:805–13.
[9] Ishibashi Y, Tobisawa Y, Hatakeyama S, Ohashi T, Tanaka M, Narita S, et al. Serum tri- and tetra-antennary N-glycan is a potential predictive biomarker for castration-resistant prostate cancer. Prostate. 2014;74:1521–9.
[10] Hatakeyama S, Amano M, Tobisawa Y, Yoneyama T, Tsushima M, Hirose K, et al.
Serum N-glycan profiling predicts prognosis in patients undergoing hemodialysis.
ScientificWorldJournal. 2013;2013:268407.
[11] Takeuchi M, Amano M, Kitamura H, Tsukamoto T, Masumori N, Hirose K, et al. N- and O-glycome analysis of serum and urine from bladder cancer patients using a high-throughput glycoblotting method. J Glycomics Lipidomics. 2013;3.
[12] Sobin LH, Gospodarowicz MK, Wittekind C, International Union against Cancer., ebrary Inc. TNM classification of malignant tumours. 7th ed. Chichester, West Sussex, UK;
Hoboken, NJ: Wiley-Blackwell; 2009.
[13] Varki A, Cummings RD, Esko JD, Freeze HH, Stanley P, Marth JD, et al. Symbol nomenclature for glycan representation. Proteomics. 2009;9:5398–9.
[14] Nouso K, Amano M, Ito YM, Miyahara K, Morimoto Y, Kato H, et al. Clinical utility of high-throughput glycome analysis in patients with pancreatic cancer. J Gastroenterol.
2013;48:1171–9.
[15] Miyahara K, Nouso K, Miyake Y, Nakamura S, Obi S, Amano M, et al. Serum glycan as a prognostic marker in patients with advanced hepatocellular carcinoma treated with
sorafenib. Hepatology (Baltimore, Md). 2014;59:355–6.
[16] Suzuki Y, Suzuki H, Makita Y, Takahata A, Takahashi K, Muto M, et al. Diagnosis and activity assessment of immunoglobulin A nephropathy: current perspectives on noninvasive testing with aberrantly glycosylated immunoglobulin A-related biomarkers.Int J Nephrol Renovasc Dis. 2014;7:409–14.
[17] Malard-Castagnet S, Dugast E, Degauque N, Pallier A, Soulillou JP, Cesbron A, et al.
Sialylation of antibodies in kidney recipients with de novo donor specific antibody, with or without antibody mediated rejection. Hum Immunol. 2015.
[18] Seino J, Fujihira H, Nakakita SI, Masahara-Negishi Y, Miyoshi E, Hirabayashi J, et al.
Occurrence of free sialyl oligosaccharides related to N-glycans (sialyl free N-glycans) in animal sera. Glycobiology. 2016.
Table 1: Background of patients
VLT UC P value
n 212 212
Age (IQR) 70 (64-76) 70 (62-75) 0.907
Gender (Male) 151 (86%) 150 (86%) 0.787
Diabetes 26 (12%) 33 (16%) 0.326
Former or current smoker 41/94 (44%) 124/166 (75%) < 0.001
Cardiovascular disease 37 (17%) 34 (16%) 0.696
Tumor location
Bladder cancer (BC) 177 (83%)
Upper urinary tract carcinoma (UTUC) 35 (17%)
Tumor grade of BC
Low grade NMIBC 65 (37%)
Highgrade NMIBC 42 (24%)
MIBC 70 (40%)
Metastatic disease 20 (9.4%)
NMIBC: non-muscle invasive bladder cancer, MIBC: muscle invasive bladder cancer
Table 2: Significant N-glycans associated with UC detection and their optimal cutoff values. AUC:
area-under-the-curve. 95%CI: 95% confidence interval. *, identified by the previous study
N-glycan AUC P value 95%CI Cutoff value
m/z 1566 0.94 <0.001 0.91-0.97 < 0.2550
m/z 1769 0.82 <0.001 0.78-0.87 < 1.5675
m/z 2011 0.74 <0.001 0.69-0.79 > 1.6940
m/z 2337 0.73 <0.001 0.68-0.78 > 1.3095
m/z 1871 0.72 <0.001 0.67-0.77 > 1.8935
m/z 1687 0.72 <0.001 0.67-0.77 > 1.4845
m/z 1648 0.69 <0.001 0.64-0.74
m/z 1956 0.68 <0.001 0.63-0.73
m/z 2379 0.68 <0.001 0.63-0.73
m/z 1810 0.68 <0.001 0.63-0.73
m/z 1794 0.66 <0.001 0.61-0.72
m/z 2744 0.65 <0.001 0.60-0.70
m/z 2074 0.65 <0.001 0.60-0.70
m/z 1709 0.65 <0.001 0.59-0.70
m/z 1607 0.64 <0.001 0.59-0.70
m/z 1525 0.64 <0.001 0.59-0.69
m/z 1849 0.63 <0.001 0.58-0.69
m/z 2033 0.62 <0.001 0.57-0.67
m/z 3865* 0.62 <0.001 0.56-0.67
m/z 1362 0.61 <0.001 0.56-0.67
m/z 1591 0.61 <0.001 0.56-0.67
m/z 2890* 0.61 <0.001 0.55-0.66
m/z 3195 0.60 <0.001 0.55-0.65
m/z 3049 0.59 0.001 0.54-0.65
m/z 3414 0.58 0.003 0.53-0.64
m/z 1753 0.56 0.031 0.51-0.62
m/z 3560* 0.53 0.380 0.47-0.58
Table 3: Effect on N-glycan score on sensitivity, specificity, positive predictive value (PPV) and negative
predictive value (NPV) at multivariable model cutoff.
Cutoff value % Sensitivity % Specificity % PPV % NPV
0.5 100% 24% 57% 100%
1.5 100% 60% 71% 100%
2.5 93% 81% 83% 92%
3.5 76% 95% 94% 80%
4.5 54% 100% 99% 69%
5.5 20% 100% 100% 55%
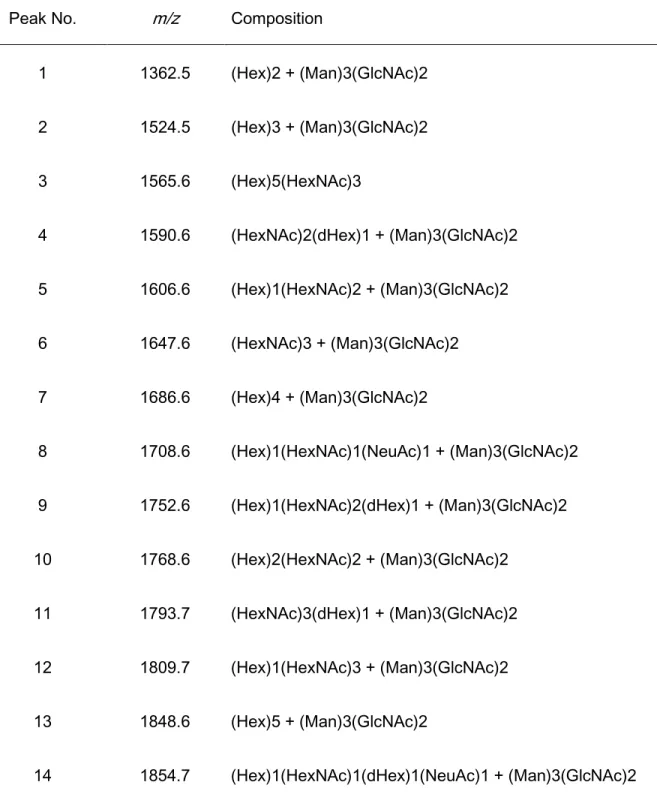
Table S1: The representative 36 types of N-glycans with quantitative reproducibility among all samples. The
N-glycan of m/z 2176 is the internal standard, disialo-galactosylated biantennary N-glycan, that contains
amidated sialic acids (A2 amide glycans). Compositional annotations and putative structures are shown as
abbreviations. Hex: hexose; HexNAc: N-acetylhexosamine; dHex: deoxyhexose.
Peak No. m/z Composition
1 1362.5 (Hex)2 + (Man)3(GlcNAc)2 2 1524.5 (Hex)3 + (Man)3(GlcNAc)2 3 1565.6 (Hex)5(HexNAc)3
4 1590.6 (HexNAc)2(dHex)1 + (Man)3(GlcNAc)2 5 1606.6 (Hex)1(HexNAc)2 + (Man)3(GlcNAc)2 6 1647.6 (HexNAc)3 + (Man)3(GlcNAc)2 7 1686.6 (Hex)4 + (Man)3(GlcNAc)2
8 1708.6 (Hex)1(HexNAc)1(NeuAc)1 + (Man)3(GlcNAc)2 9 1752.6 (Hex)1(HexNAc)2(dHex)1 + (Man)3(GlcNAc)2 10 1768.6 (Hex)2(HexNAc)2 + (Man)3(GlcNAc)2
11 1793.7 (HexNAc)3(dHex)1 + (Man)3(GlcNAc)2 12 1809.7 (Hex)1(HexNAc)3 + (Man)3(GlcNAc)2 13 1848.6 (Hex)5 + (Man)3(GlcNAc)2
14 1854.7 (Hex)1(HexNAc)1(dHex)1(NeuAc)1 + (Man)3(GlcNAc)2
15 1870.7 (Hex)2(HexNAc)1(NeuAc)1 + (Man)3(GlcNAc)2 16 1914.7 (Hex)2(HexNAc)2(dHex)1 + (Man)3(GlcNAc)2 17 1955.7 (Hex)1(HexNAc)3(dHex)1 + (Man)3(GlcNAc)2 18 2010.7 (Hex)6 + (Man)3(GlcNAc)2
19 2032.7 (Hex)3(HexNac)1(NeuAc)1 + (Man)3(GlcNAc)2
20 2057.8 (Hex)1(HexNAc)2(dHex)1(NeuAc)1 + (Man)3(GlcNAc)2 21 2073.8 (Hex)2(HexNAc)2(NeuAc)1+ (Man)3(GlcNAc)2
2175.8 Internal standard (BOA-labeled A2 amide)
22 2219.8 (Hex)2(HexNAc)2(dHex)1(NeuAc)1 + (Man)3(GlcNAc)2 23 2336.9 (Hex)3(HexNAc)4 + (Man)3(GlcNAc)2
24 2378.9 (Hex)2(HexNAc)2(NeuAc)2 + (Man)3(GlcNAc)2
25 2524.9 (Hex)2(HexNAc)2(dHex)1(NeuAc)2 + (Man)3(GlcNAc)2 26 2728.0 (Hex)2(HexNAc)3(dHex)1(NeuAc)2 + (Man)3(GlcNAc)2 27 2744.0 (Hex)3(HexNAc)3(NeuAc)2 + (Man)3(GlcNAc)2
28 2890.1 (Hex)3(HexNAc)3(dHex)1(NeuAc)2 + (Man)3(GlcNAc)2 29 3049.1 (Hex)3(HexNAc)3(NeuAc)3 + (Man)3(GlcNAc)2
30 3109.1 (Hex)4(HexNAc)4(NeuAc)2 + (Man)3(GlcNAc)2
31 3195.2 (Hex)3(HexNAc)3(dHex)1(NeuAc)3 + (Man)3(GlcNAc)2
32 3341.2 (Hex)3 (HexNAc)3 (Deoxyhexose)2 (NeuAc)3 + (Man)3(GlcNAc)2 33 3414.2 (Hex)4(HexNAc)4(NeuAc)3 + (Man)3(GlcNAc)2
34 3560.3 (Hex)4(HexNAc)4(dHex)1(NeuAc)3 + (Man)3(GlcNAc)2 35 3719.3 (Hex)4(HexNAc)4(NeuAc)4 + (Man)3(GlcNAc)2
36 3865.4 (Hex)4(HexNAc)4(dHex)1(NeuAc)4 + (Man)3(GlcNAc)2
UC patients, n=1264 Volunteers,
n=358
Matched
subjects, n=212 Matched patients, n=212
Propensity-score matching (age, sex)
serum available, n=278
A B
Fig. 1
Sensitivity
1 - Specificity
N-glycans
m/z 1687
VLT UC
0 1 2
3 P < 0.0001
µM
m/z 1871
VLT UC
0 1 2 3
< 0.0001 P
µM
m/z 2011
VLT UC
0 1 2
3 P< 0.0001
µM
m/z 2337
VLT UC
0 1
2 P< 0.0001
µM
m/z 1566
VLT UC
0 1 2
3 P< 0.0001
µM
m/z 1769
VLT UC
0 1 2
3 P< 0.0001
µM
m/z 1566
m/z 1769
m/z 2337 m/z 1871 m/z 1687
m/z 2011
or
Fig. 2
A B
Monosaccharide symbol list
Galactose (Gal) Mannose (Man) Fucose (Fuc)
N-Acetylneuraminic acid (Neu5Ac) N-Acetylglucosamine (GlcNAc)
N-glycan scores
1 424
0 1 2 3 4 5 6
UC VLT
Cases
Scores (0-6)
N-glycan score
BC vs. UTUC
BC, n=177 UTUC, n=35 0
2 4 6
8 P =0.2809
N-glycan scores (0-6)
VLT vs. UC
VLT, n=212 UC, n=212 0
2 4 6 8
< 0.0001 P
N-glycan scores (0-6)
Fig. 3
E F
A B C D
Urine cytology
Class I, II Class III Class IV, V 2
4 6 8
0.6956 P =
N-glycan scores (0-6)
Tumor grade
Low, n=65 High, n=42 MIBC, n=70 2
4 6 8
0.4028 P =
NMIBC
N-glycan scores (0-6)
Fig. S1
m/z 1648
m/z 1709 m/z 1794
m/z 1810
m/z 1956
m/z 2074
m/z 2379
m/z 2744
m/z 1607 m/z 1525
m/z 1849
m/z 2033
m/z 3195
m/z 1362 m/z 1591
m/z 2890 m/z 3865
m/z 3560 m/z 3049
m/z 3414
High mannose Complex
Hybrid
bisecting
Tetra-antennary
Tetra-antennary